The Fiscal Health Dashboard is a one-stop shop for legislators and constituents to answer questions about Utah’s current and long-term financial position. The Legislative Fiscal Analyst developed the dashboard in compliance with both UCA 36-12-13(2)(h) and J.R. 3-2-402. Though the statutory and rule requirements are to prepare the legislature for an upcoming General Session, the revenue and expenditure portions of the dashboard are updated monthly. The Fiscal Health Dashboard is organized into four sections: Obligations, Reserves, Expenditures, and Revenues.

Using the Dashboard
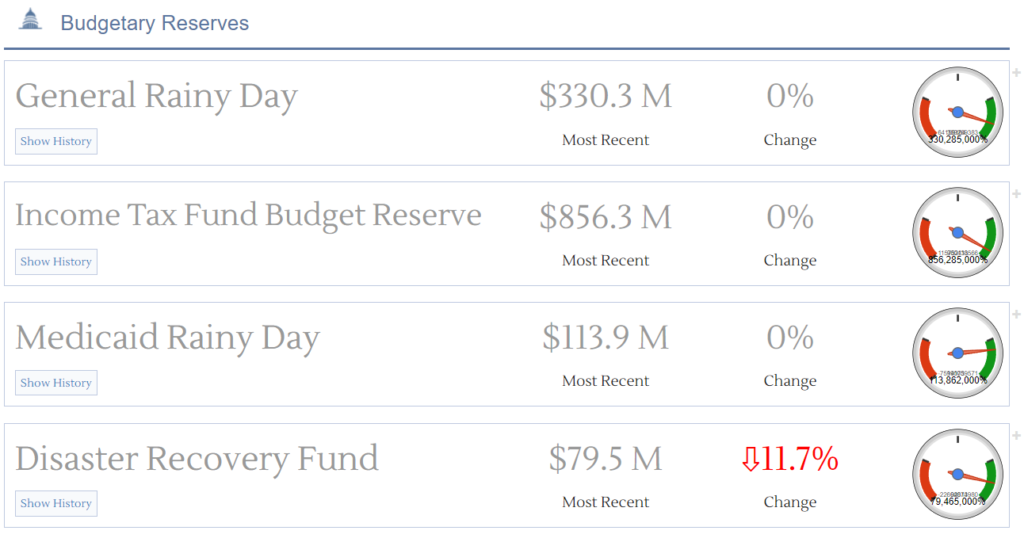
The data includes for each category, 10-year history, current growth rate, and a visual gauge which compares the item’s status to the historical average. The gauges represent trends, where a centered gauge is on trend with the historical average, and the red and green sections are two standard deviations from the mean. As you might expect, higher obligations and expenditures would fall to the red side of the gauge, whereas increases in reserves or expenditures would push the gauge needle towards the green area.

For more information on any category, you can hover over the title of the item and a tooltip will appear that explains what’s included in that area of the budget.

Without further ado, we give you the top five questions answered by the Fiscal Health Dashboard:
1. How close is the state to its constitutional debt limit?
Look no further than the General Obligation Bond Debt graph on the Obligations tab. The state is at about 14% of the constitutional debt limit, as of FY 2023 (FY 2024 is still in closeout and will be updated later this month).

2. What’s the balance of the Permanent State School Fund (Trust Fund)?
Scrolling to the bottom of the Reserves tab, you’ll find information on the Permanent State School Fund, which is sitting squarely in the green section of the fiscal health gauge. As of FY 2023 close out, the fund balance was almost $3.1 billion.

3. Did the General Fund have a surplus in 2024?
The first item on the Revenues tab shows the most recent information for FY 2024, which indicates that the General Fund collections were slightly ahead of revenues, by roughly $30 million. Revenues for FY 2024 are still preliminary, and will change after the final yearend calculations made by the Division of Finance.

4. Are we spending more on Higher Education than ever before?
On the Expenditures tab, you’ll find information for a variety of major state expenditures, including Higher Education. In FY 2024, state expenditures on Higher Education were 27% lower than the previous fiscal year.

5. How much does the state have in our Rainy Day fund?
That depends on which Rainy Day fund you’re interested in. The Reserves tab includes both traditional and working rainy day funds. Working Rainy Day funds include things like cash-funded buildings and roads, which could be replaced by borrowing if the state required additional revenue in the event of an economic downturn (in which case, you’d see the impact on the Obligations tab).
The Fiscal Health Dashboard is one product on budget.utah.gov that aims to answer questions about the state’s budget before they are asked. For more information on any of the metrics presented, reach out to your friendly Legislative Fiscal Analyst.