When conjuring a picture of the state’s budget, appropriations (authorized spending) and expenditures (actual spending) jump to the front of mind. However, both appropriations and expenditures hinge on revenues, both forecasted and collected. This flip side of the budget coin provides a unique challenge for policy makers, since revenues in the short term are largely a function of the broader economy and are not controlled by an appropriations bill.
Unfortunately, the Legislature can’t explicitly set a specific level of sales tax dollars collected each year, (that would be great though). Instead, legislative economists rely on signals from both recent collections and economic data to predict the state’s spending capacity for up to 18 months into the future. These signals, called economic indicators, include things like real estate permits, population, commodity prices and more. This practice of evaluating data and forecasting available revenue is what comprises the consensus revenue process. The semi-annual activity includes economists from the Tax Commission, Governor’s Office of Planning and Budget (GOPB), and the Office of the Legislative Fiscal Analyst (LFA). Revenue figures for the current and upcoming fiscal years are approved in December before the General Session, and updated in February ahead of final budget decisions. In the spring and fall, the range of expected revenues is again updated based on the latest available information.
Down to the Day
Outside of these forecasting windows the primary focus is tracking and monitoring revenues rather than predicting them. The key question the LFA seeks to answer during this time is “are current collections in line with the latest expectations?”
This monitoring role has typically been addressed via the monthly TC-23 report from the Tax Commission along with a companion report, the Revenue Snapshot, produced jointly with GOPB. The snapshot, which adds on major non-tax revenue sources in addition to those found in the TC-23, focuses on providing commentary and additional context to the collections data. In pursuit of helping decision makers evaluate current collections, LFA has been developing new analytical tools to improve monitoring up-to-date revenue collections.
While monthly data is certainly more timely than annual data, the economy is in a continuous state of flux; even monthly reporting of that process loses much of the resolution and nuances necessary to contextualize collections as they flow in. Identifying trends — and more importantly, deviations from trends — as they happen, is vitally important to evaluating collections against year-end revenue targets.
Getting a Clearer Picture
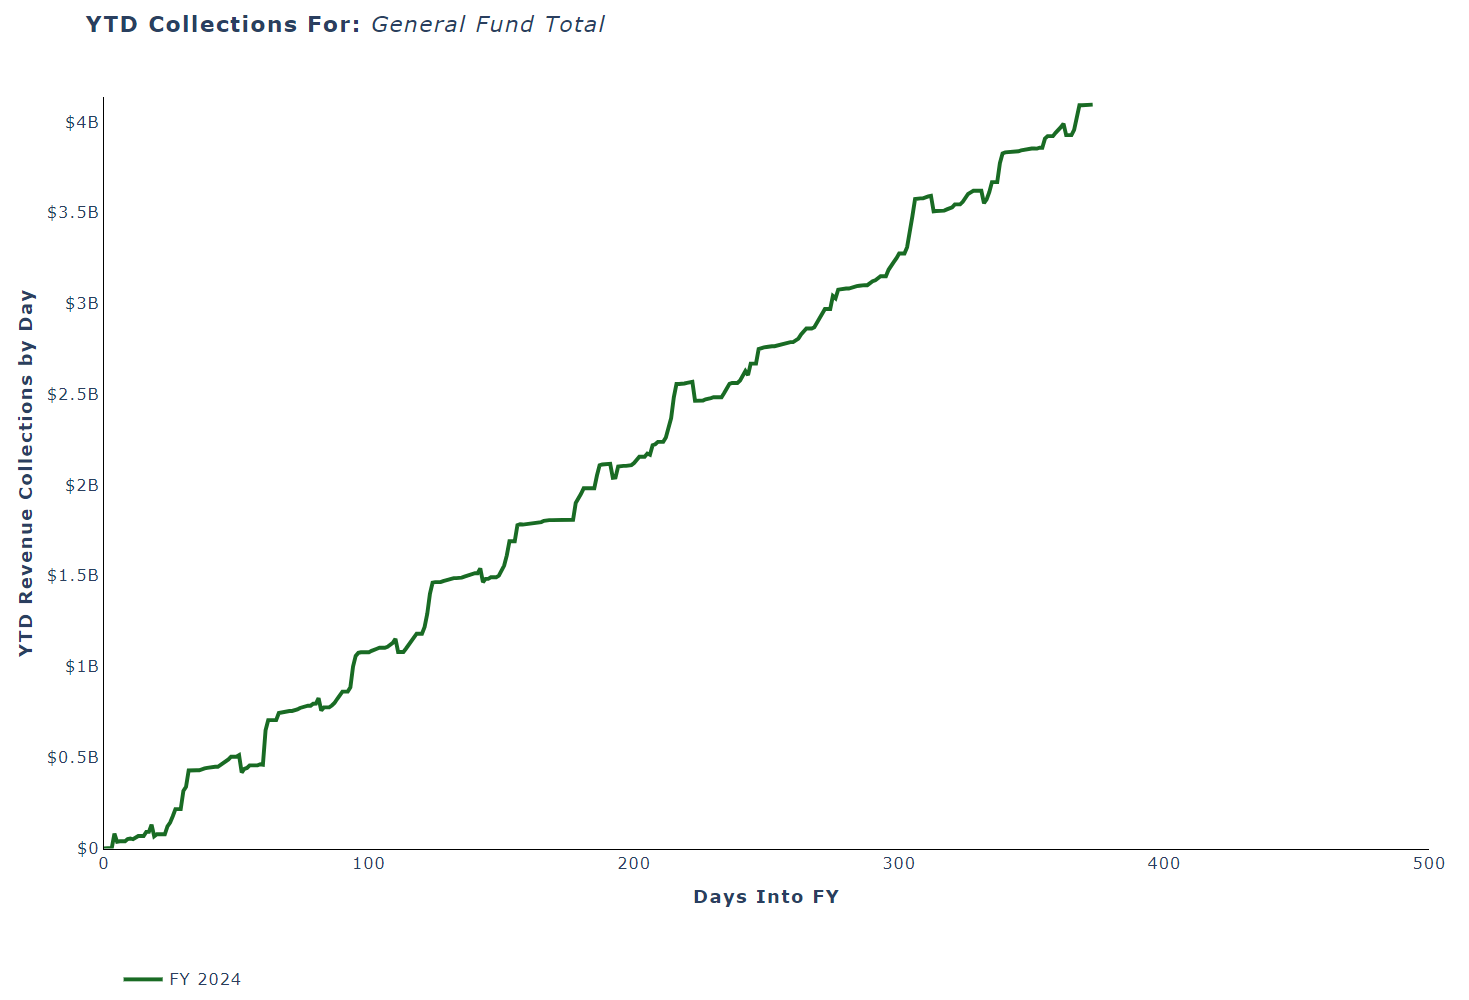
To better accomplish this task, LFA has begun utilizing daily data via the state accounting system database. By charting each day, economists can see state revenue collections in new ways, and more clearly than before. An example of this increased granularity, featuring total unrestricted General Fund revenue for fiscal year 2024, can be seen below:

Starting from “Day 0” for any given fiscal year (July 1st), total year-to-date collections for the state’s major revenue sources can be tracked in near real-time as the year progresses. Because many revenue sources are subject to year-end transfers and accounting close-out activities, these charts extend beyond 365 days to fully capture the entire fiscal year’s data.
For better context around the current year collections, previous data is compared. This is shown below, for total General Fund collections in the past 10 years:

It’s clear that the amount of revenue collections has grown over the last decade, particularly since FY 2020: federal pandemic aid along with a shift in consumer spending towards goods (away from services) served to boost sales tax collections, which make up the majority of General Fund revenue.
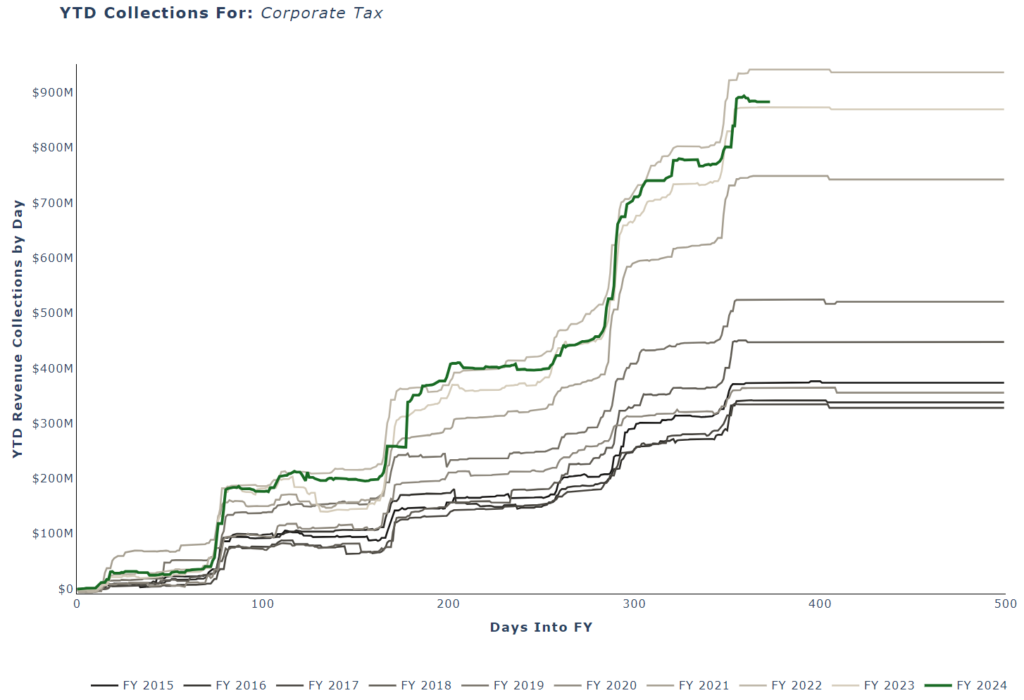
You may also notice that throughout any single year there are fairly consistent, repeating patterns that appear as the periodic “bumps”, in this case with monthly frequency. These are primarily the result of the monthly remittance of sales tax to the state. However, as can be seen below in Corporate Income Tax, revenue sources behave differently:

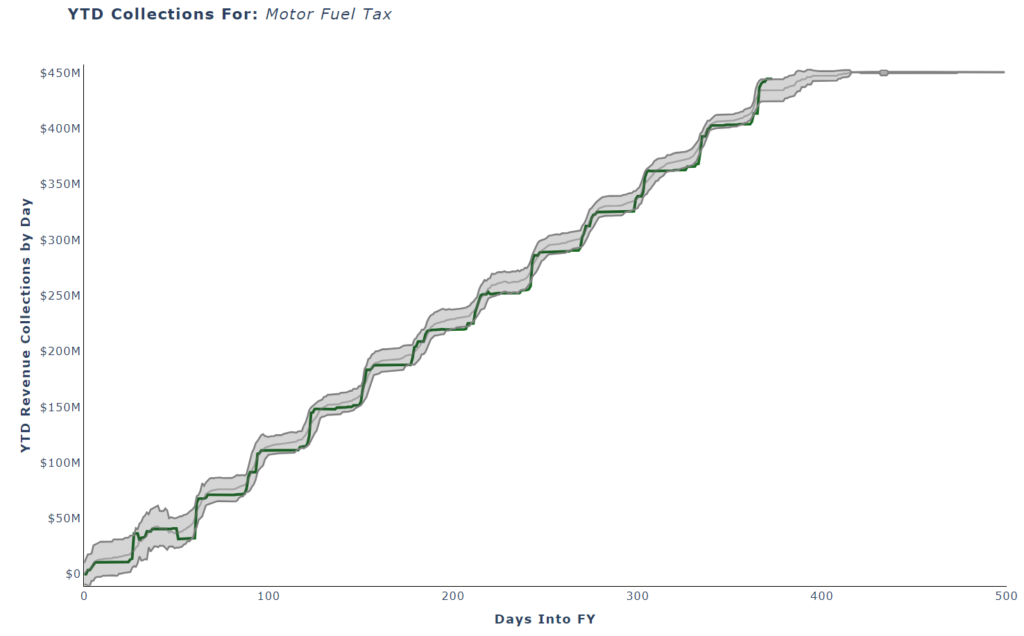
Corporate Income Tax is subject to quarterly estimated payments, hence jumps occurring roughly every 90 days rather than monthly with sales tax. These differing paths for each individual revenue source throughout the year are not just conceptually informative-– economists can utilize these patterns to bridge the gap between existing yearend revenue targets and the current year-to-date actual collections to derive an estimate of where collections “should be” at any point of the fiscal year. To illustrate, the graph below features Motor Fuel Tax collections:

By comparing where collections “should be” and actuals, economists are improving their interpretations of the state’s fiscal situation. In the graph above, the middle grey line is the average “path” collections would be expected to follow based on historical data, if the yearend consensus target is to be realized. Each revenue source has an accepted degree of variability in its collection path. From this, economists derive a reasonable range of estimates above and below a daily mean, which is reflected as the shaded grey area in the graph.
With these tools in hand, the state’s ability to monitor and evaluate revenue collections as they happen is significantly improved. While these analyses still cannot explain why a particular revenue source may be higher or lower than expected, they can help identify deviations earlier in the budget cycle, providing a clearer signal for where collections are likely heading. In concert with actively monitoring economic indicators, this daily system for tracking revenue collections provides Legislators with a more timely and complete picture for the most mysterious part of the budget equation.