AboutLFAlfastaff
Roles and Assignments
View the LFA's current staff of financial experts, economists, and operations analysts here. You can search by name, subject area, subcommittee, or product. You can also view and organization chart to see the full staff in one place.
Contact
Office of the Legislative Fiscal Analyst
North Capitol Building, Suite N305
450 N. State Street
Salt Lake City, UT 84114
Ph: (801) 538-1034
AboutLFAofficeoverview
Mission and Vision
The Office of the Legislative Fiscal Analyst finds sound financial solutions that make Utah better.
History
The Office of the Legislative Fiscal Analyst was formally established in 1965. Utah has had three Legislative Fiscal Analysts since then, and the office's mission has grown to include budgeting, fiscal health, and performance accountability. Read the full history, here.
AboutLFAproducts
Publications Archive
View all LFA reports, briefs, and publications here. These reports can be filtered by year, type, and committee.
Budgetingappropriations
Budget of the State of Utah
This comprehensive report provides a snapshot of legislative budget actions and the state's financial condition. Statute requires the Legislative Fiscal Analyst to complete the report annually.
Utah Budget Quick Facts Card
This pocket-sided summary provides a snapshot of legislative budget actions during the most recent general session (occasionally, this is updated during significant special sessions).
Appropriations Bills
These pieces of legislation, typically the first ten House and Senate bill numbers in each session, officially authorize expenditure of taxpayer resources. These acts include: base budget bills, compensation bills, agencies fees and internal service fund rate bills, supplemental appropriations, and the "bill of bills".
Requests for Appropriations by Legislator
A legislator wishing to obtain funding for a project, program, or entity, without enacting an associated statutory change, may file a request for appropriation with the Office of the Legislative Fiscal Analyst. Each request is reviewed by the LFA and considered by a subcommittee during the annual general session. This report shows Requests for Appropriation (or RFAs) summarized according to the legislator who requested the funding.
Interactive Budget Visualization
This interactive tool shows Utah's budget by line item. It contains budget data for multiple sessions in a visually consumable format and offers keyword searches.
Budget Slideshow
This file provides a high-level summary of the latest state budget, ideal for Legislator adaptation and use at town hall meetings, conferences, or other speaking engagements.
Fund Balances
The Legislature creates restricted accounts within its major funds for various statewide purposes. Agencies also request authorization to retain unspent amounts, carrying a balance between fiscal years. The reports below detail the yearend balances for restricted accounts within state funds as well as nonlapsing amounts in operating and capital line items.
Budgetingsubcommittees
Budget Priority Lists
These documents rank order budget changes according to the affirmed priorities of an appropriations subcommittee. The Executive Appropriations Committee and various caucuses use the lists to compile a unified balanced budget. (JR3-2-402)
Compendium of Budget Information (COBI)
This online resource details Utah's budget and related financial authorizations. It contains summaries of issues faced by legislators, performance measures, background information (including references to statutory authority), and financial history. It is provided as a companion to appropriations bills considered by the Utah State Legislature.
Appropriations Committees
These links direct to all meetings and actions of the Executive Appropriations Committee and topical appropriations subcommittees. Meeting materials include agendas, minutes, audio/video recordings, reports, and presentations.
Fiscal Notes and Regulatory Impact Analyses
A fiscal note estimates the direct and measurable costs, savings, revenue gains, or revenue losses associated with implementing a piece of legislation. Fiscal notes are required for every piece of legislation and show impacts for state agencies, local governments, individuals, and businesses. A fiscal note is not a price tag, a cost/benefit analysis, or a funding trigger. Fiscal Notes are not intended to influence the passage of a bill. Regulatory Impact analyses are included on fiscal notes and indicate whether a proposed bill will change regulatory burden for Utah residents and businesses, and if so, whether a bill increases or decreases the burden and whether the change in burden is high, medium, or low.
Standard fiscal notes estimate three years of impact and assume no behavior change. Dynamic fiscal notes project for more than three years and provide four hypothetical scenarios for what might happen in the economy if individuals and businesses change their behavior as the result of a bill. Dynamic fiscal notes are done by legislator request only.
Prior to each General Session, the Legislative Fiscal Analyst trains stakeholders who provide input for Fiscal Notes and regulatory impact analyses. The training covers requirements for each type of note, information on the latest changes to those requirements, and a thorough review of the interactive software program used to submit input. (UCA 36-12-13(2); JR4-2-403)
Economylongtermfiscalhealth
Revenue Volatility Report
This triennial report measures the experienced variability of state tax and fee collections, as required under UCA 36-12-13(2)(e). Policymakers may use the magnitude of that variability to determine appropriate reserve ratios.
Long Term Budget
This triennial report required under UCA 36-12-13(2)(e) looks at a five-year window for revenues and expenditures, accounting for known policy changes for programs appropriated from major funds and tax types.
Stress Testing
These simulations provide insight into the impact an economic downturn might have on state revenue and expenditures, which can then provide information to legislators, and others, about how much the state should set aside in reserves to endure a downturn. These analyses are required every three years under UCA 36-12-13(2)(e).
Fiscal Health Dashboard
This online resource shows the latest condition of fiscal measures like revenue and spending, but also covers greater measures of financial health like extent of long-term obligations, status of reserves, and performance of economic indicators against assumptions.
Economyrevenueandtaxation
Revenue Collections and Estimates
These estimates of future tax collections establish a target for budgeting, as required by UCA 36-12-13(2)(a). Forecasts are developed in consensus with private sector consultants, the Governor's Office of Planning and Budget, and the Utah State Tax Commission. Point forecasts are made in December and February, with ranges updated in June and October. Estimates are also used to draft the monthly Revenue Snapshots. These snapshots provide regular updates on the state's revenue collections, note whether collections are above or below target, and provide the macroeconomic context through which to interpret collections.
Taxpayer Receipt
This online interactive tool allows a taxpayer to view an estimate of how the taxpayer's tax dollars are spent for state government purposes.
Property Tax Application
Vesta is an interactive web application developed by the Office of the Legislative Fiscal Analyst and designed to provide insight into the Utah state property tax system. Using data from the Tax Commission, the application allows users to compare taxing entities and property tax types.
Featured
Long-term Vision: Looking Out at Our Future
Utah legislators have long known the benefits of forward thinking. After the "Dot-com" bust of the early 2000s, they developed tools like temporal balance and the working rainy-day fund to assure the state could weather the next recession. They were the first in the nation to implement evidence-based rainy-day policy in 2008. In the 2018 General Session, they took yet another step toward improved long-term fiscal health.
Follow-up Report: Time to Revisit Budgets of the Past
Each summer, the Legislative Fiscal Analyst looks-back at prior year appropriation items and fiscal notes to determine accuracy of budget, schedule, and performance. This year, Clare Tobin Lence presented the Fiscal Note and Budget Item Follow-up Report in Executive Appropriations' July meeting. She and her colleagues highlighted a number of follow-up items in the meeting, but all those of consequence are included in the report itself. This year's review covered 232 budget items and fiscal notes from four past General Sessions. Of those, 84 (36%) were included in the body of the report, indicating that they require consideration by the Legislature. The Executive Appropriations Committee referred the report to appropriations subcommittees for further action. The entire 104 page report can be found here: https://le.utah.gov/interim/2018/pdf/00002986.pdf
A Tally of Utah's $252 Million Revenue Surplus by Source
Fiscal Year 2018 is over. And it ended with a bang. The State closed the fiscal year with a $252 million revenue surplus. Of the $252 million, $210 million stemmed from better-than-expected Education Fund performance and $42 million came from the General Fund.
The Transportation Fund ended FY 2018 in a revenue deficit at -$9 million. This was drive largely gasoline tax (-$4 million) and diesel tax (-$8 million). All other sources to the Transportation Fund ended the year +$3 million above target.Behind the surplus was stronger than expected income tax revenue (+$108 million), corporate tax revenue (+$100 million), sales tax ($+29 million), and other General Fund revenue (+$13 million). Click on these interactive graphics to further explore components of the revenue surplus.
A portion of the revenue surplus will be deposited into reserve funds and other accounts. Those deposits, combined with performance on the spending side, will determine the State's final budget surplus and amount of revenue available to policymakers in the 2019 General Session.Legislative Staff Offices Receive Valued Recognition
Utah's legislative staff offices are honored to receive the 2018 Ethical Leadership Award for Government from the Daniels Fund and Daniels Fund Ethics Initiative at the University of Utah's Eccles School of Business. Each year the award goes to businesses, nonprofits and government agencies that demonstrate the highest ethical standards and practices in the state of Utah. The award is especially meaningful not only because it recognizes what we strive for each and every day, but also because the staff offices received it jointly.
 Read more about the Daniels Fund Ethics Initiative here:
https://danielsfundethicsinitiative.business.utah.edu/community/utah-ethical-leadership-awards/
Read more about the Daniels Fund Ethics Initiative here:
https://danielsfundethicsinitiative.business.utah.edu/community/utah-ethical-leadership-awards/
State Closes Fiscal 2018 with $158 Million Budget Surplus
On October 16, the Legislative Fiscal Analyst’s Office reported to members of the Executive Appropriations Committee that Utah closed fiscal year 2018 with a budget surplus of nearly $158 million ($8 m GF/$150 m EF). For purposes of comparison, at the same time the prior year, fiscal year 2017 ended with a $27 million surplus. This is certainly good news in that it means Utah’s economy expanded beyond expectations in FY 2018. At the same time, the size of this surplus suggests that it is not sustainable in the long-run. Using this one-time money wisely will avoid making promises that cannot be kept.
To that end, Utah also made significant deposits into reserve accounts at the end of FY 2018. An additional $6 million went into the general rainy-day fund, $65 million into the education rainy day-fund, and $30 million into the Medicaid rainy-day fund. The State deposited $1 million into the Disaster Recovery Account and $4 million into the Wildland Fire Suppression fund. These amounts are on top of the $95 million that legislators appropriated to reserves last General Session ($73 m General RDF/$12 m Education RDF/$10 m Student Growth Account).
 You can find further information on the surplus and reserve fund balances on the Division of Finance's Financial Highlights document and on the Legislature's Fiscal Health Dashboard. These numbers are preliminary and subject to change as the state completes its annual audit of financial statements.
Fourth Month Revenue Slows Down a Bit, Still Strong
The Utah State Tax Commission released its TC-23 revenue report for the first four months of FY 2019 today. The report, as interpreted on our monthly revenue snapshot, shows that growth slowed from the third to the fourth month, from 13.8% to 11.2%. The current growth rate puts our estimated collections range above the projected totals for the year. Combined General and Education Fund revenue grew by 11.2% in the first four months, compared with expected growth of 5.7%. If one adjusts the starting point for Utah's $252 million FY 2018 revenue surplus, tax collections would need grow by only 1.9% for the year in order to meet expectations.
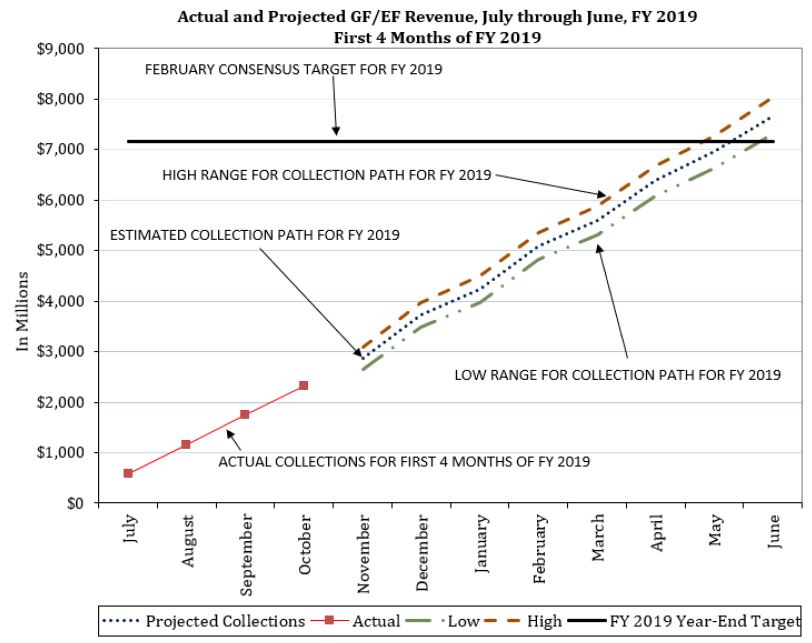 Growth to date is most pronounced in the Education Fund, where first quarter collections approached an 12.9% year-over-year growth rate. Much of this came in corporate income taxes. We believe much of that growth is associated with federal tax reform. Such a growth rate is not sustainable in the long-term.
Gas and other fuel taxes met expectations at $202 million through the first four quarters.
For more, read our monthly revenue snapshot, here.
Growth to date is most pronounced in the Education Fund, where first quarter collections approached an 12.9% year-over-year growth rate. Much of this came in corporate income taxes. We believe much of that growth is associated with federal tax reform. Such a growth rate is not sustainable in the long-term.
Gas and other fuel taxes met expectations at $202 million through the first four quarters.
For more, read our monthly revenue snapshot, here.
State Revenue Remains Strong but Caution Encouraged
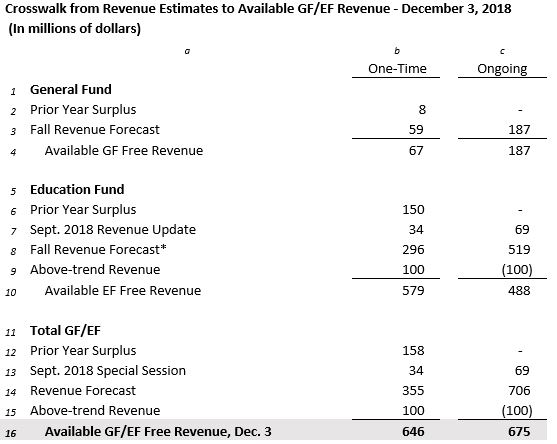
The Executive Appropriations Committee adopted revised revenue estimates for FY 2019 and new estimates for FY 2020. When combined with the year-end surplus from FY 2018 and after adjusting for above trend revenue, available revenue is expected to be $646 million one-time and $675 million ongoing. Details on available revenue can be found online.
 Economic Indicators remain strong. Both General Fund and Education Fund exhibit strong growth largely due to income tax and retail sales tax collections. The current growth rates for Education Fund at 12.9% and General Fund at 7.1% are not historically sustainable. Wage growth is currently estimated at 5.6% and taxable sales are estimated at 6.0% growth and as the largest contributors to the funds above are well below current collections.
As a state, the last time we saw collection rates this high was during the 2006-2007 business cycle. If the current expansion lasts another six months we will be in the longest expansion in the modern era. Let's not forget, all good things come to an end.
Economic Indicators remain strong. Both General Fund and Education Fund exhibit strong growth largely due to income tax and retail sales tax collections. The current growth rates for Education Fund at 12.9% and General Fund at 7.1% are not historically sustainable. Wage growth is currently estimated at 5.6% and taxable sales are estimated at 6.0% growth and as the largest contributors to the funds above are well below current collections.
As a state, the last time we saw collection rates this high was during the 2006-2007 business cycle. If the current expansion lasts another six months we will be in the longest expansion in the modern era. Let's not forget, all good things come to an end.
Revenue Growth Slows a Bit Through Five Months
Every month the Tax Commission releases a monthly revenue snapshot. This gives us a chance to compare what’s actually happening this the projected figures. This past month’s report showed revenue growth slowing slightly to 11.1%. In October revenue growth was 13.8%. In November it was 11.2%.


Overall, revenue is moving closer towards the current target of 7.4%. Behind the continued strong growth is strong withholding (9.1%), sales tax (6.7%), and corporate tax (143.7%). Federal tax reform is partially responsible for the strong corporate receipts.

For more, read our monthly revenue snapshot, here.
A Sharp Drop in Gross Paids Headlines the Revenue Picture through 6 Months of 2019
The Tax Commission released their 6th month TC-23 on January 22nd. We are halfway through the fiscal year. Through the first 6 months, the state has collected about 45% of the current revenue collection forecast. Typically, at this point in the year, the state would have collected between 46% and 51% to reach target.
The biggest surprise was the abnormally large difference between last year’s income tax payments and this year’s payments. With income tax withholding (10.7%) and corporate tax (64%) above target, and sales tax collections on target (5.9%), the big question is whether April’s income tax payments will be abnormally large because of federal tax reform.
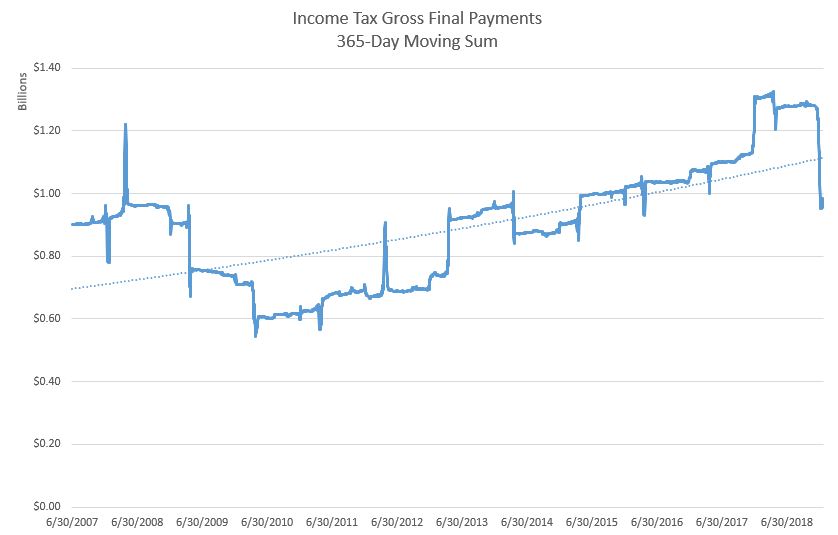
Source: LFA analysis of the 365-day moving average of income tax gross final payments
Overall, General Fund and Education Fund collections reached $3.4 billion through the first 6 months, representing a year-over-year decline of 0.3%. The target is $7.6 billion. A snapshot of the collections is in Figure 2. The figure also reports on the top right where revenue growth has been over the past 4 months.

Source: TC-23 Revenue Snapshot
More details of the revenue picture through 6 months is available here.
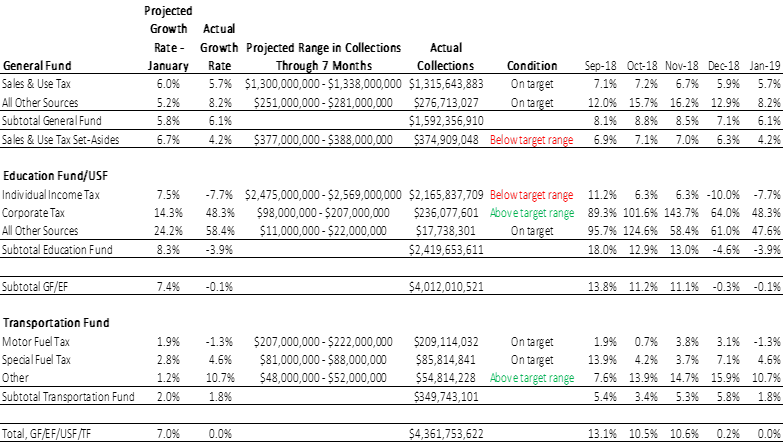
Income Tax Revenue Below Target Range
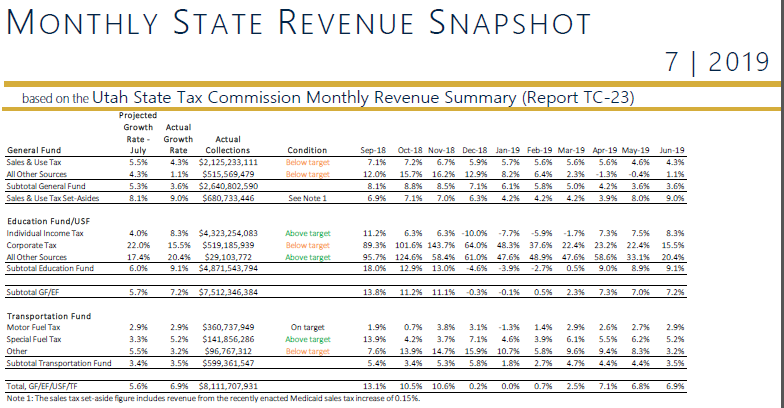
The Tax Commission’s TC-23 was released earlier today. The report, which captures a snapshot of revenue collections through the first 7 months of fiscal year 2019, shows that revenues from most sources are on target or above target.
That’s not the case, though, for the largest revenue source – income tax. Income tax is down 7.7% year-to-date. What’s causing this? Gross final payments and refunds.
Although income tax withholding, the largest component source of income tax revenue, is strong at 8.2% year-over-year, individuals filing earlier than the April 15th deadline are seeing higher refunds, while gross payments are down 52% year-over-year.
The increased refunds (+33% YoY) and the decreased gross payments (-52%) appears to stem, at least partially, from the incentives created by federal tax reform. Individual filers that benefited from the doubling of the standard deduction may have filed earlier this year, while filers that saw a tax liability increase may be waiting to make their final payment until April. A snapshot of the revenue picture follows.
For more, read our monthly revenue snapshot, here
Slight Improvement in Revenue Growth through February
The Tax Commission released their monthly revenue report (TC-23) earlier today. Through the first 8 months of FY 2019, according to the report, the revenue sources within the General Fund are on Target.
Income Tax Withholding is still below Target range at -5.9%. However, the rate is an indication of increased funding compared to December 2018 (-10.0%) and January 2019 (-7.7%). As Income Tax Withholding continues to reach the Target range, overall Education fund collections have inched closer to the target range as well, going from -3.9% in January 2019 to -2.7% in February 2019.
Year-over-Year (YOY) growth in the General and Education Fund revenue collections is at 0.5%. This is the first positive YOY growth rate in the General and Education Fund revenue since November 2018.
A snapshot of the collections is shown in the figure below:
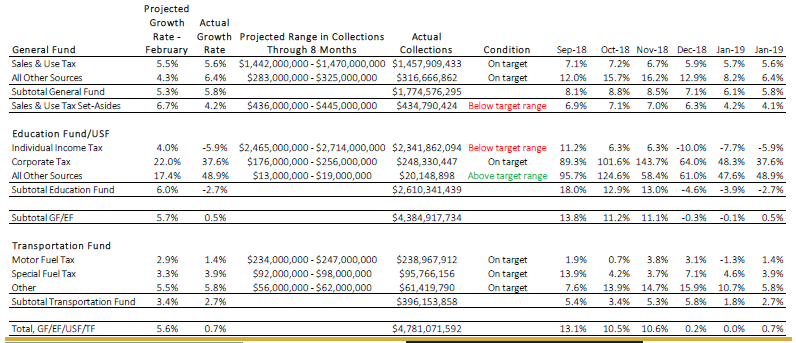
More details of the revenue picture through 8 months is available here.
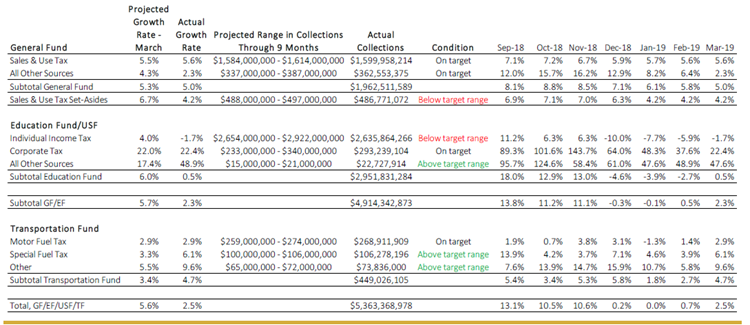
Revenue Collections Still Below Target Despite Growth in March
The Tax Commission’s TC-23 report, which captures a snapshot of revenue collections through the first 9 months of fiscal year 2019, shows that Income Tax Withholding is still below Target range at -1.7%.
Throughout the year, this funding has been volatile as year-over year (YOY) revenue has gone from a growth rate of 11.2% in November 2018, followed by a negative growth rate in December 2018 (-10%). April’s report, which will be published during the third week of May, should provide a reasonable projection for Income Tax revenue by the end of the year.
In addition to Income Tax revenue, sources within the General Fund are on target. There has been little fluctuation in the General Fund rates throughout the year as revenue collections have remained consistent.
Overall, YOY growth in the General and Education Fund revenue collections is at 2.3%. This is an increase in funding compared to last month’s report (0.5%).
A snapshot of the collections is shown in the figure below:
More details of the revenue picture through 9 months is available here.
Strong Final Payments Highlight April
Earlier this week, the Tax Commission released the TC-23 report for the month of April. Exceeding the current revenue target of 5.7%, General and Education Fund revenue collections totaled $6.4 billion through the first 10 months of FY 2019, representing a year-over-year (YOY) growth of 7.3%.
The strong surge in April revenue collections were due to final income tax payments within the Education Fund. In December and January, revenue collections were below target range at -4.6% and -3.9%, respectively. This was due in large part to incentives created by federal tax reform, thus yielding lower payments compared to the previous year. With steady growth in the Education Fund during February and March, the YOY growth in the month of April exceeded projected growth rates as strong final income tax payments were made.
While the General Fund is below target, the revenue collections are still within target range at $2.2 billion through the first 10 months of the current fiscal year. Overall, consistent General Fund revenue collections, accompanied by increased growth in the Education Fund, indicate that total revenue collections for FY 19 are on target.
A snapshot of the collections is shown in the figure below:
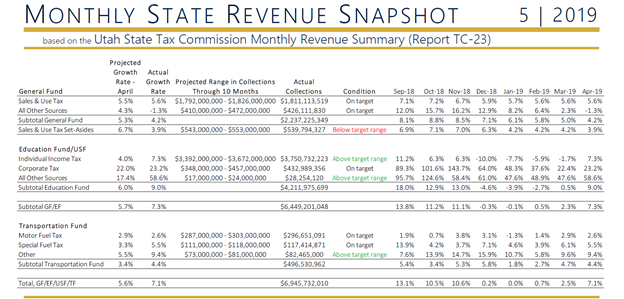
More details of the revenue picture through 10 months is available here
Local Governments Address Long-Term Fiscal Stability Amid Population Growth
Utah’s population grew nearly 15% this decade, ranking No. 1 in the nation.1 By 2060, Utah’s population is projected to nearly double. The dramatic growth is a cause for concern for local governments across the state as communities address the fiscal challenges and quality of life for existing residents.
The Utah Foundation recently published the report, Building a Better Beehive: Land Use Decision Making, Fiscal Sustainability and Quality of Life in Utah, which explores these challenges. The report highlights five strategic categories to overcome the challenges of growth in our state:
- Promoting efficient land use.
- Expanding transportation options.
- Preserving green spaces and natural assets.
- Preserving and improving community character.
- Avoiding undue taxpayer subsidy of new growth.
Promoting Efficient Land Use: While density is often a matter of concern for existing residents, local governments can use density to their advantage to increase local tax revenue while providing opportunities for both new and existing residents and businesses within the community. With a greater emphasis on mixed-use developments, local governments throughout Utah can create urban communities that are appealing and safe while reaping a stronger tax revenue return per square foot.
Expanding Transportation Options: According to a Utah Foundation survey, nearly 76% of local governments noted that the need to increase road capacity was one of the greatest impediments to growth. As Utah’s population continues to grow, roads across the state are increasingly prone to traffic. To combat traffic congestion along the Wasatch Front, the report suggests that state and local government agencies work together to utilize transit-oriented developments that improve accessibility to public transit while developing mixed-use communities that promote quality of life through pedestrian transportation options, including bike paths, sidewalks, and trails.
Preserving Green Spaces and Natural Assets: Utahns are committed to preserving the natural surroundings of the state. Outdoor recreation is essential to the quality of life experienced by Utah’s citizens. Through efficient urban planning, cities along the Wasatch Front can accommodate the growing population while easing pressure on both recreational and agricultural lands. Maximizing space within denser areas can lead to local governments developing “green spaces” to increase the quality of life for urban residents while bolstering nearby property values, thus increasing tax revenue.
Preserving and Improving Community Character: To preserve and improve community character, local governments are encouraged to help citizens and businesses collaborate to ensure that planning efforts offer attractive neighborhoods and community gathering places. By undertaking projects, such as revitalizing historical sites, constructing efficient public parking, and designing an aesthetically appealing landscape, communities can increase the quality of life while tackling the fiscal challenges of population growth.
Avoiding Undue Taxpayer Subsidy of New Growth: As commercial developments grow in communities throughout the state, local governments are faced with fiscal challenges regarding the costs of services and infrastructure for new developments. Local governments must find a balanced approach to utilize impact fees to ensure that current residents do not subsidize new developments. It is important that local governments evaluate impact fees regularly to ensure a strong tax base while welcoming commercial developments that enhance the community.
Addressing the challenges of Utah’s growing population will be a significant priority for policymakers in the foreseeable future. Local governments will need to promote efficient land use by emphasizing mixed-use developments to meet the needs of citizens, businesses, and communities in our state. Transportation demands can be satisfied by improving existing infrastructure and expanding transportation options in our communities. As Utah’s population continues to grow at a high rate in the next 40 years, local governments will continue to work with community leaders to meet the growing demands of the state while preserving the quality of life.
The full report can be found here
- Davidson, L. (2018, December 20). Utah ranks No. 1 for population growth this decade - adds nearly 400K new residents. Retrieved June 11, 2019, from https://www.sltrib.com/news/politics/2018/12/19/utah-ranks-no-population/
Strong Income Tax Lifts State Revenue Collections Despite Declining Growth Rates
Combined General and Education Fund revenue collections for the current fiscal year (2019) totaled $6.9 billion through the first eleven months. That represents year-over-year growth of 7.0%, exceeding the current revenue target of 5.7%. This despite a slight decrease in the growth rate compared to April.
Collections for the General Fund, however, fall short of the 5.3% point target used in budgeting. For the first eleven months of fiscal year 2019, General Fund revenue has grown only 3.6%. While collections are still within striking distance of the May target, for the seventh consecutive month the General Fund’s year-over-year growth rate has declined. Overall, since reaching 8.8% in October 2018, the growth rate has decreased 5.2%.
Due to another strong year in the Education Fund, though, combined General and Education Fund revenue is above target. Education Fund collections currently reflect an 8.9% growth rate compared with the year-end target of 6.0% year-over-year growth.
A snapshot of the collections is shown in the figure below:
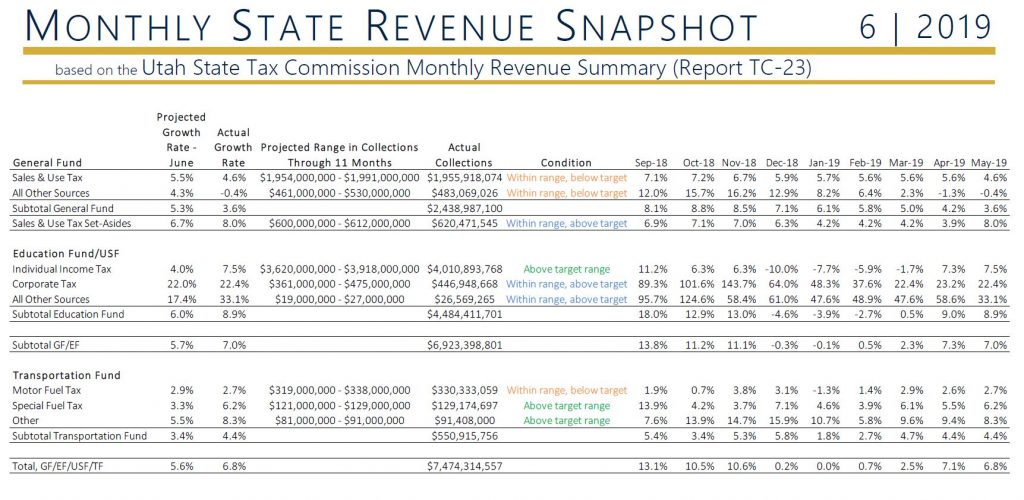
More details of the revenue picture through eleven months of fiscal year 2019 is available here
Strong Income Taxes Bail-out Sales Tax Through 12 Months of FY19
Despite a probable deficit in the General Fund, the Utah State Tax Commission's latest report on revenue collections for twelve months of fiscal year 2019 suggests that Utah may have a combined General and Education fund revenue surplus of nearly $100 million at year-end. While collections to the sales-tax backed General Fund lag estimates by more than $40 million, strong income tax collections have boosted the Education Fund to nearly $140 million above projections. Revenue to the General and Education Funds combined totaled $7.5 billion through twelve months, and exceeded the consensus revenue target of 5.7% with a year-over-year (YoY) growth rate of 7.2%.
General Fund collections reached a YoY growth rate of 3.6%, pacing behind the consensus target of 5.3%. Preliminary General Fund collections totaled $2.6 billion in FY 2019. The relatively low growth rate in General Fund collections is strongly influenced by the sales tax growth rate of 4.3%, which fell below the consensus target rate of 5.5%. Preliminary measures estimate the General Fund will end the fiscal year in a $43 million revenue deficit.
The 2019 fiscal year featured strong collections in the Education Fund with a projected surplus of $140 million. Behind healthy performances in individual and corporate income taxes, the State’s Education Fund reached a total of $4.9 billion in FY 2019, representing a YoY increase of 9.1%.
These figures will all change as state accountants close-out the books for fiscal year 2019. Final collection amounts and resulting revenue surplus/deficit figures will be released in September.
A snapshot of current collections is shown in the figure below:
More details of the revenue picture through fiscal year 2019 is available here
Revenue Surplus Sets the Stage for Tax Reform
The year-end numbers are in
In Fiscal Year 2019, the revenue surplus to the education fund was $134 million. After adjustments (such as putting money in the rainy-day fund), the available balance is $107 million. The General Fund, supported mostly by the sales tax, ended the year at a deficit of $38 million, which was reduced to a $22 million deficit after adjustments. Adjustments to the General Fund include balances which were left unspent by agencies during the fiscal year. The Transportation Fund, furnished by motor fuel tax, diesel tax, and registration fees, among others, ended the year at $6 million above the target.
For the full summary of Fiscal Year 2019: click here.
A decent start to the new fiscal year
The aggregated total revenue amongst all funds is on track with the unadjusted projection made last February, at a year-over-year (YoY) growth rate of 3.6% (the current target is 3.5%). After the Governor releases his budget proposal in December, revenue targets will be adjusted for the remainder of the year. As a note, revenue collections are typically volatile during the first half of any given fiscal year; because of this, caution should be exercised when interpreting these early-year revenue figures.
Comparable with Fiscal Year 2019, the revenue postings to the General Fund are roughly 2% below the current target, the Education Fund is approximately 1% above first quarter projections, and the Transportation Fund is performing about 3% above target. The growth in the Transportation Fund is being spurred largely by sources other than the Motor Fuel Tax, which showed a negative growth rate of 2% during the first three months of the fiscal year.
For the September report: click here.
Income Tax Continues to Outpace State Sales Tax through Q1
State Revenue Growth Higher than February Projections
In the first quarter of the Fiscal Year, income tax grew 11.3% which represented a $135 million dollar increase over the first quarter of last year. Nominally, state and local sales taxes each grew by similar amounts, at $80 million and $81 million, respectively, over the previous fiscal year. The special fuel tax (which includes diesel) continued to perform well, posting 15.1% year-over-year growth, and furnishing most of the growth to the Transportation Fund. Corporate Taxes are notably behind last year, with a 28.6% reduction representing a $44 million decline in revenues. In terms of percent change, Mining Severance Tax demonstrated the largest growth with a 37% increase, though this only represented a $1.2 million increase in collections over last year. As always, revenue growth rates are highly volatile during the first half of any given fiscal year and caution is advised when drawing conclusions based upon these figures.
Revenue to both the General and Education Funds totaled $2.4 billion through the first four months of the Fiscal Year 2020, representing a year-over-year growth rate of 5.5%. This growth is about 2% higher than the unadjusted consensus revenue target from February. The targets will be updated later this month when the Governor’s budget is released and will also incorporate year-end numbers from Fiscal Year 2019.
For the full November report: click here.
For the full Quarter 1 Revenue Summary report: click here.
Revenue Collections in-line with Latest Estimates
First Half of FY 2020 in the Books
Reports for December and January show both General and Education Fund revenues coming in on-target, with collections for the first half of the year slightly higher than targets adopted in November. December’s numbers showed General Fund sales-tax collections slightly below the estimate, while January’s revenue performance was slightly above. Both months are within expected range projected by staff economists. The income tax-backed Education Fund was higher than point estimates in both months, but still within anticipated ranges. Consistent with longer-term trends, Education Fund growth rates continue to exceed General Fund growth rates, though the difference moderated somewhat in December due to holiday consumption patterns.
The first six months’ General Fund sales tax collections finished at 6.7% growth, 1.6% above the annual growth target of 5.1%. However, because the first six months of the Fiscal Year includes holiday sales, it’s ill-advised to compare the first six months to the entire year. Typically, sales tax growth rates tend to moderate over the course of the year. For example, in the first six months of Fiscal Year 2019, General Fund sales tax grew by 5.9% compared to a final growth rate of 4.8% for the year as a whole. For these reasons, caution should be used when drawing conclusions from the first half of any year’s tax collections. Additionally, volatility was expected this year due to policy implementation, such as that of third-party collection of remote sales.
For the December Revenue Snapshot: click here.
For the Fiscal Year 2020 6-month Revenue Snapshot: click here.
Sales Tax Growth Improving, Not Enough to Close Gap in Education and General Funds
On Thursday (Feb. 20th), the Governor’s Office of Management and Budget and the Legislative Fiscal Analyst released their updated 2020 Consensus Revenue Estimates. These estimates, along with the Tax Commission’s TC-23 Report for revenue collections to date, paint a picture of state financial status to date, along with expectations for the next 16 months. Both reports reflect a disparity in both total revenues to the General and Education Funds, as well as future projected growth rates.
The Tax Commission reports that collections from sales and use tax totaled $1.8 billion during the first seven months of Fiscal Year 2020, which is the largest contribution to the General Fund. Last fiscal year, the General Fund collections totaled $2.6 billion, a whopping $2.2 billion less than Education fund revenues. This discrepancy between funds is expected to grow to $2.5 billion by June of 2021, according to the Consensus Revenue Estimates.
For the current Fiscal Year, the Education Fund is expected to see an increase in ongoing available revenue of $518 million, which represents a $77 million boost over November’s estimate. This is on top of a projected one-time increase to the Education Fund of $323 million, resulting from expectations of strong income tax collections through the end of the fiscal year. GOMB and LFA agree that income taxes will continue to increase through the end of the Fiscal Year, moderating to 6.2% growth in FY 2021.
The reports referenced in this post are available at the following links:
Revenue Snapshot
TC-23 Report
Consensus Revenue Estimates
Revenues Still On-track, but Don’t Yet Reflect Pandemic’s Impact
Through the end of February, revenues from all taxes were on target, representing an increase of $571 million over FY 2019. Sales and use tax grew by 7% over the previous year, and income tax collections were 8.9% higher than February 2019. However, impacts to revenues from COVID-19 related business closures and layoffs are not reflected in these collections due to timing differences in reporting and collections. Some of those dampening effects may be seen in the April TC-23 report, which will report on March activity. However, it will likely be May or June before tax collections will reflect the actual impacts to revenue from recent changes in the economy. In the meantime, weekly unemployment insurance claim reports produced by the Division of Workforce Services provide the closest to real-time indication of economic activity.
It’s worth noting that upon entering this time of economic contraction, Utah was ranked first for economic momentum in both the last quarter of 2019 and first quarter of 2020 according to State Policy Reports. Utah has also incorporated into its normal budgeting process Stress Testing to better understand and prepare for unforeseen downturns in the economy.
The reports referenced in this post are available at the following links:
March TC-23 Report
March Revenue Snapshot
DWS Unemployment Data
Collections Hold Steady as the Legislature Prepares to Weather the Storm
The April TC-23 report released by the Tax Commission reports revenue collections to the General, Education, and Transportation Funds are all on target with consensus projections through the first nine months of the fiscal year. The April report shows collections through March, for sales and wages that occurred in February. For the third month straight, the General Fund posted a 7% growth rate over the previous fiscal year, which may represent strong collections from online sales taxes. The Education Fund showed increased collections of 7.3% over FY 2019, as income taxes remained solid through the third quarter of FY 2020.
Undoubtedly, next month’s report will show a much different picture of revenue collections. State and county directives to stay at home will likely impact the transportation fund, delayed income tax collections will impact the education fund, and closed businesses are expected to result in fewer sales tax collections than were projected prior to the pandemic.
The Legislature will enter its first-ever electronically held session on Thursday, April 16th. This particular session is also unique because it was called by the Legislature itself. The special session will address federal stimulus packages and budgetary actions to cope with expected revenue shortfalls to the state’s tax collections. While the full extent of revenue changes will be measured in the coming months, projections from Legislative and Executive Branch economists are assisting the legislature in taking action to help Utah get back on track.
The reports referenced in this post are available at the following links:
April Revenue Snapshot
TC-23 Report (Period 9, FY 2020)
Income and Fuel Taxes Begin to Show Pandemic Effects
On Tuesday, May 12th, the Tax Commission released their TC-23 Revenue Summary Report for the month of May. Readers may recall that the April TC-23 report was summarizing collections made in March, for sales and wages which took place in February. Because of the lag between collections and reporting, this month’s Revenue Summary is the first look at measuring the impacts of the pandemic on tax revenues; including changes in travel, income, and sales which occurred in March.
Revenue sources to the General Fund were the least impacted by the pandemic during the reporting period. Sales and Use Taxes were up 6.7% over the previous Fiscal Year, exceeding the February consensus target of 6.2%. Through the first 10 months of FY 2020, the General Fund reached $2.4 billion in collections. Online sales tax revenues have likely helped the General Fund collections during the state’s required business closures. We expect this source will begin to show signs of COVID related softness next month.
The Education Fund targets in this report are adjusted to reflect the delay of income tax filing deadlines from April 15th (during Fiscal Year 2020) to July 15th (Fiscal Year 2021). After timing adjustments were made to revenue targets, actual Education Fund collections were 2.8% lower than the February consensus target. Income tax collections were 14.4% below the previous Fiscal Year, as a raw comparison ignoring changes to the normal tax cycle.
Combined, General and Education Fund collections in April are 7.1% below prior year collections and 1.7% below the target adjusted for delayed filing of income taxes. Transportation Fund revenues were below the consensus target from February, but remained 1.2% higher than FY 2019. Perhaps not surprising, Aviation Fuel tax was down -6.5% from the previous fiscal year. Consensus revenue targets will be updated in early June to capture new projections for the Utah economy resulting from the pandemic.
The reports referenced in this post are available at the following links:
May Revenue Snapshot
TC-23 Report (Period 10, FY 2020)
Pandemic Impacts Take Shape as Fiscal Year Comes to a Close
The Utah Tax Commission released its TC-23 Revenue Summary Wednesday, June 17th, 2020, detailing the actual collections through 11 months of Fiscal Year 2020. As expected, individual income taxes are down, partially due to the shift in timing of income tax collections from FY 2020 to FY 2021, as well as the effects of COVID-19. While consumption patterns may have changed, sales and use tax revenues actually increased 9.2% over the same collection period in FY 2019.
The State Revenue Snapshot published by the Legislative Fiscal Analyst and the Governor’s Office of Management and Budget compares the revenues reported by the Tax Commission to economic projections upon which state budgets are based. The latest projections include adjusted expectations for income taxes associated with an extended filing date, and an attempt to capture the impact of reduced income tax revenue associated with decreases in employment and wages. The snapshot reports Education Fund revenue sources down (12.6%), which exceeds the consensus projections by (1.1%). Revenue sources to both the General and Education Funds are down (6.5%), representing a (1.0%) greater decline than was forecasted. Defying expectations, the Transportation Fund revenue sources actually increased 0.1% over the previous fiscal year.
The final period of any fiscal year is typically volatile due to final tax payments and year-end adjustments. Revenues reported in this month’s TC-23 report and analyzed in the Revenue Snapshot represent wages and sales which took place in the month of May. The course of the pandemic and associated recession will determine the final, year-end numbers for tax revenues reported next month. The projections included in the Revenue Snapshot assume limited adverse impacts in the fall associated with the pandemic, and carefully estimate impacts of Federal stimulus money. These projections will be updated as better information is available.
The reports referenced in this post are available at the links below:
June Revenue Snapshot
TC-23 Report (Period 11, FY 2020)
Federal Stimulus Appears to Band-Aid Revenues through close of Fiscal Year 2020
The preliminary TC-23 Revenue Summary Report for twelve months of FY 2020 was released by the Tax Commission Thursday, July 16th, along with the Revenue Snapshot report from the Office of the Legislative Fiscal Analyst (LFA) and the Governor’s Office and Management and Budget (GOMB). The TC-23 is preliminary in that it will be modified in the next few months to include final adjustments made at year-end closing. The targets reflected in the Revenue Snapshot reflect adjusted expectations due to the pandemic as well as delayed income tax collections.
Sales and Use Tax, a primary revenue source to the General Fund, rebounded during the month of June. In contrast to collections from April and May, June represented the largest year-over-year growth for any single period of the fiscal year. This increase may be due to the influences of pent-up demand, federal stimulus actions, and collections of online sales in the wake of reduced foot traffic to stores.
As the Education Fund awaits final income tax collections, preliminary figures paint a slightly more optimistic picture than was originally anticipated due to pandemic-associated reductions in employment. The Education Fund reached $4.4 billion at the time of reporting; this figure is expected to increase as final collections and year-end adjustments are made.
The unprecedented circumstances of COVID-19 are further complicated by the influence of federal stimulus packages, making economic forecasts very challenging. Despite this, Education Fund as well as General Fund collections are within the FY 2020 target range projected in June by LFA and GOMB analysts. Fiscal Year 2021 revenue performance remains extremely uncertain due to the unknowns surrounding the income tax filing delay and future of federal economic stimulus.
The reports referenced in this post are available at the links below:
Year End Revenue Snapshot FY 2020
TC-23 Revenue Summary (Year End, FY 2020)
Revenue Through Q1 Boosted by Online Sales and Federal Stimulus
Federal Stimulus Helps FY 2020 End Better than Expected
Earlier this month, the Tax Commission released the final TC-23 Revenue Summary for Fiscal Year 2020. The revenue decline to the Education Fund was less severe than previously projected in June, dropping 10.1% compared to the projected 11.6% decline. The General Fund ended the year with 7.4% positive growth. During November’s Executive Appropriations Committee, the Division of Finance will announce year-end figures for the both the Education Fund (which include adjustments such as putting money aside in the rainy-day fund) and General Fund (which include adjustments such as unspent appropriated funds). Although the preliminary outlook for revenues to both state funds appears optimistic, the better-than-anticipated outcomes are likely the result of income tax delays and significant federal stimulus actions, the future of which remains largely uncertain. As Fiscal Year 2021 unfolds, staff economists will have a better picture if the budget reductions from earlier this year will be sufficient to balance the budget.
Q1 of FY 2021 Provides Largely Uncertain Outlook
A cursory review of the first quarter revenue summary for Fiscal Year 2021 will indicate that revenues are on target for all state funds, with the General Fund posting a growth rate of 8.3%, and individual income taxes a whopping 83.5%. In reality, sales tax growth rates are skewed in an upward direction because the first quarter of Fiscal Year 2020 did not include online sales tax for marketplace facilitators (such as eBay); these collections went into effect in October of 2019, so the year-over comparison is skewed until second quarter figures come in. Further distortions result from federal stimulus actions, which have buoyed both sales and income taxes. To date, federal intervention has totaled nearly $2.6 billion, or roughly 1.4% of Utah’s Gross State Product (GSP). A final obscurity unique to FY 2021, is provided by the income tax timing delay. Because Income Tax collections were made in July (usually posted in April) there is an artificial spike to the Education Fund from revenues that should have been collected in FY 2020.
As with the first quarter of any fiscal year, revenue collections are typically volatile and because of this, caution should be exercised when interpreting these early-year revenue figures. It should also be noted that tax collections lag economic activity by up to four months depending on type, so Q1 revenues are indicative of sales that took place during the summer.
The reports referenced in this post are available at the links below:
Final Revenue Snapshot FY 2020
TC-23 Revenue Summary (Final, FY 2020)
First Quarter Revenue Snapshot FY 2021
TC-23 Revenue Summary (Q1, FY 2021)
Despite Future Uncertainty, Revenues Continue Upward Growth
On Monday, November 16th, the Tax Commission released the TC-23 revenue summary, along with the GOMB/LFA Revenue Snapshot, detailing collections through the first four months of Fiscal Year 2021. Similar to last month’s report, important caveats exist within the income and sales collection figures, and also year-over-year comparisons. October of 2019 was the first month that the state collected sales tax from marketplace facilitators (such as eBay); the lag between collections and reporting leaves sales tax with a somewhat artificially inflated growth rate, posting a 10.2% increase over the same period last fiscal year. This does provide the state with an idea of the effect of marketplace facilitators, which may have impacted sales tax revenues more than was previously anticipated. Next month’s report will provide a clearer view on year-over-year comparisons.
The Education Fund revenues from income taxes totaled just over $2 billion through November 1st; the growth rate moderated slightly, dropping by 30 percentage points compared to last month. It is expected that the income tax growth rate will continue to temper over the course of the fiscal year, as these figures include income taxes which would have normally been received during the previous fiscal year.
Transportation Fund revenues, having fewer provisos than the other two state funds, are trending positive and are within the expected target range, posting a 4.9% growth rate over last year’s collections.
Current revenues to both the Education and General Fund tell a story of economic activity which took place in previous months, due to the timing delay in collections and reporting. Expectations for both sales and income tax are that the growth rates will normalize to within target ranges. The outlook for federal stimulus and the course of the pandemic will also heavily influence these two state funds.
The reports referenced in this post are available at the links below:
November Revenue Snapshot FY 2021
TC-23 Revenue Summary (Period 4, FY 2021)
Rollercoaster Year Ends on a Positive Note for Revenue Collections
On December 16th, the Tax Commission released the TC-23 revenue summary detailing the first five months of collections to state funds. The Education Fund remains a bit enigmatic, due to inflating factors (including federal stimulus and the income tax timing delay) which leave current year income tax collections trending off the charts. The General Fund posted a 4.9% growth rate from all sources, with this month marking the first period that the impacts of online marketplace facilitators can be compared between FY 2020 and FY 2021. Preliminary numbers from the Tax Commission indicate that marketplace facilitators brought in around $3.8 million more revenue to the state in October 2020 than in October 2019. The additional sales tax dollars from marketplace facilitators brought in an estimated $65.6 million during all of FY 2020, and to date have generated an estimated $47.8 million in FY 2021.
As expected, sales tax growth through the end of November moderated slightly from the previous reporting period, posting 9.6% growth over FY 2020 as compared to 10.2% last month. Other revenue sources to the General Fund are down, including severance taxes from mining and oil and gas, which posted a combined $10.9 million decrease in revenue compared to this time last year.
Income tax revenue collections to date are $885.3 million higher than last December, spurred mostly by the timing delay in income tax payments which postponed an estimated $785 million to the current fiscal year. Despite much uncertainty in how income taxes will continue to perform for the duration of the fiscal year, it appears that growth rates remain positive to the Education Fund. Estimates from Legislative, Governor's Office, and Utah Tax Commission economists indicate that underlying the obscurity provided by the income tax delay is a 1.5% year-over-year (YoY) growth in revenue to all sources in FY 2021, and 6.5% YoY growth into FY 2022.
While the future of federal aid remains undecided, legislative economists estimate that previous pandemic stimulus packages have translated to $330 million in income tax revenue and $120 million in sales tax revenue in Utah. In the upcoming General Session, this combined roughly $450 million will be considered one-time revenue for budgeting purposes. Consensus revenue estimates released at the December Executive Appropriations Committee are contingent on several factors, including future federal aid and vaccine outcomes.
The reports referenced in this post are available at the links below:
December Revenue Snapshot FY 2021
TC-23 Revenue Summary (Period 5, FY 2021)
Revenue Forecasts Improve, though Uncertainty Lingers
On February 19th, the Governor’s Office of Management and Budget (GOMB), Utah Tax Commission, and the Legislative Fiscal Analyst (LFA) released their updated Consensus Revenue Estimates for available one-time and ongoing state fund revenues. These updated estimates from the December 2020 forecasts paint somewhat optimistic expectations for the next 16 months; with FY 2021 revenues finishing stronger than previously anticipated, followed by more moderate revenues in FY 2022 under the expectation of exhausted federal stimulus and uncertainty about broad economic recovery. For the Legislature’s budgeting process, this forecast translates to a total of $1.4 billion in available new one-time funding ($315 million above the December forecast), and $205 million in available new ongoing state funds ($112 million above the December forecast). By comparison, the requests to date from appropriations subcommittee priorities, fiscal note bills, and other requests total nearly $2 billion one-time and $400 million ongoing.
The Tax Commission’s TC-23 Reports, detailing cumulative revenue collections through January and February, are sufficient to support a strong finish to FY 2021 revenues, though collections for February are somewhat short of the new targets. January’s report, including roughly half of the fiscal year, shows sales tax collections up 10.2% over FY 2020. In February, this trend continued, with sales tax posting a 10.0% increase over the same period in the previous fiscal year. These strong sales tax revenues are primarily driving the General Fund figures, which posted an actual year-over-year (YoY) growth rate of 5.9% in January, and 5.7% in February. Sales and use tax set asides, which include things like Medicaid Expansion and Water Infrastructure, grew 7% over the previous fiscal year. Sales and use tax set asides have a different growth rate than the General Fund because of the specific categories of sales which are taxed, and also because some the set asides have statutory collection caps.
Education Fund sources continue to remain inflated over previous years’ collections, due partially to the income tax deadline extension shifting approximately $770 million from FY 2020 to FY 2021. Corporate tax growth increased from January to February, which could be an indication of seasonal hiring patterns as well as corporate confidence in the economy, as Utah has recovered the number of jobs which were lost during the pandemic. Income tax growth rates have continued to temper (as expected) over the course of the fiscal year, slowly approaching the consensus target of 23.6%.
It is worthwhile to remind readers of the lag between collections and reporting, with January’s report detailing collections made in December, for sales and wages that took place in November. This means that May will be the first time that economists can compare impacts of the pandemic (pre-federal stimulus) to the current fiscal year for the General Fund. Education Fund comparisons may be more appropriate in a fiscal year with typical timing for income tax collections.
While legislative economists are cautiously optimistic, they offer some important caveats to the positive outlook through the fiscal year, including that forthcoming federal stimulus will likely be the final installment of pandemic related funding for states. They note there may also be slower recovery for the hardest-hit sectors of the economy, in contrast to the state’s revenues in aggregate. As a final caution, legislative economists observe that current conditions show potential for increased inflation, which could reduce consumer spending, and any increase in interest rates may cause certain sectors (such as housing) to slow.
The reports referenced in this post are available at the links below:
January Revenue Snapshot FY 2021
TC-23 Revenue Summary (Period 6, FY 2021)
February Revenue Snapshot FY 2021
TC-23 Revenue Summary (Period 7, 2021)
Consensus Revenue Estimates
It's a Wrap! The 2021 General Session Comes to a Close
The Utah Legislature adjourned on the 45th day of a General Session which was groundbreaking in many ways. Utah’s $23.5 billion budget for Fiscal Year 2022 includes $10 billion in spending from the General and Education funds, and nearly $7 billion from Federal funds. During a pandemic, the Utah legislature was able to fund very notable investments for the state, which include:
- -Nearly $100 million in tax cuts,
- -Public education enrollment growth and inflation (and restored a 6% increase in per-student funding),
- -$121 million for public school teacher stipends,
- -$127 million ongoing for public education economic stabilization,
- -Nearly half a billion dollars for public education,
- -A more than 9% increase for higher education,
- -$200 million in new cash-funded building and land purchases,
- -$1.1 billion for roads and transit,
- -$36.5 million for two new state parks (a third of that with investment earnings and not taxes),
- -$110 million to renovate existing state parks and create new trails, bike lanes, and pedestrian pathways,
- -$56 million for wildfire suppression,
- -3% raises for state and higher education employees,
- -Targeted increases for front-line workers in social service agencies, public safety, and corrections,
- -Fully funded growth and inflation in Medicaid (and fixed a $56 million structural imbalance in Medicaid expansion),
- -$26 million in new ongoing funding to enhance mental health services,
- -$50 million in tax proceeds, securing a total of $730 million in combined public-private funding for housing and homelessness, and
- -$250 million to address the pandemic, including economic development assistance, rural broadband expansion, testing, and vaccine distribution.
There are a number of resources available for the public and legislators to understand more about Fiscal Year 2021 and 2022 funding:
Budget Quick Facts – A pocket-sized guide to the budget.
Budget in Bullets – Highlights of the state budget overall as well as detail for each appropriations subcommittee.
DataViz – An interactive graphical representation of the budget. View the budget by sources, uses, and new money. Click a bubble to see how that item has changed over time, and in what bills it changed. Search for budget requests and find where it exists in appropriations bills.
Compendium of Budget Information (COBI) – A complete guide to the Utah State budget. Find budget requests on the Issues tab, and Line item/program budgets on the Financials tab.
Revenue On-Pace through Month Eight
The Utah State Tax Commission released updated revenue collection data today. For the first eight months of fiscal year 2021, General and Education Fund revenue is slightly below our latest point projections, but well within range to hit our target at year-end. Sales tax continues to be stronger than anticipated. Income tax is almost exactly on target. Other GF/EF sources lag projections a bit, but change dramatically at year-end. We anticipate the year-over-year income tax growth rate will accelerate in the next two months as "normal" collections are compared with last year's delayed collections.
Month eight Transportation Fund revenue lags behind our point target for the year as a whole, but is still within range. In the next few months we'll know more about whether driving habits changed by the pandemic will result in lower than projected gas tax collections.
For a more detailed summary, see our monthly snapshot. For all the gory details, check-out the TC-23.
Revenue Snapshot - March 2021 (FY21)
TC-23 Revenue Summary (Period 8, FY 2021)
What Does the American Rescue Plan Act Mean for Utah?
On March 11th, Congress enacted the American Rescue Plan Act (ARPA) of 2021, the third (and likely final) round of stimulus funding related to the COVID-19 pandemic. Of the total $1.9 trillion in Federal aid, the Office of the Legislative Fiscal Analyst (LFA) estimates that over $8.3 billion will make its way to Utah in the forms of payments to state and local governments, targeted agency grants, enhanced unemployment benefits, and individual stimulus checks. The financial impact of APRA in Utah is somewhere in the middle of the previous two stimulus packages passed by the Federal government in 2020. The Coronavirus Aid, Relief, and Economic Security Act (CARES) and Families First Corona Virus Response Act (March 2020) brought in roughly $13.6 billion in aid to Utah, and the Consolidated Appropriations Act (December 2020) infused approximately $4.3 billion to the Beehive State.
The LFA summary of the stimulus package includes information about funding distribution to Utah by recipient, along with permissible uses. Details on timing constraints, matching requirements, and other specifics can be found in the companion table. This summary brief will be updated as additional details are made available. Provided data is preliminary, and is subject to change as federal agencies responsible for managing the programs issue further guidance.
The reports referenced in this post can be found below:
Initial Summary of the American Rescue Plan Act
American Rescue Plan Allocations to Utah (Companion Table)
Legislators Alter the Trajectory of Taxation in Utah
Have you ever laid awake at night wondering ‘when did Utah start collecting sales tax?’, ‘was income tax always earmarked for education?’ or even ‘I wonder if there’s a lag between recessions and income tax collection?’ If you have, you may be a fiscal analyst at heart.*
The answer to all these questions and more is in the Legislative Fiscal Analyst diagram of the complete history of income and sales taxation in Utah. This nerd-worthy graph is based on the Utah State Tax Commissions regularly published History of the Utah Tax Structure. The chart shows policy changes superimposed on historical trends for real, per-capita income and sales tax revenues. Gray vertical bars represent periods of recession in the economy, such as the Great Recession beginning in 2008. (Note: 2020 figures are approximate, as they are based on population and Consumer Price Index forecasts.)
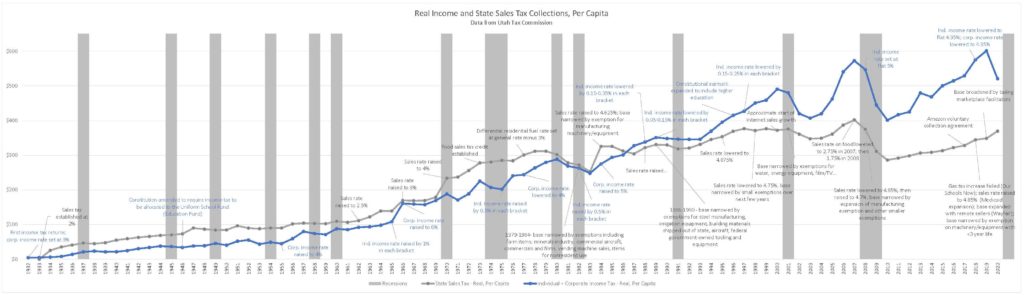
Presenting the tax revenue data this way allows legislators and constituents to observe how individual policy choices have impacted the trajectory of sales and income taxes. Outside factors (including things like consumer spending patterns) have also influenced changes in tax revenue. It is noteworthy that over time income tax revenue has proven more volatile than sales tax. That volatility has been partially spurred by policy changes. Another key takeaway from the chart is that starting in the early-to-mid nineties, a growth differential between the two taxes began which has accumulated over time. This is important because until recently, income taxes in Utah were earmarked only for education in Utah.
In November 2020, voters passed Constitutional Amendment G, which in the medium-term makes the growing gap between income tax and sales tax a bit less worrisome. The amendment gives appropriators the flexibility to use income tax revenue for programs that benefit children and individuals with disabilities, in addition to public and higher education. In the 2021 General Session, this allowed legislators to shift nearly $456 million one-time income tax revenues to these newly approved uses in FY 2021 and FY 2022. In-turn, this freed up General Fund revenues which allowed the state to invest tax windfalls associated with the pandemic in roads, transit, parks, and recreation. The one-time funding swaps will revert to their original designations in the FY 2023 base budgets. However, Amendment G is only a partial solution to tax modernization in Utah, as demonstrated by one-time changes made by the 2021 Legislature.
Legislators also passed three bills during the 2021 General Session that set out to address the revenue disparity, and also aim to reduce the income tax burden on families, military, and senior citizens. Senate Bill 153, which changes dependent exemptions, reduces an estimated $54.9 million ongoing in income tax revenue. Senate Bill 11 eliminates taxes on military retirement pay, reducing income tax payments for certain individuals by an estimated $24.6 million ongoing in aggregate. Finally, House Bill 86, which reduces tax collected for certain social security income, is estimated to reduce Education Fund balances by $18.3 million ongoing.
The Office of the Legislative Fiscal Analyst will continue to update this chart as new information is available, for as American writer and educator John Gardner said, “history never looks like history when you are living through it.” (At least not until it’s been summarized in a nifty line graph.)
*And you should know we are hiring.
Revenue through Third Quarter Lags Projections
Utah's General and Education Fund revenue collections for the first nine months of fiscal year 2021 slightly lag projected full-year growth rates. Through March, General and Education Fund collections have grown by 26.3% compared with an expected 27.9% for the fiscal year* as a whole.
Should this -1.6% differential remain unchanged in the remaining three months of fiscal year 2021, Utah would have a $148 million General and Education Fund deficit at fiscal year-end. However, legislative economists expect collections will accelerate in the next three months as corporations and individuals pay income taxes in April and May. This is in contrast to last year when final payments weren't made until July 15 - after fiscal year 2020 ended.
Transportation Fund revenue collections for the first three quarters of the year are currently up only 2.8%, significantly trailing behind full-year projections of +5.6%. However, last year fuel sales in the fourth quarter of fiscal year 2020 dropped due to stay-at-home orders. Economists expect the year-over-year difference in motor fuel collections will accelerate in the next three months.
*Utah's fiscal year runs from July 1 to June 30.
For more detail, see our regular publications at the links below:
April Revenue Snapshot FY 2021
TC-23 Revenue Summary (Period 9, FY 2021)
What's in Store for the 2021 First Special Session?
On Monday, May 10th, 2021 the United States Treasury released additional guidance related to the American Rescue Plan Act (ARPA). While there are still many unknowns, we now know:
1. Utah will receive its state allocation in two 50 percent tranches, with half arriving this May and the remaining in May 2022.
2. Which industries can be considered “impacted” by the pandemic, for the purposes of receiving aid from these funds. Tourism, travel, and hospitality industries are considered impacted, as well as other industries that have experienced comparable negative economic impacts from the pandemic. The guidance gives the example of the revenue decline of 24 percent and the employment decline of 17 percent nationally for the leisure and hospitality industry, as a benchmark for whether other industries might be considered “impacted” and thus eligible to receive assistance from ARPA funds.
3. How state revenue loss should be calculated to determine the extent of which ARPA funds may be used for revenue replacement. Utah will calculate a baseline for anticipated pre-pandemic revenue using fiscal year (FY) 2019 as the starting point and applying a growth adjustment of the greater of 4.1 percent per year or Utah’s average annual general revenue growth rate from FY 2016 to FY 2019. This baseline will be compared to actual revenue collections, and the difference may be considered revenue loss, and thus be filled using ARPA funds.
On Wednesday, May 19th, the Legislature expects to convene for a Special Session in which the state will formally accept these ARPA grant funds from the Federal Government. While total allocations have not been finalized, initial estimates are that Utah will have $1.65 billion to appropriate under both the State Fiscal Relief Fund and the Coronavirus Capital Projects Fund. Of that amount, only a portion will be appropriated during the Special Session, for the State’s most pressing needs. The Utah Legislature will spend the interim deciding on the best uses of ARPA funds for the state, waiting for the 2022 General Session to distribute remaining ARPA funding, once final allocations and guidance have been issued. The Executive Appropriations Committee has drafted a menu of allocations that the state can use to guide spending of this massive fiscal stimulus package on permissible uses.
Update 5/20/2021: During the 2021 First Special Sesssion, the Legislature passed Senate Bill 1001 Appropriations Adjustments, which appropriated funding from the American Recovery Plan Act (among other things). An index of S.B.1001's General and Education Fund, ARPA and Utah Capital Investment Restricted Account adjustment is available here.
Sales Tax Exceeds Expectations, Income Tax Still Boosted from 2020 Filings
On May 14th, the Legislative Fiscal Analyst and Governor’s Office of Planning and Budget released their Revenue Snapshot summary, based on the Tax Commission’s TC-23 revenue summary for May of 2021. Growth to all state funds slightly exceeded projections, posting a 28.3% growth rate through 10 months of the Fiscal Year (FY).
From all sources, the General Fund grew 8.5 percent over May of FY 2020. Of that growth, sales and use tax was the largest contributor, with a 14.4 percent growth rate over the same time last year. Sales tax reported in May reflects sales which took place in the month of March, that were collected in April. This bump may be attributed tourism expenditures over spring break (especially in contrast to March of 2020), in addition to issuance of the final round of individual stimulus checks. Collections from ‘All Other Sources’ (including Oil and Gas Severance Tax, Court Fees, and others) were down -15.0 percent from FY 2020, but were well within the forecasted range.
Education Fund collections are still inflated primarily due to delayed income tax payments, which moved the tax filing deadline from FY 2020 to FY 2021. All other sources to the Education Fund (including Mineral Production Withholding tax) are down -21.6 percent but fall within the expected range. Corporate earnings have increasingly exceeded projections, this month posting an 89.5 percent growth rate over May 2020. Next month’s revenue summary may see an even larger disparity for Education Fund collections between fiscal years, as this year’s final tax payments (due May 17th) are collected and compared against FY 2020 figures. Similarly, the Transportation Fund (which posted a 3.9% growth rate) may see accelerated growth to close the year, as earnings are compared to revenues collected during the stay-at-home orders of spring of 2020.
To celebrate Tax Day, on May 17th the Legislative Fiscal Analyst released updated Consensus Revenue estimates. These latest estimates build on the adopted revenue forecasts from February 2021 adding changes made by the Legislature during the 2021 General Session, including tax law changes and appropriations from certain restricted accounts that impact general fund revenues.
The reports referenced in this report are available at the links below:
TC-23 Revenue Summary (Period 10, FY 2021)
Revenue Snapshot – May 2021 (FY21)
Economists Warn of Inflationary Pressure as Surplus Trickles In
On Monday, June 14th, the Tax Commission released their TC-23 revenue summary, detailing collections through period 11 of the 2021 Fiscal Year, along with the Revenue Snapshot produced by the Legislative Fiscal Analyst and Governor’s Office economists. In stark contrast to June of 2020, when the legislature passed appropriations bills reducing ongoing budgets, it appears this Fiscal Year will end with revenues in certain categories exceeding annual projections.
The General Fund, fueled primarily by sale and use tax, is up 10.5 percent over the same time last year. Since March, the sales tax growth rate has accelerated, increasing from 10.3 percent growth in February to 16.5 percent growth in May. This trajectory may coincide with federal stimulus actions, and perhaps reflect an increase in consumer confidence as pandemic restrictions are reduced.
The Education Fund posted a 60.6 percent growth rate over the same collection period for FY 2020. Two factors have heavily influenced individual income tax growth: federal stimulus activities and amended tax filing dates. Federal stimulus has had a positive impact on personal income, which makes comparison to previous years (even pre-pandemic) challenging. Second, the current Fiscal Year collections include 2020 and 2021 tax filings and are being compared to FY 2020 in which no individual year-end tax filings were collected. Additionally, Corporate Tax revenue has increased by nearly 95.0 percent over last year, indicating sharp increases in corporate income.
While the outlook for the end of the fiscal year is positive for Utah (with an expected budget surplus) the increased revenue may be bittersweet. Federal stimulus which has influenced upward growth in each of the state funds may also be contributing to inflationary pressure, which could result in the nominal growth measured in these reports less impactful.
The reports referenced in this post are available at the links below:
TC-23 Revenue Summary (Period 11, FY 2021)
Revenue Snapshot - June 2021 (FY21)
Federal Intervention Drives Unpredicted Growth in Preliminary FY 2021 Year-End Tax Collections
According to the Utah State Tax Commission’s preliminary 2021 fiscal year-end TC-23 revenue summary and an accompanying Revenue Snapshot from the Office of the Legislative Fiscal Analyst and the Governor’s Office of Planning and Budget, preliminary data show total state revenues up 30.5 percent at the end of FY 2021 compared to FY 2020. This increase surpasses economists’ expectations and indicates strong economic growth coming out of the COVID-19 pandemic and economic downturn. However, there remains considerable uncertainty regarding the extent to which unprecedented federal stimulus throughout the fiscal year has buoyed revenues and created a one-time bolster effect that will not aid revenues moving forward. All year-end numbers are tentative at this point pending final accounting adjustments. Such adjustments could include deposits to rainy day funds and allocations to earmarked restricted funds, which may decrease final General and Education Fund numbers.
General Fund collections grew 16.5 percent on a year-over-year (YoY) basis, compared to a target of 9.6 percent. Taxable sales are up 20.0 percent YoY, with some of the hardest-hit sectors experiencing dramatic bouncebacks, such as transient room taxable charges up 246 percent and restaurant taxable charges up 47.7 percent YoY. Two rounds of stimulus checks, coupled with pent-up demand being released as the economy gained steam, bolstered General Fund collections in FY2021.
Education Fund collections grew by 41.3 percent YoY, compared to a target growth rate of 27.9 percent. While individual income tax grew by 53.3 percent, corporate income tax hit an astonishing 108.1 percent YoY growth rate. Once again, the effect of federal stimulus legislation is at play in Education Fund collections; loans enabled businesses to keep employees on their payrolls, and unexpectedly high consumer spending likely aided income tax collections as well. Additionally, due to the delay in the income tax filing deadline in 2020, the YoY growth rate does not include total 2020 collections, and so should be interpreted cautiously.
The numbers presented here and in the attached reports will change in the coming weeks, as state accountants make adjustments and close the books on the fiscal year. Thus, in spite of significant growth in many areas of collections, potential surplus amounts will not be estimated until later in the calendar year.
The reports referenced in this post are available at the links below:
TC-23 Revenue Summary (Year-end, FY 2021)
Revenue Snapshot – July 2021 (FY21)
Updated Guidance for the American Rescue Plan Act, in Context for Utah
In March, Congress passed the American Rescue Plan Act (ARPA), which was the third tranche of fiscal stimulus aimed to address revenue and policy issues related to the COVID-19 pandemic. In July, the Treasury updated guidance to clarify permissible uses of funding. As promised, the Legislative Fiscal Analyst has released a supplement to their initial summary of ARPA and the bill’s implications for Utah, based on the latest information from the Treasury.
Original estimates were that the act would provide $8.3 billion in total federal revenues to the state, that figure has since increased to just under $9.2 billion. Most of the estimated increase in revenue are provided by agency-specific funding, expected to make its way to Utah in the form of grants. Direct and individual stimulus payment estimate also increased by nearly $160 million.
On the other hand, the estimate of Utah’s State Fiscal Relief Fund decreased from $1.52 billion to $1.38 billion. The State Fiscal Relief Fund provides broad discretionary spending authority as ‘revenue replacement’, allowing flexibility to use the funds in the place of estimated revenue declines associated with the pandemic. Utah’s economists estimate that the state will have sufficient revenue replacement dollars to cover all uses proposed in the 2021 First Special Session.
A detailed outline of the acceptable uses for the State Fiscal Relief Fund are available in the Updated Summary of the American Rescue Plan Act.
The reports referenced in this post can be found below:
Updated Summary of the American Rescue Plan Act
American Rescue Plan Allocations to Utah
Utah’s Revenue Comparisons Muddled by Federal Intervention
Federal Stimulus Likely Behind FY 2021 Yearend Figures
This month the Legislative Fiscal Analyst (LFA) and the Governor’s Office of Planning and Budget (GOPB) released their Revenue Snapshots for the final, year-end of FY 2021 as well as first quarter of FY 2022, based on the TC-23 Revenue Summary reports from the Utah State Tax Commission. When compared to the preliminary data published in July, Fiscal Year 2021 ended on a slightly higher note than was originally reported, with collections adding another roughly twenty million to total $10.72 billion for the year. The combined growth rates for the General, Education, and Transportation funds tempered slightly from 38.7 to 36.6 percent according to final collections. The year-over-year (YoY) comparisons for the Transportation Fund in the last two periods of the Fiscal Year show accelerated growth, which is perhaps not surprising when considering that these figures are in contrast to the first months of the pandemic when travel was extremely limited. The staggering growth rates for all three state funds can likely be attributed to a combination of federal stimulus dollars, delayed income tax collections, and pent-up demand due to economy closures.
Despite Appearances, FY 2022 Off to a Good Start
The irregularities that plagued last year’s comparisons (including federal stimulus payments and delayed income tax filing deadlines) appear to linger on, as October’s Revenue Snapshot (including activity from July, August, and September) reports a -15 percent growth rate in the Education Fund collections. On target with the February consensus forecast, the Individual Income tax collections posted a -33 percent growth rate when compared to Q1 of FY 2021. As you’ll recall, the income tax filing deadline was pushed from FY 2020 into FY 2021, meaning that the seemingly negative October YoY comparison for income tax collections is based on these inflated numbers from last year. Other sources to the Education Fund are above target, with Corporate Taxes posting a 24.4 percent YoY increase, at $77 million above the projected range.
In the first three months of the fiscal year, General Fund collections outpaced the forecasted growth rate sevenfold. While most of the 22.0 percent YoY growth is attributed to sales tax, performance from sources, such as severance tax collections, also outpaced projections. As with any fiscal year, revenue collections are typically volatile in the first quarter and caution should be exercised when interpreting these early-year reports. It should also be noted that collections lag economic activity by up to four months depending on the tax type. In the coming weeks, economists from LFA, GOPB and the Utah State Tax Commission will meet to revise their consensus revenue estimates for Fiscal Year 2022 based on the latest economic indicators.
The reports referenced in this post are available at the links below:
Final Yearend Revenue Snapshot FY 2021
First Quarter Revenue Snapshot FY 2022
Tax Commission Revenue Summary/TC-23 (Yearend, FY 2021)
Tax Commission Revenue Summary/TC-23 (Period 3, FY 2022)
Legislative and Executive Branches Announce Joint Plan for Performance Initiatives
On December 7th, staff from the Office of the Legislative Fiscal Analyst (LFA) and Governor’s Office of Planning and Budget (GOPB) released a plan for how the legislative and executive branches will work together to enhance performance measurement and efficiency of government processes in the State. Staff developed the plan as directed by H.B. 326, “Performance Reporting and Efficiency Requirements” (2021 General Session) and presented it to both the Legislative Management Committee and Governor as part of a required annual update.
In partnership with state agencies, LFA and GOPB have implemented the performance measurement requirements of the legislation and published currently available data on the performance tabs of LFA’s Compendium of Budget Information (COBI) website. By the start of the 2022 General Session, performance data will also be available on the new state dashboard performance.utah.gov. LFA and GOPB will begin efficiency evaluations in 2022, and will provide a preliminary report to the Legislative Management Committee and Governor by May 1, 2022.
The plan envisions different roles and responsibilities for both the executive branch and the Legislature, including the newly created Efficiency and Process Improvement Committee (EPIC).
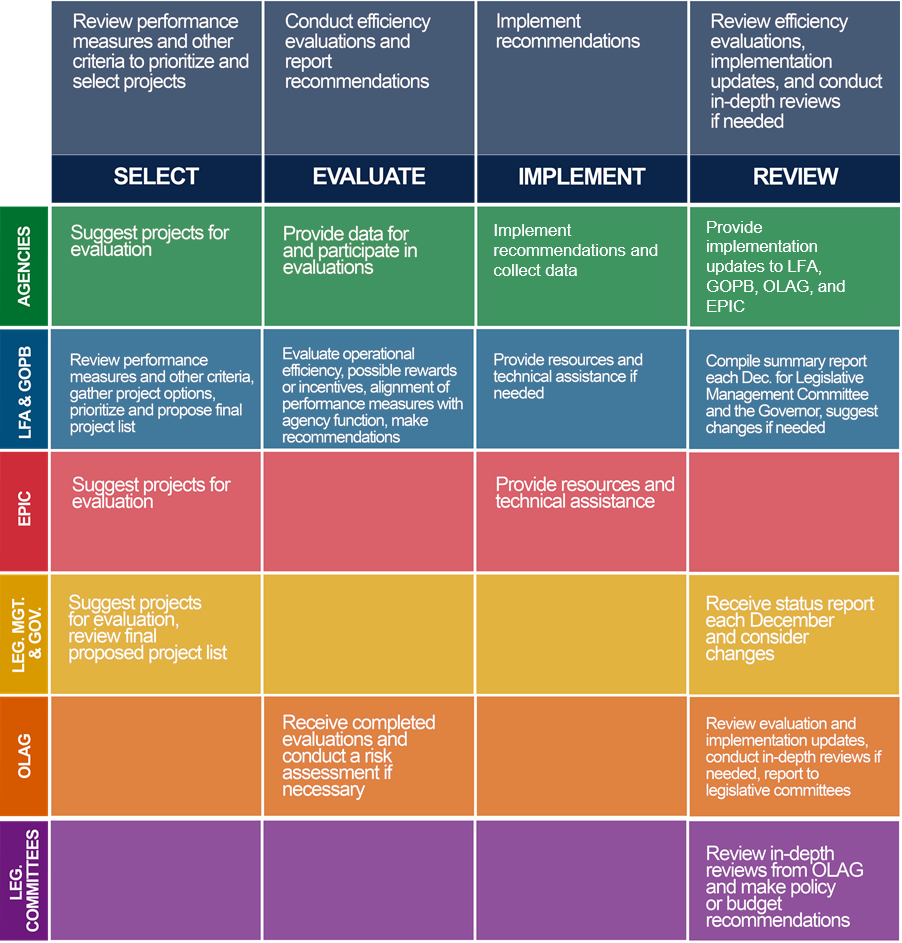
As articulated in the report, LFA and GOPB developed a shared vision for new performance and efficiency initiatives: “Our vision for Utah government builds on the State’s existing work ethic and fiscal judiciousness to create a culture of innovation, where bold management efforts are rewarded and not punished. We will support our managers with training and capacity to be agents of efficiency with excellent soft skills and we will provide professional learning that makes long-term employment with the State an attractive career track for talented individuals. We will measure fewer but more meaningful outcomes to assess and re-evaluate taxpayer investments. We will streamline outdated bureaucracy to focus efforts on those outcomes. To accomplish all this, we will coordinate across the legislative and executive branches to support agencies and focus their efforts on providing exemplary service to the people of the State of Utah.” Read more about the plan, here.
Tax Commission Annual Report Details Historic Year for Revenues
On December 30th, the Utah State Tax Commission released their Annual Report for Fiscal Year 2021. From July 2020 to June 2021, the state of Utah collected $13.97 billion in tax revenues, which represents a 30.5 percent increase over FY 2020. Most of the growth is attributed to the income tax filing deadline delay, adjusting revenue typically intended for FY 2020 into collections for FY 2021. The Education Fund (which is primarily income tax) grew by 57.2 percent over FY 2020. Healthy, yet more moderate growth was observed in the General and Transportation Funds (both primarily sales tax), reporting increases of 13.9 percent and 8.4 percent, respectively, over FY 2020. The Tax Commission estimates that $735 million in individual income, and $60 million in corporate income, was shifted from the previous fiscal year into FY 2021 due to the filing extension. They estimate that without the extension, induvial income taxes would have increased 13.9 percent and corporate income taxes would have increased by 64.2 percent. It's noted by Legislative Economists that after accounting for the shift in income taxes between fiscal years, a likely cause of the growth to state funds is federal stimulus actions.
Severance taxes for both Mining and Oil and Gas were down from FY 2020, albeit to differing extents. Compared to the previous fiscal year, Mining Severance was down 6.8% while Oil and Gas tax revenue was down 40.7% from FY 2020 due to decreased drilling activity in the state. In addition to the stats listed here, the Annual Report includes detailed information on collections, such as restaurant sales tax by county, percent income tax share according to income bracket, resort communities’ sales taxes collections, and more. Monthly revenue reports produced by the Tax Commission, along with the Legislature and GOPB monthly revenue snapshots are available online.
Robust Revenues Continue into the 2022 General Session
On Tuesday, January 18th, the 2022 General Session kicks off at the Utah State Capitol. For the following 45 days, lawmakers will consider new legislation and authorize the state’s budget for the remainder of FY 2022 along with the whole of FY 2023. To balance the state’s budget, legislators need key pieces of information including the direct fiscal impact of proposed legislation and up-to-date revenue estimates. To provide this information, the Legislative Fiscal Analyst (LFA) prepares fiscal notes for each bill within three business days of receiving the bill file and Legislative Economists, along with the Governor’s Office of Planning and Budget (GOPB) and the Utah Tax Commission, prepare revenue estimates for the budget year. Those estimates are presented to the Executive Appropriations Committee ahead of their deadline to draft the final appropriations act (38th day of the session).
Prior to updated revenue estimates, the LFA, GOPB and the Utah Tax Commission prepare monthly revenue tax revenue summaries that can be used to understand where collections are for the year. January’s Revenue Snapshot and Tax Revenue Summary indicate that revenues are strong and growing slightly faster than the annualized projection.
Through six months of FY 2022, the Education Fund totaled $2.8 billion, which is on target with projections for income tax collections. The General Fund reported a growth rate of 20.8% over FY 2021, which is higher than expected. It’s important to consider that January’s report captures collections from December, for sales and wages that took place in November. This carries two caveats: first, a portion of the General Fund performance is likely due to holiday sales, and secondly, these figures do not capture the impact that recent events in the pandemic have had on Utah’s economy. Other notable takeaways from the reports include the performance of the mining and oil industries, with severance tax for both mining and oil/gas along with mineral production withholding collections up by more than 250% percent over January 2021.
The reports referenced in this post are available at the following links:
January Revenue Snapshot (FY 2022)
Tax Commission Revenue Summary (Period 6, FY 2022)
Spring Brings Strong Forecasts and Updated Collections
Monday, March 14th, the Tax Commission released its Revenue Summary report (TC-23) concurrent with the monthly Revenue Snapshot produced by the Legislative Fiscal Analyst (LFA) and Governor’s Office of Planning and Budget (GOPB). Both reports detail tax revenue through March and contrast those collections to last year’s receipts (TC-23) and predicted state revenue (Revenue Snapshot). Through eight months of the fiscal year, collections for all sources are up 7.5% over FY 2021 and up 3.1% for the General, Education and Transportation Funds combined.
In late February, the Tax Commission, GOPB and LFA updated consensus revenue estimates through the end of the current fiscal year as well as for FY 2023. These revised estimates increased expected collections by $435.7 million, including $127.8 million to the General Fund and $304.3 million to the Education Fund. Top performers to the General Fund thus far in FY22 include State Sales Tax (up 20% in FY 2021) and Oil and Gas Severance Tax (up 695%). Similarly, sources to the Education Fund with notable growth include Corporate Tax (up 30.1% over FY 2021), Mineral Production Tax Withholding (up 179%).
On the outset of the fourth fiscal quarter, FY 2022 looks to be another growth year for the Utah economy. However, one should note that recent international conflicts could negatively impact collections through the end of the year. Headwinds include market volatility, increased fuel prices, consumer wariness, and of course, inflation. Further, trade sanctions have the potential to effect corporate profits and GDP growth.
The reports referenced in this post are available at the links below:
March Revenue Snapshot (FY 2022)
Tax Commission Revenue Summary (Period 8, FY 2022)
2022 General Session Updates to Arts, Heritage, and Economic Development Grants
During the 2022 General Session, legislators embarked upon a new approach to grant funding for arts, heritage, culture, events, and economic development. They attempted to balance the Legislature’s constitutional role in appropriating with a desire for greater accountability and transparency from grant recipients. To do so, they reworked pass-through funding at the Department of Cultural and Community Engagement and Governor’s Office of Economic Opportunity (GOEO). For grants made by both departments, policymakers established two paths – an application path managed by executive branch agencies, and a pass-through path directed by legislative intent (see language below)
The Legislature added two new competitive grant programs at CCE, the Capital Facilities Program and the Heritage and Events Program. These new additions complement CCE’s current operationally focused grant program, the Arts Sustainability Grant Program (now deemed the Arts and Museums Grant Program) which will continue to provide operational support to non-profit cultural and arts organizations within the state. The Capital Facilities Grant Program is a continuation of a pilot program initially funded during the 2021 General Session. Funds allocated for this program will be used to help organizations with new construction, renovations, remodeling, and consulting for major capital projects. The Heritage and Events Grant Program will focus primarily on events that enhance the culture of Utah including festivals, heritage celebrations, fairs, and others.
The Legislature also created an operation-focused competitive grant program within GOEO. The Economic Assistance Grant program will provide funding to organizations, projects, and programs that create and/or retain high quality jobs, improve state revenues, or otherwise enhance the economy of the State of Utah. In addition to $4.5 million ongoing General Fund, the Legislature also allocated $4.5 million one-time in American Rescue Plan Act (ARPA) funds targeted at Event Service Revitalization. ARPA funds will be used to help Utah-based privately owned event providers and businesses still struggling with the lingering effects of the COVID-19 pandemic.
Funding for the new and existing competitive and pass-through grants can be seen in the table below, followed by intent language naming pass-through recipients. Legislators also passed intent language stating that all current pass-through recipients would need to compete in an application process beginning in FY 2024.
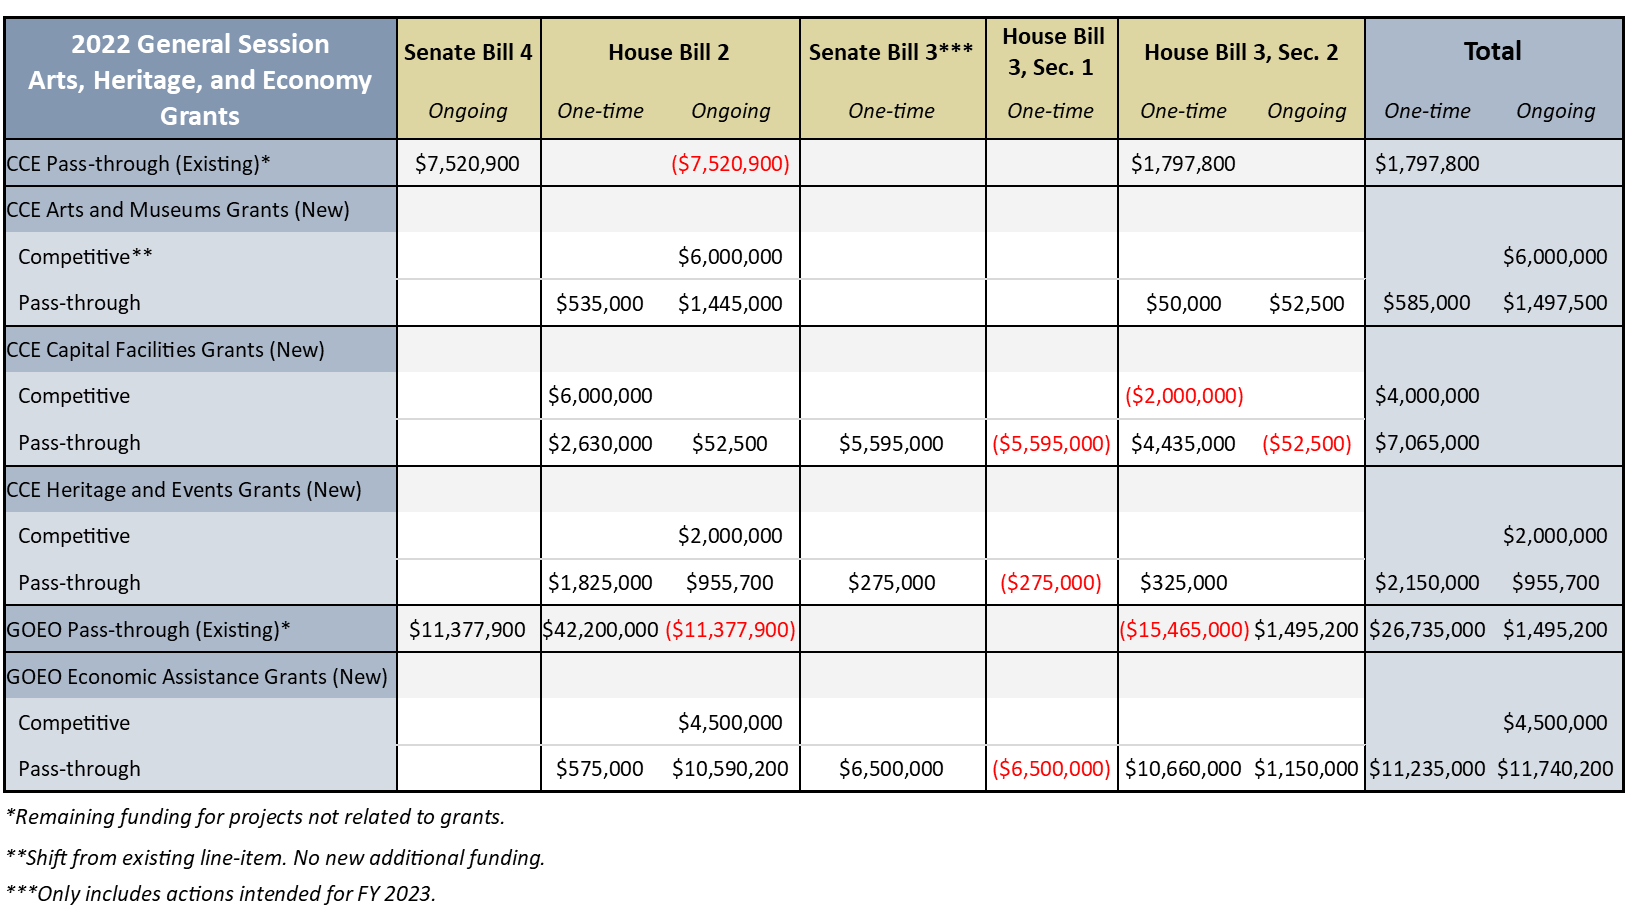
Legislative intent language was included in appropriations bills associated with each new grant program in the table above:
CCE Arts and Museums Grants:
Notwithstanding the intent in "New Year Supplemental Appropriations Act" (House Bill 2, 2022 General Session) item 65, The Legislature intends that the Department of Cultural and Community Engagement use appropriations provided by House Bill 2, item 65 and this item to consider funding for the following projects and pass-through grants: El Systema @ Salty Crickets $50,000; Hale Center Theater Orem $300,000; Hill Aerospace Museum $175,000; Ogden Union Station Foundation $100,000; Utah Shakespeare Festival $350,000; Utah Sports Hall of Fame $252,500, Center Point Legacy Theater $100,000; Utah Humanities $220,000; Tuacahn Center for the Arts $535,000.
The Legislature intends that entities receiving pass-through grants in FY 2023 submit applications for the Arts and Museums Competitive Grants program for FY 2024.
CCE Capital Facilities Grants:
Notwithstanding the intent in "Current Fiscal Year Supplemental Appropriations Act" (Senate Bill 3, 2022 General Session) item 43 and "New Year Supplemental Appropriations Act" (House Bill 2, 2022 General Session) item 66, the Legislature intends that the Department of Cultural and Community Engagement use appropriations provided by House Bill 2, item 66 and this item to consider funding for the following projects and pass-through grants: Utah Shakespeare Festival - Theatrical Equipment $540,000; Improvements to Mount Pleasant's ConToy Arena $340,000; Golden Spike Monument $750,000; Fullmer Legacy Center $2,000,000; Ogden Pioneer Days Stadium Upgrade $1,435,000; Hale Centre Theatre, $1,000,000; and Utah Museum of Contemporary Art, $1,000,000.
The Legislature intends that entities receiving pass-through grants in FY 2023 submit applications for the Capital Facilities Competitive Grants program for FY 2024.
CCE Heritage and Events Grants:
Notwithstanding the intent in "Current Fiscal Year Supplemental Appropriations Act" (Senate Bill 3, 2022 General Session) item 44 and "New Year Supplemental Appropriations Act" (House Bill 2, 2022 General Session) item 67, the Legislature intends that the Department of Cultural and Community Engagement use appropriations provided by House Bill 2, item 67 and this item to consider funding for the following projects and pass-through grants: Big Outdoor Expo $135,000; Kearns Accomplishment Pageant $4,500; Larry H. Miller Summer Games $95,000; Utah Valley Tip Off Classic $22,500; Warriors Over the Wasatch/Hill AFB Show $180,000; American West Heritage Center $7,300; Days of 47 Rodeo $200,000; Davis County Support for Utah Championship $120,000; America's Freedom Festival at Provo $100,000; Run Elite Program $166,400; Targeted Youth Support Program $1,100,000; Refugee Soccer $250,000; Utah County Junior Achievement City $500,000; Ute Stampede Economic Development $225,000.
The Legislature intends that entities receiving pass-through grants in FY 2023 submit applications for the Heritage and Events Competitive Grants program for FY 2024.
GOEO Economic Assistance Grants:
Notwithstanding the intent in "Current Fiscal Year Supplemental Appropriations Act" (Senate Bill 3, 2022 General Session) item 37 and "New Year Supplemental Appropriations Act" (House Bill 2, 2022 General Session) item 59, the Legislature intends that the Governor's Office of Economic Opportunity use appropriations provided by House Bill 2, item 59 and this item to consider funding for the following projects pass-through grants: Northern Economic Alliance $300,000; Pete Suazo Center for Business Development and Entrepreneurship $67,500; Sundance Institute $900,000; Utah Industry Resource Alliance $2,800,000; Utah Small Business Development Center $798,200; World Trade Center Utah $912,500; Get Healthy Utah $250,000; Neighborhood House $180,000; Taste Utah Marketing Campaign $475,000; Utah Council for Citizen Diplomacy $45,000; Women Tech Council/She Tech $250,000; Woman's Excellence for Life $27,000; Youth Impact $45,000; Downtown Alliance $30,000; Utah Sports Commission $6,060,000; Encircle Family and Youth Resource Center $700,000; Youth Bicycle Education Program $325,000; Event Service Industry Revitalization, $4,500,000; Opportunity Zone Economic Development Assistance, $150,000; and Falcon Hill MIDA Project Area Addition $4,160,000.
The Legislature intends that entities receiving pass-through grants in FY 2023 submit applications for the Economic Assistance Competitive Grants program for FY 2024.
Homelessness and Housing Affordability Investments from the 2022 General Session
Affordable Housing versus Homelessness
Housing can be thought of on a continuum as shown below, divided between strategies for homelessness on the left and strategies for affordable housing for moderate income groups on the right:
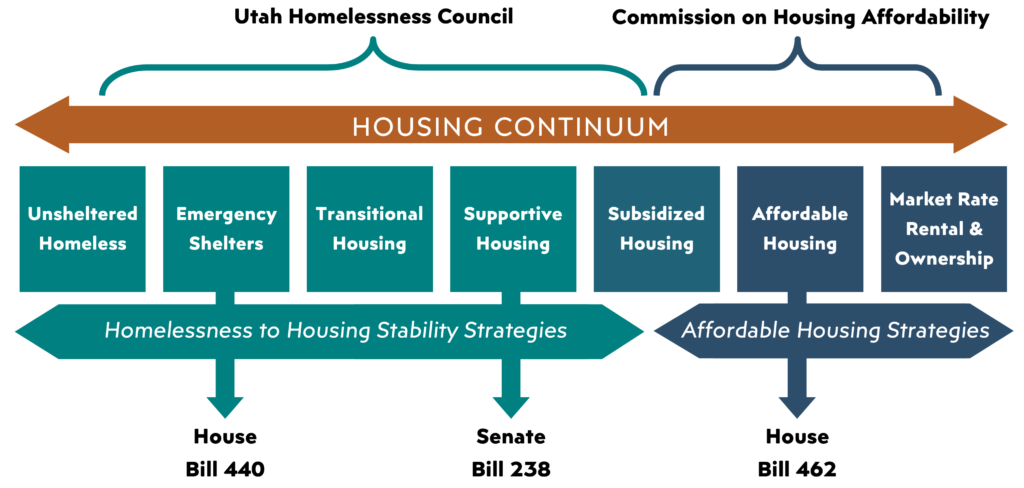
According to the U.S. Department of Housing and Urban Development (HUD), housing is considered affordable if the gross monthly cost including utilities is no more than 30% of a household’s gross monthly income. Another important metric in talking about affordable housing is area median income. This is the midpoint of a region’s income distribution, where half of the households earn more than the median, and half earn less. AMI is used to define low-income households, which are classified as follows: low-income (50-80% AMI), very low income (30-50% AMI), and extremely low-income (below 30% AMI). These income levels set in relation to AMI identify households that may be eligible for affordable housing programs that HUD administers. For example, to be eligible for HUD’s Housing Choice Voucher Program, household income must be at or below 50% AMI. The table below shows the area median income for counties in Utah and the salary for each of these low-income groups; the salary shown is the high end of the range.
| County | AMI | 80% AMI (Low Income) | 50% AMI (Very Low Income) | 30% AMI (Extremely Low Income) |
| Cache | $69,800 | $55,800 | $34,900 | $20,940 |
| Davis | $90,900 | $72,700 | $45,500 | $27,300 |
| Iron | $61,900 | $49,500 | $31,000 | $18,600 |
| Salt Lake | $92,900 | $74,300 | $46,500 | $27,900 |
| Summit | $120,800 | $96,600 | $60,400 | $36,200 |
| Utah | $83,700 | $67,000 | $41,900 | $25,000 |
| Wasatch | $95,400 | $76,300 | $47,700 | $28,600 |
| Weber | $90,900 | $72,700 | $45,500 | $27,270 |
| State of Utah | $85,300 | $68,200 | $42,700 | $25,600 |
2022 General Session Investments in Homelessness and Affordable Housing
During the 2021 General Session, policymakers passed House Bill 347, “Homeless Services Amendments”, creating the Office of Homeless Services in the Department of Workforce Services (DWS). Prior to that, homeless services were under the Division of Housing and Community Development within DWS. The legislation also created the State Homelessness Coordinator position in the Governor’s Office of Planning and Budget and established the Utah Homelessness Council. Governor Cox appointed former Senate President Wayne Niederhauser as the State Homelessness Coordinator April of 2021. Among other things, H.B. 347 (2021) required the council and coordinator to create a statewide strategic plan to minimize homelessness, which includes recommendations to improve the state’s services for those experiencing homelessness. The first iteration of that strategic plan under the coordinator and new office will be presented to legislative committees during October 2022 interim meetings.
Using input from both the State Homeless Coordinator and Office of Homeless Services, legislators addressed a number of issues along the housing continuum during the 2022 General Session.
They prioritized and funded the following items related to homelessness:
- $55.0 million one-time from American Rescue Plan federal funds for deeply affordable housing grants and wraparound services (S.B. 238). These funds are for households making less than 30% area median income and will serve those who are experiencing or are at risk of homelessness. The Commission on Housing Affordability supported this recommendation;*
- $5.0 million ongoing from the General Fund for Homeless Shelter Cities Mitigation Restricted Account for cities to mitigate impacts from having a homeless shelter (H.B. 440);*
- $5.8 million one-time from the General Fund to assist in repaying a loan for a homeless shelter (H.B. 440);
- $1.0 million one-time from American Rescue Plan federal funds to provide overflow shelter for individuals experiencing homelessness (H.B. 440);
- $322,200 ongoing from the General Fund for Office of Homeless Services staffing (H.B. 2 Item 79);* and
- $6.0 million one-time from Temporary Assistance for Needy Families federal funds for temporary housing assistance for formerly incarcerated individuals with families (H.B. 2 Item 76).
Legislators also provided funding for the following affordable housing initiatives:
- $1.3 million one-time from the General Fund for affordable and rural workforce housing efforts (H.B. 462. This bill was recommended by the Commission on Housing Affordability);*
- $5.0 million one-time from the General Fund for assistance to law enforcement officers who are first-time home buyers (H.B. 2 Item 195);
- $15.0 million for preservation of affordable housing where deed restrictions are ending (H.B. 2 Item 195); and
- Reallocation of $5.0 million from Redevelopment Matching Grants to USU Monument Valley (H.B. 3 Item 157). This reduced the total set aside for Redevelopment Matching Grants to $30.0 million (2021 First Special Session), and expanded the permissible uses to include water projects.
*Items included in the Governor's Budget.
Rainy Days in Sight? Sunny Collections for All Major Tax Types, but Clouds Loom
On April 13th, the Utah Tax Commission, Legislative Fiscal Analyst (LFA), and Governor’s Office of Planning and Budget (GOPB) released the TC-23 Revenue Summary Report and Monthly State Revenue Snapshot for the month of April.
Through three quarters of the fiscal year, sales tax posted a 20.3 percent increase over the same period in FY 2021. The oil and gas industry continues to rebound, benefitting the General Fund. Specifically, the oil and gas severance tax posted a 331.5% increase, and the oil and gas conservation fees increased by 154.4% year-over-year (YoY). Comparably, the mining severance tax was up 36.6% over FY 2021, and mineral production withholding increased 201.8% YoY.
Similar to General Fund receipts, income tax grew by 20.9 percent through nine months of FY 2022 after accounting for last year’s delayed income tax filing deadline which shifted some income tax collections from FY 2020 to FY 2021. Corporate income tax increased by 34 percent compared to last March, representing an additional $130.1 million in state collections.
Despite increasing fuel prices, motor fuel tax collections are 6.5% higher than in March 2021.
These figures reflect collections that took place in March for sales and wages that were paid in February. Economic impacts of the Ukrainian conflict likely won’t present until the May or June reports. LFA economists expect recent inflation, consumer sentiment, and a tight labor market to slow the record high growth that Utah has experienced since the beginning of the pandemic.
The reports referenced in this post are available at the links below:
April Revenue Snapshot (FY 2022)
Tax Commission Revenue Summary (Period 9, FY 2022)
Lanes, Trains and Automobiles: A Closer Look at General Fund Investments in Transportation
In the last two budget cycles, Utah policymakers have invested more than $2.1 billion from the General Fund in transit, rail, road and trail projects. This is in addition to the more than $800 million in sales taxes and $725 million in gas taxes and registration fees going directly to transportation annually. While they initially authorized debt for some of this $2.1 billion, appropriators ultimately replaced the borrowing with cash. Their investments leverage windfall state tax revenue generated by temporary federal government economic stimulus. The table below details their investments by bill number and use.
During the 2021 General Session, legislators passed H.B. 244, “First Class County Highway Road Funds Amendments,” authorizing the issuance of $50 million in general obligation (GO) Bonds. The bonds would be repaid by dedicated sales tax generated in Salt Lake County. As shown in the table, H.B. 244 included $30 million in borrowing to be re-lent to local governments through the State Infrastructure Bank. It also included $20 million in financing for these local projects:
- $12 million for construction and improvements to 14600 South in Bluffdale; and
- $8 million for a parking structure in South Jordan.
The Legislature also passed House Bill 433, "Amendments Related to Infrastructure Funding," during the 2021 General Session. H.B. 433 appropriated $834.6 million from the General Fund for road and transit projects. It also authorized $264.0 million in bond issuance for certain rail and transit infrastructure. The H.B. 433 column in the table details many of these transactions. The $28 million provided for local roads by H.B. 433 goes for:
- $5 million for Payson Main Street repair and replacement;
- $8 million for a rail bypass on 14600 South in Bluffdale;
- $5 million for improvements to 4700 South in Taylorsville; and
- $10 million for U.S. 40 Frontage Road improvements near Mayflower.
Prior to the 2021 First Special Session, policymakers learned that certain debt financed projects were shovel-ready while cash funded projects were not. To avoid paying interest on the debt financed projects, lawmakers passed House Bill 1008, “Bond Authorization Amendments.” H.B. 1008 changed which projects would receive cash - or General Fund appropriations - and which projects would incur debt. The legislation did not change the total allocation for each project from the amounts included in H.B. 433.
Having collected higher than forecast tax revenue at the beginning of the 2022 General Session, legislators decided to fully replace bonding authority with General Fund. In Senate Bill 6, “Infrastructure and General Government Base Budget," appropriators provided cash for projects that had been debt-financed in earlier bills (see table). While policymakers approved sufficient cash for all these projects, they did not rescind the debt authorization from statute and should consider doing so in the 2023 General Session.
Toward the end of the 2022 General Session legislators added $1 billion in cash funding for new transportation projects in House Bill 3, “Appropriations Adjustments.” As shown in the table, these appropriations included $75 million each for FrontRunner and Point of the Mountain transit, $30 million for non-motorized trails, and $35 million to the Mountainlands Association of Governments to repay locals for past road investments. For the most part, remaining funding in H.B. 3 accelerates projects ranked by the Transportation Commission, but the bill directs spending from the Transportation Investment Fund to the following state and local projects:
- $10.0 million for the extension of 9000 S in Salt Lake County at the Mountain View Corridor;
- $5.0 million for an environmental analysis for an interchange at US-6 and Spanish Fork Center Street; and
- $5.0 million for an environmental analysis and preliminary engineering for an interchange on I-84 in Mountain Green.
In addition to the General Fund appropriations for transportation described above, appropriators provided $16.2 million for non-motorized trails from the new Outdoor Adventure Infrastructure Restricted Account created in House Bill 409, “Recreation Infrastructure Amendments” (Item 3).
Table Footnotes
1. Rather than bonding for this amount, UDoT plans to use cash-flow from the County of the First Class State Highway Fund.
2. "Amendments Related to Infrastructure Funding" (House Bill 433, 2021 General Session), https://le.utah.gov/~2021/bills/static/HB0433.html, Item 1.
3. "Amendments Related to Infrastructure Funding" (House Bill 433, 2021 General Session), https://le.utah.gov/~2021/bills/static/HB0433.html, Item 2.
4. "Bond Authorization Amendments" (House Bill 1008, 2021 First Special Session), https://le.utah.gov/~2021S1/bills/static/HB1008.html, Section 2 intent language.
5. "Infrastructure and General Government Base Budget" (Senate Bill 6, 2022 General Session), https://le.utah.gov/~2022/bills/static/SB0006.html, Item 41.
6. "Infrastructure and General Government Base Budget" (Senate Bill 6, 2022 General Session), https://le.utah.gov/~2022/bills/static/SB0006.html, Item 49.
7. "Infrastructure and General Government Base Budget" (Senate Bill 6, 2022 General Session), https://le.utah.gov/~2022/bills/static/SB0006.html, Item 42.
8. "Appropriations Adjustments" (House Bill 3, 2022 General Session), https://le.utah.gov/~2022/bills/static/HB0003.html, Item 370.
9. "Appropriations Adjustments" (House Bill 3, 2022 General Session), https://le.utah.gov/~2022/bills/static/HB0003.html, Item 371.
10. "Appropriations Adjustments" (House Bill 3, 2022 General Session), https://le.utah.gov/~2022/bills/static/HB0003.html, Item 162.
11. "Appropriations Adjustments" (House Bill 3, 2022 General Session), https://le.utah.gov/~2022/bills/static/HB0003.html, Item 169.
Retaining Talent in A Tight Labor Market
Utah’s unemployment rate in the first quarter of calendar year 2022 was 2 percent - the lowest in the nation. Recognizing this fact, policymakers prioritized employee retention and recruitment during the 2022 General Session. In sum, legislators appropriated more than $210 million from the General and Education Funds (GF/EF) for salary changes – on top of benefit cost increases. These changes fall generally into three categories – across-the-board, targeted, and directed.
State Agencies
Appropriators provided funding to increase state employees’ salaries as follows:
- ---$54,811,100 from all sources (including $29,309,200 GF/EF) for a 3.5 percent cost of living allowance in state agencies. These funds will in general lift all wages and salary ranges across-the-board.
- ---$37,258,500 from all sources (including $19,698,500 GF/EF) for performance-based discretionary and targeted increases for state employees. This funding is not evenly distributed and allows increases of as much as 15 percent depending on market comparability for certain job titles.
- ---$60,444,500 from all sources (including $10,000,000 one-time and $50,078,200 ongoing GF/EF) for policymaker-directed pay raises to specific employee groups as summarized in the table below.
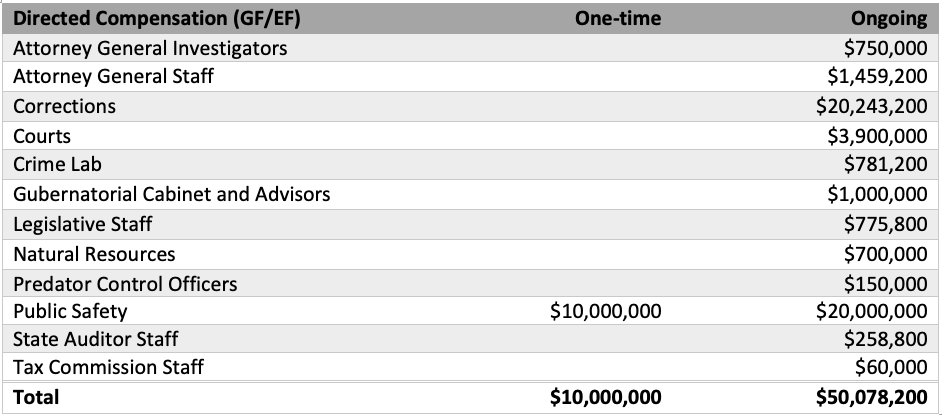
Higher and Public Education
Higher education institutions received $88,566,700 from all sources (including $69,339,300 EF) for labor market and performance-based raises, equivalent to a 5.75 percent increase on average. Approximately 21.7 percent of the total cost will come from student tuition.
The Legislature does not set pay amounts for schoolteachers or other school district and charter school employees. Local education agencies and their employees negotiate those compensation changes. Legislators provided $219.1 million for a 6.0 percent increase in the value of the Weighted Pupil Unit which is for public education costs generally – potentially including compensation. Legislators do set salaries for the Utah State Board of Education and Utah Schools for the Deaf and the Blind (USDB). In addition to the general compensation amounts for state employees identified above, Legislators appropriated $812,600 from the Education Fund to pay step and lane costs increases at USDB.
Contract Service Providers
In addition to the state and education employee compensation above, the Legislature made targeted investments in salary increases for contracted direct care service provider staff who help Utahns with a disability. These increases were spread across several social and human services agencies as follows:
Division of Services for People with Disabilities (DSPD) - Home and Community Based Services (HCBS) and Intermediate Care Facility Direct Staff Rate Increase
$4,995,200 One-time in FY 2022, $24,000,000 Ongoing in FY 2023 (H.B. 2, Item 85, S.B. 3, Item 63)
There are two components in this item: (1) A rate increase to raise the average starting wage for approximately 500 direct care staff that work in Intermediate Care Facilities for individuals with intellectual disabilities (ICF/ID) direct care from $12.26 to $16.00 per hour; and (2) Rate increase to raise the average starting wage for approximately 10,000 HCBS staff from $12.45 to $16.00 per hour.
Included with this funding is a prohibition on any of this funding being used for administration-related costs or to generate provider profits. (H.B. 2, Item 85)
While not defined as “compensation” in the labor market sense, lawmakers also appropriated $3,433,600 ongoing and $1,716,800 one-time GF/EF to DSPD for support to families who themselves care for loved ones with a disability. (H.B. 2, Item 63; H.B. 3, Item 85)
Division of Child and Family Services - Residential and Proctor Care Treatment Rate Increase
$2,496,100 ongoing in FY 2023 (H.B. 2, Item 87)
This item would increase selected family-based proctor care (or certified foster care) treatment rates an equivalent of 30 percent; selected residential rates an equivalent of 25 percent; selected respite care rates by 10 percent; and increase performance-based incentives for evidenced-based programs from 5 percent to 30 percent (this amounts to 3 percent of total payout for home placements to be used for outcome-based incentives).
Division of Juvenile Justice Services (JJS) - Residential and Proctor Care Treatment Rate Increase
$1,770,700 ongoing (H.B. 2, Item 1)
Funding would allow for increased provider rate increases for juvenile justice youth involved in: (1) Proctor Care (certified foster care); and (2) Residential Treatment. After a directed study by the Legislature on contract rates for service providers, the Department of Human Services (along with JJS) propose these rate increases to attract and retain these providers. They report that because they are below a competitive rate, they are losing providers and with more funding they could better place youth with proper higher quality providers.
Law Enforcement Detail
As shown in the table above, Legislators prioritized and funded directed increases for state law enforcement officers. During the summer of 2021 competing law enforcement agencies significantly increased funding for sworn officer positions and impacted the state’s ability to recruit and retain officers. The Legislature responded holistically with the following compensation increases for law enforcement across state agencies:
Attorney General’s Office – Criminal Investigators
$750,000 ongoing in FY 2023 (S.B. 8, Item 3)
Funding for this item is intended to increase salaries for investigators within the Attorney General’s Office Criminal Division like increases to other law enforcement within the state, specifically the Department of Public Safety and the Department of Corrections.
Department of Corrections - Certified Staff Pay Plan
$20,243,200 ongoing in FY 2023 (S.B. 8, Item 9; H.B. 3, Item 102)
Funding for this item is intended to increase salaries for Peace Officers Standards and Training (POST) certified staff within the Department of Corrections. This includes increases for correctional officers at both state prisons and Adult Probation and Parole Agents. This funding would enable the Department of Corrections to be more competitive with the surrounding counties in recruiting officers as well as retaining current certified staff. These increases would begin on July 1, 2022, but the Legislature also passed intent language allowing the Department to use internal savings to begin salary increases earlier.
Department of Natural Resources - Peace Officers Compensation
$700,000 ongoing (H.B. 3, Item 283)
Funding supports a pay plan to improve recruitment and retention efforts for sworn officers within the Department of Natural Resources and alleviate salary compression comparable to other state agencies such as the Department of Corrections and the Department of Public Safety.
Department of Public Safety – Crime Lab Personnel
$781,200 ongoing (S.B. 8, Item 26)
Funding supports forensic scientist positions at the State Crime Lab to improve recruitment and retention. These increases would better align the salary range to the market rate for these positions which the Department reports are between 10 percent and 23 percent below comparable crime lab scientist positions in neighboring states.
Department of Public Safety - Public Safety Sworn Officer Pay Plan Increase
$20,000,000 ongoing and $10,000,000 one-time (S.B. 8, Item 26; H.B. 6 Item 32)
Funding for this item supports the recruitment and retention of the Department of Public Safety (DPS) sworn officers and addresses recent parity issues with other competing law enforcement agencies. The starting salary for an entry level trooper was $22.35/hour and ranked 32nd among all relevant law enforcement entities (compared to $31.06/hour for the starting salary for the #1 ranked entity). With this increase, funding to about $30/hour would increase and put DPS sworn officers within the top 3 of law enforcement entities.
A Changing Landscape: the Utah Legislature Addresses Drought and Water Conservation
In response to the abnormally dry conditions statewide1, and armed with Federal funding from the American Rescue Plan Act (ARPA) as well as surplus revenues partially attributable to previous federal intervention, the Utah Legislature made generational investments in water conservation, rights, and planning efforts during the 2021 First Special Session and 2022 General Session.
2021 First Special Session
In May of 2021, the Executive Appropriations Subcommittee set aside $280 million from the ARPA for water infrastructure. During the 2021 First Special Session, the Legislature appropriated $100 million of that set aside to the Department of Natural Resources, with the following intent language:
The Legislature intends that the Division of Finance may not allocate any of the $100 million for Water Projects to the Department of Natural Resources until after the department presents a detailed written prioritization plan for the new funding to the Natural Resources, Agriculture, and Environmental Quality Appropriations Subcommittee by October 30, 2021 and to the Executive Appropriations Committee by November 30, 2021. Funds appropriated in this item may only be used in a manner that complies with the legal requirements and federal guidelines for use of funds appropriated under the American Rescue Plan Act of 2021.
The required prioritization plan, co-presented by the Department of Environmental Quality and Department of Agriculture and Food, proposed:
---$50 million for metering secondary water systems (2022 General Session H.B. 5, Item 28),
---$25 million for drinking water infrastructure (H.B. 5, Items 13 and 47),
---$20 million for agriculture water optimization projects (H.B. 5, Item 9), and
---$5 million for infrastructure adjustments in the Great Salt Lake to address salinity levels and to dredge the marina (H.B. 5, Item 28).
2022 General Session
At their next opportunity, legislators passed policy bills and appropriations that encourage or enable more efficient and effective water use across multiple use types. In so doing, they increased their use of ARPA funds for water projects from the initial $280 million to $450 million.
Water related policy bills passed include:
---H.B. 33, Instream Water Flow Amendments: makes instream flow a beneficial use of water.
---H.B. 37, State Water Policy Amendments: establishes aquifer storage and recharge as part of the state water policy.
---H.B. 39, State Construction Code Amendments: increases water efficiency requirements for plumbing fixtures in construction code.
---H.B. 282, Water Wise Landscaping Amendments: prohibits municipalities from banning water-wise landscaping.
---S.B. 89, Water Amendments: requires retail water suppliers and conservancy districts to adopt regional water conservation goals established by the Division of Water Resources.
Appropriations for water from the 2022 General Session include:
---H.B. 121, Water Conservation Modifications: $5.15 million one-time from the ARPA for incentives to switch to water-wise landscaping and staffing. (H.B. 3, Item 293)
---H.B. 242, Secondary Water Metering Amendments: $200 million one-time from ARPA to provide grants for up to 70% of the cost of secondary metering and $545,000 ongoing General Fund to hire personnel for the grant program. (H.B. 3, Item 64)
---H.B. 410, Great Salt Lake Watershed Enhancement: $40.0 million one-time from the General Fund in for the Division of Forestry, Fire, and State Lands to issue a grant for the Great Salt Lake Watershed Enhancement Program.2
---H.B. 429, Great Salt Lake Amendments: $5 million one-time General Fund for additional staff and resources to the Division of Water Resources to develop the Great Salt Lake Watershed Integrated Water Assessment. 2
---S.B. 110, Water as Part of General Plan: $300,000 one-time General Fund to provide municipalities with technical assistance to update their General Plans. 2
---Agricultural Water Optimization: $50 million one-time from the ARPA to fund projects that maintain or increase viable agriculture while minimizing negative impacts on water supply, water quality, and the environment. (S.B. 3, Item 98)
---ARPA Rural Drinking Water Projects: $25 million one-time from the ARPA to replace, upgrade, repair, or extend essential drinking water infrastructure across the state. (S.B. 3, Item 130)
---Infrastructure Investment and Jobs Act (IIJA) Drinking Water and Water Quality: $5.27 million one-time General Fund for the Drinking Water State Revolving Fund and $3.28 million one-time General Fund for Water Quality State Revolving Fund to provide the required state match, allowing the state to receive an estimated $144 million in total from the IIJA for these two purposes. (S.B. 3, Items 130 and 131)
---Groundwater and Wetland Management Resources: $140,300 ongoing General Fund for staff to focus on mapping groundwater storage and quality and updating wetlands spatial data. (H.B. 2, Item 172)
---Southern Utah - Recycle/Reuse: $15 million one-time from ARPA for a competitive grant program for wastewater reuse projects with priority for projects that mitigate the impacts of drought on rural communities and the agricultural sector. (H.B. 3, Item 360)
---Utah Lake Preservation: $30 million one-time from the ARPA for a competitive grant program to fund water quality improvements in Utah Lake and its watershed. (S.B. 3, Item 105)
Through these investments and policy initiatives, legislators hope to help the citizens of Utah manage persistent drought conditions.
Notes:
1. On April 21, 2022 Governor Cox issued Executive Order 2022-04, declaring a state of emergency in Utah due to drought. This order follows Executive Order 2021-03, which also established that the lack of rain fall, low snow pack, and dwindling reservoir storage warranted a drought emergency for the State in 2021. Both orders followed the United States Department of Agriculture (USDA) designating 28 or more of Utah’s counties as disaster areas due to drought conditions.
2. Bill carries its own appropriation.
How We Used Flexible Federal ARPA Dollars
In response to the COVID-19 pandemic, the Federal government provided states with three large stimulus packages partially aimed at mitigating impacts on the economy. The Coronavirus Aid, Relief, and Economic Security Act (CARES) and companion Families First Coronavirus Response Act passed in March of 2020 (roughly $13.6 billion for Utah), followed by the Consolidated Appropriations Act in December of 2020 (approximately $4.3 billion).
The third round of funding, the American Rescue Plan Act (ARPA), was passed in March 2021 and included roughly $9.2 billion in aid for Utah. Of that, ARPA provided the state with $1.38 billion in discretionary grants through the State and Local Fiscal Recovery Fund (SLFRF). In addition to the SLFRF, Utah received $136 million specifically to fund capital projects in the aptly named Capital Projects Fund (CPF).
SLFRF funds are authorized for several use categories, including:
- Activities related to COVID-19 response, mitigation, and prevention;
- Replenishment of state unemployment trust funds;
- Assistance to households;
- Assistance to small businesses and non-profits;
- Prevention and response to crime and support of public safety;
- Assistance to impacted industries other than tourism, travel, and hospitality, as long as there is a demonstrated impact;
- Assistance to populations, households, or geographic areas disproportionately impacted by the pandemic; and
- Water, sewer, and broadband infrastructure projects.
SLFRF funds can also be used to provide government services under ‘revenue replacement.’ If state “own source” revenue, as defined by the Census Bureau, falls below a calculated baseline, states can use SLFRF allocations to pay for regularly occurring state services. For more information on allowable uses, check out this post from September 2021.
In the 2021 1st Special Session, the Legislature appropriated $571.2 million (about 41 percent) of total flexible funds allocated under ARPA. During the 2022 General Session, legislators authorized the additional amounts shown in Table 1, below.
| 2022 General Session ARPA Funded Item | FY 2022 | FY 2023 | Total | Bill # |
| Agricultural Water Optimization | 50,000,000 | 50,000,000 | S.B. 3 | |
| ARPA Projects - Court Caseload | 3,000,000 | 3,000,000 | H.B. 2 | |
| ARPA Rural Drinking Water Projects | 25,000,000 | 25,000,000 | S.B. 3 | |
| Conservation (Secondary Water Metering) | 200,000,000 | 200,000,000 | H.B. 3 | |
| Criminal Justice Data Integration | 8,304,100 | 8,304,100 | H.B. 3 | |
| Deeply Affordable Housing | 55,000,000 | 55,000,000 | S.B. 238 | |
| Department of Insurance Technical Correction | 50,400 | 50,400 | S.B. 3 | |
| Emergency Communications Equipment - Enhanced Interoperability | (10,460,000) | 10,460,000 | H.B. 3 | |
| Event Service Industry Revitalization | 4,500,000 | 4,500,000 | S.B. 3 | |
| Homeless Resource Center Loan Repayment | 1,000,000 | 1,000,000 | H.B. 440 | |
| InUtah Pandemic Outreach | (1,000,000) | (1,000,000) | H.B. 3 | |
| Learn & Work In Utah Expansion | 15,000,000 | 15,000,000 | H.B. 2 | |
| Local Match Program | 25,000,000 | 25,000,000 | H.B. 2 | |
| Mental Health Support for Students | 3,000,000 | 3,000,000 | H.B. 2 | |
| Redevelopment Matching Grant for Affordable Housing | (5,000,000) | (5,000,000) | H.B. 3 | |
| Restricted Fund Decrease | (50,400) | (50,400) | H.B. 3 | |
| Southern Utah - Recycle/Reuse | 15,000,000 | 15,000,000 | H.B. 3 | |
| System Infrastructure, Optimization, & Enhancements | 37,376,600 | 37,376,600 | H.B. 3 | |
| Teacher Bonuses for Extra Assignments | 10,000,000 | 10,000,000 | S.B. 2 | |
| Temporary Utah County Refugee Housing | 300,000 | 300,000 | H.B. 3 | |
| UETN - K-12 Telehealth Equipment | 4,432,000 | 4,432,400 | S.B. 3 | |
| UETN - Network Infrastructure (ARPA) | 13,450,000 | 13,450,000 | S.B. 3 | |
| UETN - Telehealth Equipment Replacement | 1,413,400 | 1,413,000 | S.B. 3 | |
| Utah Lake Preservation | 30,000,000 | 30,000,000 | S.B. 3 | |
| Utah State University - Monument Valley | 5,000,000 | 5,000,000 | S.B. 3 | |
| Water Conservation Modifications | 5,150,000 | 5,150,000 | H.B. 3 | |
| West Weber Site Sewer Infrastructure | 5,000,000 | 5,000,000 | S.B. 3 | |
| Workforce Development Transition into Tech Careers | 300,000 | 300,000 | H.B. 3 | |
| Revenue Replacement | 332,773,900 | 332,773,900 | H.B. 3 | |
| 2022 General Session Appropriation Total | $747,985,900 | $96,014,100 | $844,000,000 |
Table 1*
Prior to making any of these appropriations, in May of 2021, the Executive Appropriations Committee divided SLFRF and capital project funds into “buckets”. The following table compares the original buckets to current appropriations as of the end of the 2022 General Session:
| May Proposal | Final Allocation | |
| Revenue Replacement, Unemployment Solvency, and Infrastructure | 630,000,000 | 445,773,900 |
| Public Health Response and Remediation | 205,000,000 | 121,500,000 |
| Impacted Economies | 65,000,000 | 141,800,000 |
| Water Infrastructure | 280,000,000 | 430,150,000 |
| Networking and Broadband | 175,000,000 | 121,672,000 |
| Education Remediation | 80,000,000 | 25,000,000 |
| Emergency Preparedness | 110,000,000 | 20,790,000 |
| Access to Justice | 35,000,000 | 23,304,100 |
| Housing and Homelessness | 70,000,000 | 85,300,000 |
| Adjustment to May Estimated Allocation | (136,147,000) | |
| Total Allocations | $1,513,853,000 | $1,415,290,000 |
| Balance | $98,563,000 |
Table 2
A portion of the funding in these buckets might qualify for Utah’s $136 million ARPA Capital Projects Fund allocation. The CPF is limited to broadband expansion or investment in facilities that enable work, education, and healthcare monitoring. While final approval of CPF projects must come from the U.S. Treasury, the Legislature submits that the projects listed below in Table 3 could qualify for CPF funding.
| Potential Capital Fund Allocation | Amount |
| UETN K-12 | 4,432,000 |
| UETN Network Infrastructure | 13,450,000 |
| UETN Telehealth Replacement | 1,413,000 |
| Go Utah Rural Broadband | 10,000,000 |
| Huntsman Mental Health | 90,000,000 |
| Navajo Mountain | 5,000,000 |
| Total | $124,295,000 |
Table 3
Just shy of $100 million in discretionary ARPA funding remains for legislators to appropriate. Whether these funds will be available under the more flexible SLFRF or limited to the CPF will depend upon how the U.S. Treasury rules on Utah’s proposed capital projects.
*Descriptions for each of the funding items in table 1 can be found at: https://cobi.utah.gov/2022/1/issues.
2021 Filing Delay Interferes with Revenue Comparisons
On Monday, May 16th, 2022, the Tax Commission released its monthly TC-23 Revenue Summary Report jointly with the monthly Revenue Snapshot produced by the Legislative Fiscal Analyst and Governor’s Office of Planning and Budget. Through April, collections to the General and Education funds exceeded forecasts by 25.1%, outpacing FY 2021 by 25.7%.
A significant driver of the change in growth between last month’s report and this latest report are collections to the Education Fund. Income taxes resumed their normal April 15th deadline this year. Last year, the filing deadline was delayed until May 15th, meaning that a year-over-year (YoY) comparison would be better drawn after next month’s collections.
General Fund performance continues to surpass expectations, posting a 19.8% growth rate over FY 2021. High performers for the General Fund include State Sales Tax (up 19.3% YoY) and Oil and Gas Severance Tax (515.7% growth). Current Oil and Gas Severance performance represents the highest collections for severance tax since 2015.
Persistent inflation explains some of the difference between the forecast and collections for the General and Education Funds. While a nearly 9% YoY inflation rate for the Intermountain-region drives increased revenue, it also increases state government costs and presents a risk to the economy. This and other economic headwinds including supply chain disruptions and stock market volatility, coupled with last year's filing deadline, make a moderation of collections likely in the near future.
The Transportation Fund posted a YoY growth rate of 3.7%, down from 4.9% last month. This may represent consumer reaction to lingering high prices at the pump; it's difficult to say how consumer behavior may change heading into the summer travel season.
The reports referenced in this post are available at the links below:
May Revenue Snapshot (FY 2022)
Tax Commission Revenue Summary (Period 10, FY 2022)
Revenue Publications Archive
May Executive Appropriations Committee Recap
During the May meeting of the Executive Appropriations Committee, the Office of the Legislative Fiscal Analyst released several annual products and reports; including the Budget of the State of Utah (Appropriations Report), Utah’s Budget Presentation, final Revenue Estimates and more, described in detail below.
Budget of the State of Utah
The Budget of the State of Utah (BOTSU) provides a historical record of actions budgetary actions taken by the legislature. This annual summary report of appropriations conducted during the general session (and special sessions conducted after the release of the previous report) is required under UAC 36‐12‐13(2)(j), which requires the Legislative Fiscal Analyst “to prepare, after each session of the Legislature, a summary showing the effect of the final legislative program on the financial condition of the state.” This year’s report, at 544 pages, is actually 20 pages shorter than the 2021 edition. In addition to aiding Legislative staff and state agencies in researching and understanding past appropriations, this report is used by rating agencies in determining the credit-worthiness of the state. Previous years reports are available on the legislature’s website under ‘budget publications.’
Fiscal Analyst Budget Slideshow
In aid in the fulfillment of UAC 36‐12‐13(2)(j), the Legislative Fiscal Analyst presents to the Executive Appropriations Committee on the changes made during the General Session, including fiscal policy changes, significant new appropriations, a fiscal health overview and more. The slideshow serves as a template that legislators can use for conversations with constituents. Should a legislator wish to modify the template for a specific event or subject, LFA will happily accommodate requests. This year’s presentation, along with previous years, are available on budget.utah.gov, under ‘all products.’
Interactive Budget Visualization
This dashboard is updated regularly, and provides legislators and the general public a dynamic way to learn more information about the state budget. This memo presented in EAC, provides users with a manual to navigate the tool in order to find a variety of information, from an agency’s total budget to the funding item number in an appropriations bill.
Economic Update
In November, February, and finally in May, Legislative Economists (along with other agencies) produce revenue estimates for the state. Last week, the Legislative Fiscal Analyst economics team presented the final estimates for FY 2022, which include tax policy changes from the General Session. The Division of Finance will be closing the books for the fiscal year, and along with information included in BOTSU, use this final revenue estimate to calculate the fiscal year surplus or deficit. This update is coupled with a robust presentation examining the economic picture looking forward for the state of Utah.
Archives of these reports are available on the ‘budget publications’ section of the legislature’s website: https://le.utah.gov/asp/lfa/lfareports.asp.
How Will the Infrastructure Investment and Jobs Act Impact Utah?
In November of last year, Congress passed, and the President signed, the bi-partisan Infrastructure Investment and Jobs Act (IIJA). Unlike other pandemic stimulus efforts (such as the CARES Act and ARPA), this bill does not include large discretionary pots of money for state and local governments. Instead, the IIJA returns to a more traditional mix of formula funding and competitive grants.
The bill authorizes a total of $1.2 trillion in transportation, broadband, water infrastructure, power and grid, western water, and environmental remediation funding. Most federal appropriations bills provide funding for a single fiscal year, however the IIJA provides appropriations for new programs over federal fiscal years 2022 through 2026. Of the $1.2 trillion, $550 billion is new funding, and the rest (roughly 55% of the total funding package) is for reauthorization of existing programs. The Office of the Legislative Fiscal Analyst created a brief outlining the programs funded and estimated amounts that Utah could receive.
The Governor’s Office of Planning and Budget (GOPB) has created an “IIJA Opportunity Tracker” dashboard on their website that tracks Utah’s approach and progress in applying for funding in the IIJA. The “Open Grants Opportunities” section contains a list of all the programs provided in the White House guidebook with information such as Utah State agency lead, due date, funding mechanism, and if state agency is pursuing this program. The “Open Grant Timeline” has a breakdown of programs with known deadline by category and quarter/month. As of the writing of this post, 19 programs (that Utah is eligible for) of the 51 total grant opportunities are open for application, according to GOPB. The dashboard’s “Grant Eligibility” feature also lists all the programs provided by the White House, and who are eligible for them. GOPB will continually update the dashboard as federal agencies release more information about programs.
While the IIJA doesn’t provide the same level of discretionary funding as CARES and ARPA, it does authorize a selection of new programs that will provide new funding to Utah over the next five years. The federal government is expected to issue guidance soon on how the new funding can be utilized. Some of the new programs include: the National Electric Vehicle Formula program; the Promoting Resilient Operations for Transformative, Efficient, and Cost-saving Transportation (PROTECT) Program; Carbon Reduction Program; Abandoned Mine Reclamation Fund; Preventing Outages and Enhancing the Resilience of the Electric Grid, Grants to States and Tribes; and Energy Efficiency Revolving Loan Fund Capitalization Program.
At present, broadband investment appears to be an area where policymakers may have some flexibility in choosing state investments. In anticipation of this, during the 2022 General Session, the Legislature passed Senate Bill 214, “Utah Broadband Center Advisory Commission.” This legislation created a commission to provide recommendations to the Utah Broadband Center for both the application and use of broadband infrastructure funds provided by the IIJA as well as on the development of a strategic plan for statewide broadband connectivity. The Utah Broadband Center Advisory Commission is comprised of four legislators, the executive director of GOPB, and four appointees from the Governor that meet certain criteria.
During the 2022 Session, legislators also anticipated state participation in certain water and transportation grants. They appropriated $5.27 million for in state matching funding for Drinking Water programs, unlocking the ability for the state to receive an estimated $114.86 million in Federal Funds. Additionally, the legislature provided $3.28 million in General Fund as a state match for the Water Quality IIJA offerings, enabling the state to be eligible to receive an estimated $29.2 million in FY 2022 and FY 2023 (the first two years of the IIJA investment timeline). The Legislature also provided $40 million for the state share of potential rail grants as part of the state’s $1.0 billion transportation investment package.
As federal agencies publish guidance on IIJA grants, LFA and GOPB will update legislators on their availability and use through the Federal Funds Review Process during regular Executive Appropriations Committee meetings.
Ensuring the Public Trust: a Summary of the Accountable Budget Process
Each year, more than 80 percent of Utah’s General and Education Fund (GF/EF) budget rolls-forward into the next budget year’s base. By legislative rule, in the 2023 General Session, as much as $9.3 billion of the $11.6 billion GF/EF total will carry forward from FY 2023 into FY 2024. While appropriators can change base budgets during the General Session, 45 days do not allow much time for detailed scrutiny; enter the Accountable Budget Process (ABP).
Joint Rule 3-2-501, as amended in H.J.R. 18 (2019 General Session), requires each appropriations subcommittee to “create an accountable process budget for approximately 20% of the budgets that fall within the subcommittee’s responsibilities”. In the definitions, "Accountable Process Budget" means a budget that is created by starting from zero and adding line items and programs recommended through an accountable budget process. This rule assures that each budget within a subcommittee’s purview is scrutinized from the ground up at least once every five years. It also empowers subcommittees to get a jump-start on budgeting during the Interim.
While similar to zero-based budgeting, an Accountable Process Budget considers more than just the dollars that make-up various line items and programs. This detailed review includes enabling legislation, agency organization, longer-term trends in sources of finance and categories of spending, and returns on investment. Legislative budget analysts pursue detailed questions about each program under review and distill the answers into recommendations for policymakers’ consideration. Results could be budget adjustments, further reviews or audits, updated reporting requirements, improved performance measures, reorganizations, and program eliminations, among other actions.
Legislators first implemented the ABP during the 2019 Interim. In 2020, the Legislature suspended J.R. 3-2-501 temporarily due to budget scrubbing that accompanied the initial onset of the pandemic. Subcommittees resumed the process in the 2021 Interim. Each appropriations subcommittee reported their plans for the 2022 ABP to the Executive Appropriations Committee in May.
June interim appropriations subcommittee meetings will provide the first of three rounds of reviewing agency budgets to comply with the ABP rule. The other two rounds will be in August and October. Accountable Process Budgets (that is, state agency budgets which have been subject to the Accountable Budget Process during the 2022 interim) will be voted upon during the October meetings. These polished budgets will then comprise Section 3 of each subcommittee’s base budget bill – separate from the more formulaic base budgets for other areas of government.
Income Tax Finally Comparable with Delayed Filings
On Wednesday, June 15th the Tax Commission released the TC-23 Revenue Summary Report for 11 months of FY 2022. This report, coupled with the Revenue Snapshot produced by the Office of the Legislative Fiscal Analyst and Governor’s Office of Planning and Budget indicated strong growth in collections to the General and Education Funds, and stable growth in taxes supporting the Transportation Fund.
General Fund collections were up 8.7% over FY 2021, with above-target performance from non-sales tax contributors such as severance tax. Oil and Gas Severance Tax is up 247% year-over-year (YoY), posting $75.7 million through the end of May. Sales Tax collections have moderated slightly since March, likely attributable to high inflation, a shift away from taxable goods and toward services that are less often taxed, and declining consumer confidence.
The Education Fund grew 14.8% YoY. Readers may recall the two income tax filing delays: in 2020, which were collected in early FY 2021; and 2021, which were collected a month late in May of 2021. This is the first time that we can compare FY 2022’s income tax to FY 2021 with relative clarity. Additionally, when adjusting for the 2020 filing delay that added a significant portion of FY 2020’s collections to FY 2021, the growth rate for the current fiscal year’s income tax was 31.3%.
This month’s report reflects collections that happened in April for sales and wages that took place in March. It may not be until Fiscal Year closeout that the impacts of fuel being over $5 per gallon are reflected. Economists warn of other headwinds that may impact collections through the end of the year including sustained high inflation, interest rate hikes, stock market performance, and recent sanctions in Europe for importing Russian oil.
The reports referenced in this post are available at the links below:
June Revenue Snapshot (FY 2022)
Tax Commission Revenue Summary (Period 11, FY 2022)
Revenue Publications Archive
What's Debt Got to Do With It? A Look at General Obligation Bonds
Last week, Legislative leaders alongside the Governor and others participated in a ribbon-cutting ceremony to unveil the new state prison. The new prison provides a notable example of the approach the state uses when financing a multi-year, multimillion-dollar project. For projects that are not expected to earn revenue sufficient to pay for the project, general obligation (GO) bonds are issued, which means that taxpayers are responsible for the principal and interest payments. Revenue bonds, on the other hand, may be issued for something like a state university football stadium, which could be expected to earn revenue with which to make payments toward the debt. The two GO bonds the state currently carries are for the construction of highways and the new prison; these can be monitored on the LFA Fiscal Health Dashboard. Bond payments are appropriated to the Debt Service line item in the Infrastructure and General Government appropriations subcommittee.
While GO bonds are a useful tool for financing large projects instead of using cash, they are also part of Utah's 'working rainy day fund' (one part of Utah’s Fiscal Toolkit). Working rainy day funds are unique from a traditional set of budgetary reserves, because they do not take the form of financial investments or a finite sum in an interest-bearing account. Instead, these are ongoing funds which are used to pay for one-time capital projects and can be replaced by borrowing in the future. In other words, legislators pay down debt and use ongoing appropriations (“cash”) for infrastructure when revenue is strong (like in the past few fiscal years). Then, when the economy slows, policymakers can move that cash flow out of capital projects and use it to fill budget holes, and instead borrow for needed infrastructure - typically in favorable terms. During the 2022 General Session, legislators appropriated $250 million one-time and $32 million ongoing from the General Fund as a set-aside for outstanding prison GO bond debt (see table). Setting aside most of the outstanding obligation up front creates debt capacity for future needs and frees up ongoing cash for other priorities.
| Fiscal Year | General Fund Appropriations | GO Bond Payment | Balance |
| 2023 | $ 282,000,000 | $71,756,850 | $ 210,243,150 |
| 2024 | $ 242,243,150 | $71,754,850 | $ 170,488,300 |
| 2025 | $ 202,488,300 | $71,753,350 | $ 130,734,950 |
| 2026 | $ 162,734,950 | $71,756,750 | $ 90,978,200 |
| 2027 | $ 122,978,200 | $71,754,750 | $ 51,223,450 |
| 2028 | $ 83,223,450 | $71,754,250 | $ 11,469,200 |
| 2029 | $ 43,469,200 | $6,885,000 | $ (36,584,200) |
The Utah Constitution caps borrowing at 1.5 percent of the value of taxable property in the State (see Article XIV, Section 1). Unless approved by two thirds of both chambers of the Legislature, UAC 63J-3-402 limits General Obligation debt to 45% of the annual state budget. According to the state auditor, Utah sits at roughly one-third of the $7.4 billion debt ceiling (as of June 30, 2021).
Revenues Strong but Tempering as Fiscal Year 2022 Comes to a Close
On Thursday, July 14th the Tax Commission released their preliminary figures for year-end, Fiscal Year (FY) 2022. The Revenue Summary (TC-23) report indicates that total tax revenues were up 14.7% over FY 2021. According to the Revenue Snapshot, legislative and executive branch economists indicate that these figures surpass expectations, while also highlighting that currently reported collections are not used to calculate a fiscal surplus (due to adjustments made during close out), and that several economic factors indicate a cooling macro-economic environment.
Activity in the extraction industry continues to be a highlight for general fund contributors, with Oil and Gas Severance revenue at $77.4 million, a collection level not seen since FY 2015, and a 250% increase over FY 2021. Despite consumer sentiment reaching the lowest level on record, Sales and Use tax posted a 17.5% growth through 12 months of the fiscal year, moderating from the 22.2% growth seen last fall.
Education Fund collections remain strong, representing a 27.6% increase when adjusting for tax filing delays that pushed 2020 income filings into FY 2021. These collections likely reflect conditions from 2021’s housing and stock markets, which contributed to increased capital gains (up 26.4% year-over-year). Changes in the stock market environment and increased interest rates from the Federal government are likely indicators that this exorbitant growth will slow in the coming year.
While Utah’s fiscal position is promising, larger factors present a unique budgeting challenge for policy makers, including persistent and increasing inflation, supply chain challenges associated with both the pandemic and the Russian invasion of Ukraine, tapering impact of fiscal stimulus, and other factors previously mentioned (including interest rates, housing market changes, and consumer confidence). Expectations from economists are that this cocktail of economic influences will be reflected in slowed collections in the coming fiscal year.
Reports referenced in this post are available at the links below:
Preliminary Yearend Revenue Snapshot (FY 2022)
Tax Commission Revenue Summary (Period 12, FY 2022)
Revenue Publications Archive
Joining Forces: the New Department of Health and Human Services
Earlier this month, the Utah Department of Health (UDOH) and Department of Human Services (DHS) officially became the Utah Department of Health and Human Services. During the 2021 General Session, the Legislature passed H.B. 365, State Agency Realignment, which directed the consolidation of the state’s two primary social service agencies.
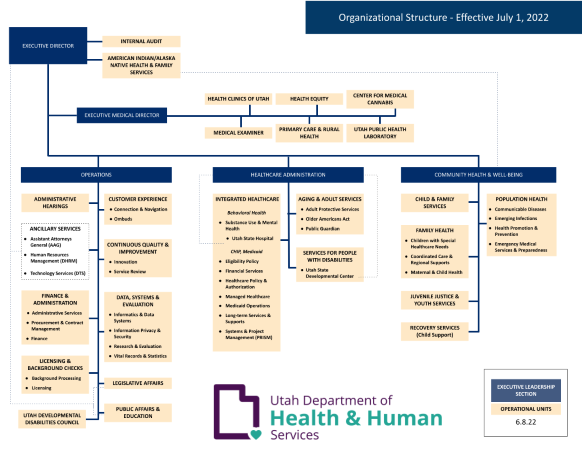
The Legislature proposed this merger to align funding and services within a single organization, as Human Services reports that nearly 60 percent of their clients are also served by programs or funding within Health. Interacting with multiple case managers and departments makes customer service challenging and creates redundancy. Some highlights of the organizational changes for the new Department include:
- ---Joining of behavioral and physical health in the Division of Integrated Healthcare;
- ---Streamlining of licensing and background screening services;
- ---Combining of all federal Medicaid long-term service and support programs within the Healthcare Administration Section, including disability services, aging services, and public guardians;
- ---High-quality customer service established and measured through a “no wrong door” approach in the new Customer Experience Division (found under Operations in the diagram above);
- ---Collocation of Family Health and other community programs with Child & Family Services; and
- ---A focus on leveraging data, research, and evaluation across the department to evaluate outcomes for individuals through the new Division of Data, Systems & Evaluation and the Center for Strategic Performance Management.
The only pieces of the two departments that were not combined are related to Medicaid eligibility. As Workforce Services handles eligibility for economic support, the agency consolidation bill moved Medicaid eligibility policy, Medicaid Eligibility and Quality Control (MEQC), and eligibility adjudications from the Department of Health to Workforce Services to connect families to a single entity for all state economic support services.
A visual of the merger between Human Services and Health. Medicaid Eligibility will be housed in Workforce Services.
Legislators appropriated $7.3 billion for FY 2023 to the combined entity – making it the single largest agency in the state. Of their total budget, $1.322 billion is from General and Education Funds. The merger brings together nearly 6,000 employees (over 1,600 from the Department of Health and almost 4,000 from the Department of Human Services) across 414 unique job classifications, residing in 164 locations.
Additional information on the merger can be found in the Department’s transition plan, while the new department’s website can be accessed at dhhs.utah.gov.
Informed Investments - A Renewed Emphasis on Optimization and Results
You've heard this one before. An agency or advocate comes to the Legislature for money:
- Advocate - "We need money."
- Legislature - "How much do you need?"
- Advocate - "How much do you have?"
Earlier this spring, the Legislature and Governor officially embarked on an effort to change this conversation. "Performance Reporting and Efficiency Requirements" (HB0326, 2021 GS) established May 1, 2022 as the date by which the Office of the Legislative Fiscal Analyst (LFA) and the Governor's Office of Planning and Budget (GOPB) must begin evaluating and improving efficiency in government processes. By that date, staff had been implementing this bill, and its companion "Joint Rules Resolution – Legislative Procedure Modifications" (HJR006, 2021 GS), for more than a year. Combined, the bills do three things:
- 1. Require state agencies to develop and report on key performance measures for state agency budgets included in appropriations acts;
- 2. Establish that each new funding item in a Session will have at least one specific performance measure or deliverable as well as a target, upon which LFA and GOPB will follow-up a year after passage;
- 3. Direct LFA and GOPB to select several process improvement projects each year and consult with agencies on how to apply management best-practices to optimize those processes. The bills then empower the Legislative Auditor General to revisit those improvements after-the-fact to be sure they are delivering as intended.
In the next few months, appropriators will hear more about line item performance measures in appropriations subcommittees. Staff will present a follow-up report on last year's funding items to the Executive Appropriations Committee in September, and subcommittees should hear it the following month. In December, LFA and GOPB will tell the Legislative Management Committee the results of their 2022 process improvement consultations at the Division of Technology Services, State Medical Examiner, and Department of Transportation.
By next General Session, we hope to the conversation goes more like this:
- Advocate - "We need money."
- Legislature - "What would it buy and how did you spend the money you already have?"
Inflation Reduction, What's Your Function?
On August 16, 2022, President Biden signed into law the Inflation Reduction Act (IRA). The bill invests $400 billion in energy security, climate change, drought resiliency, and extending certain Affordable Care Act provisions. The IRA is expected to generate over $700 billion in federal tax revenue from both corporate tax previsions and prescription drug pricing reform.
However, unlike recent significant federal spending bills that delivered large infusions of discretionary cash to state and local governments, the IRA largely provides diffuse benefits to prescribed populations and industries.
Medicare enrollees may see lower drug prices as a result of the IRA. The bill allows Medicare to negotiate directly on pharmaceutical drugs and caps the amount that Medicare enrollees are allowed to spend out-of-pocket on drug costs. Drug manufacturers will be required to issue rebates to Medicare if they raise the prices of their drugs faster than the rate of inflation. The IRA will also extend premium subsidies for individuals enrolled in health insurance plans through Affordable Care Act marketplaces.
Consumers, through state-administered rebate programs and tax credits, may save on electrification of home appliances, energy-efficient retrofits, and new and used electric vehicle purchases. Corporations may benefit (through tax credits, grants, and loans) in manufacturing renewable energy products and clean vehicles, as well from the construction of manufacturing facilities to support clean technology.
Finally, the bill includes smaller sums of money for a wide variety of state grants, including building code updates, open space acquisition, greenhouse gas reduction, mitigating air pollution, zero-emission vehicles, drought response for western states, state energy programs, and communities divided by past road construction. These grants will largely be competitive and will go through Utah’s normal federal funds review process administered by the Governor’s Office of Planning and Budget and the Office of the Legislative Fiscal Analyst.
On the federal revenue side, the IRA imposes a 15 percent minimum tax on corporations with profits of at least $1 billion dollars, and a 1 percent excise tax on stock buybacks. The legislation allocates significant funding to the Internal Revenue Service (IRS) to improve tax compliance by hiring additional staff and increasing audit activity, specifically to focus on filers earning more than $400,000 annually. The Utah State Tax Commission does not believe that these activities will have a direct or demonstrable effect on Utah state revenue.
Legislative economists do not expect the IRA to have a discernible effect on the Utah economy. While some individuals and corporations may benefit from provisions in the bill, all revenue generated in the bill will go to the federal government. While the bill has the potential to be disinflationary in the long run (in large part due to its tax provisions), any effects are not likely to be evident in the macroeconomy in the near term.
| IRA Revenue | |
| 15% Corporate Minimum Tax | $222 billion |
| Prescription Drug Pricing Reform | $265 billion |
| IRA Tax Enforcement | $124 billion |
| 1% Excise Tax on Stock Buybacks | $74 billion |
| Loss Limitation Extension | $52 billion |
| Total | $737 billion |
| IRA Expenditures | |
| Energy Security and Climate Change | $369 billion |
| Affordable Care Act Extension | $64 billion |
| Western Drought Resiliency | $4 billion |
| Total | $437 billion |
| IRA Net Effect Over 10 Years | $300 billion (Deficit Reduction) |
For more information, the National Conference of State Legislatures (NCSL) produced a detailed summary of the IRA available here.
If You Build It, They Will Come: Improved Security, Rehabilitation, and Economic Benefits of Prison Relocation
In July of 2022, Utah’s new state correctional facility opened in Salt Lake City. At a total price tag of just over $1 billion, the campus has 3,600 beds and a current population of 2,464. The facility conforms with the highest standards of modern prison reform, which emphasizes rehabilitation. The new prison has extensive space for programming and activities, allowing increased services to meet inmates’ needs. Compared to the old prison, the new site also utilizes a direct supervision model, which puts an officer on the floor with the inmates rather than in a control booth. This format is intended to promote interaction and help officers better identify needs of the inmates. The new prison also features large windows to bring in daylight, which can lead to improved mental health outcomes for both inmates and officers.
The Legislature’s decision to move the prison to Salt Lake City from the Draper location coincides with two major economic development opportunities for the state: the Point of the Mountain and the Utah Inland Port. Construction of the new prison brought public utility infrastructure to Salt Lake’s ‘Northwest Quadrant’ which has facilitated other development in the area, including Utah’s Inland Port and large vendors like Amazon. Development of the Northwest Quadrant is projected to generate $6.6 billion in economic activity and create over 36,000 jobs1. The old prison site, located on the fringe of the Silicon Slopes, will be redeveloped into a community called the Point—a multiuse region for housing, work, and retail, designed to be a fully-walkable community and future business/entertainment hub of Utah. It’s estimated that The Point will generate an additional $2.7 billion in economic benefit for the state and create more than 23,000 jobs between now and 20301.
Read more about the timeline for the prison’s relocation here.
Learn about the Utah Inland Port Authority and Point of the Mountain State Land Authority in this issue brief.
Notes:
1. Estimates included in the Master Plan for the Potential Relocation of the Draper Prison, courtesy of the Division of Facilities and Construction Management.
LFA Releases the 2022 Funding Item Follow Up Report
In each legislative session, the Legislature appropriates new funding for specific purposes to better serve residents of Utah. In 2021, the Legislature codified the practice of following up on these “funding items” and directed the Office of the Legislative Fiscal Analyst (LFA), the Governor’s Office of Planning and Budget (GOPB), and state agencies to collaborate on gathering follow-up information and developing quality performance measures.
The 2022 Funding Item Follow-Up Report includes information in several key areas:
--- Actual amount spent, compared to the appropriation
--- Month and year of full implementation
--- Performance measure, including target and result
--- Recommendation for action, if applicable, from LFA staff
This report consists of about 250 funding items originally funded in FY 2022, from either the 2021 or 2022 General Sessions. For certain long-term projects that will take multiple years to implement, LFA staff designated those funding items for inclusion in a future year of this report. LFA staff also excluded some funding items due to data quality issues. The total number of funding items eligible for reporting was roughly 375.
For the full report, see: 2022 Funding Item Follow-Up Report.
Below are three graphs summarizing the key data elements of the report:
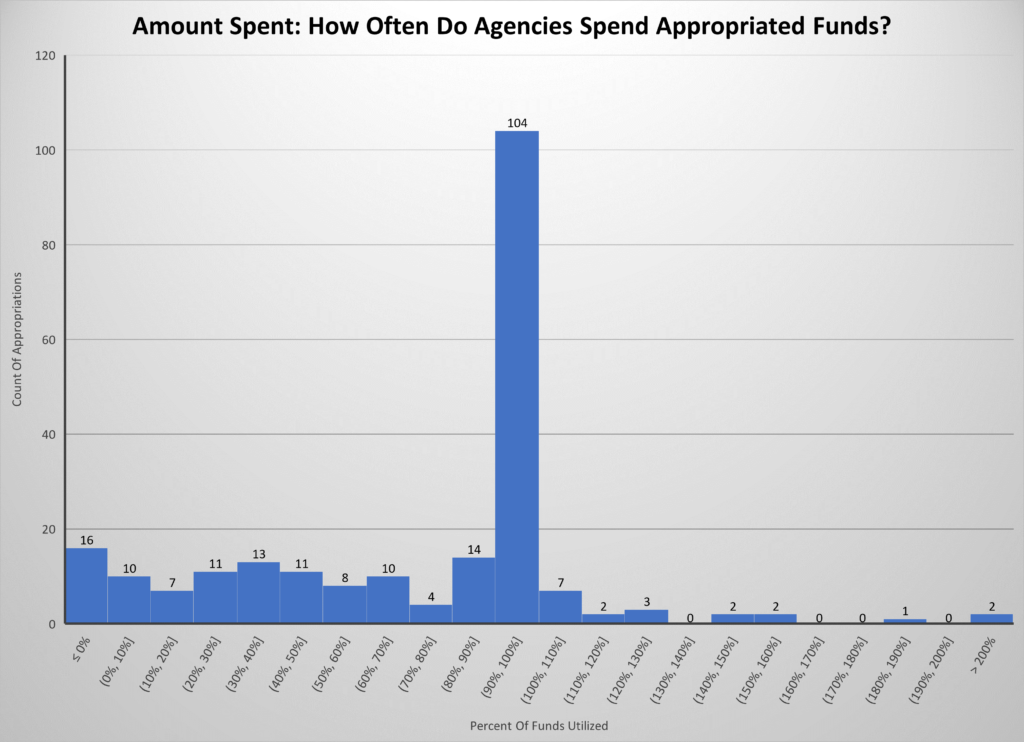
Of about 250 funding items in the report, agencies did not report actual spending data for 20 items.
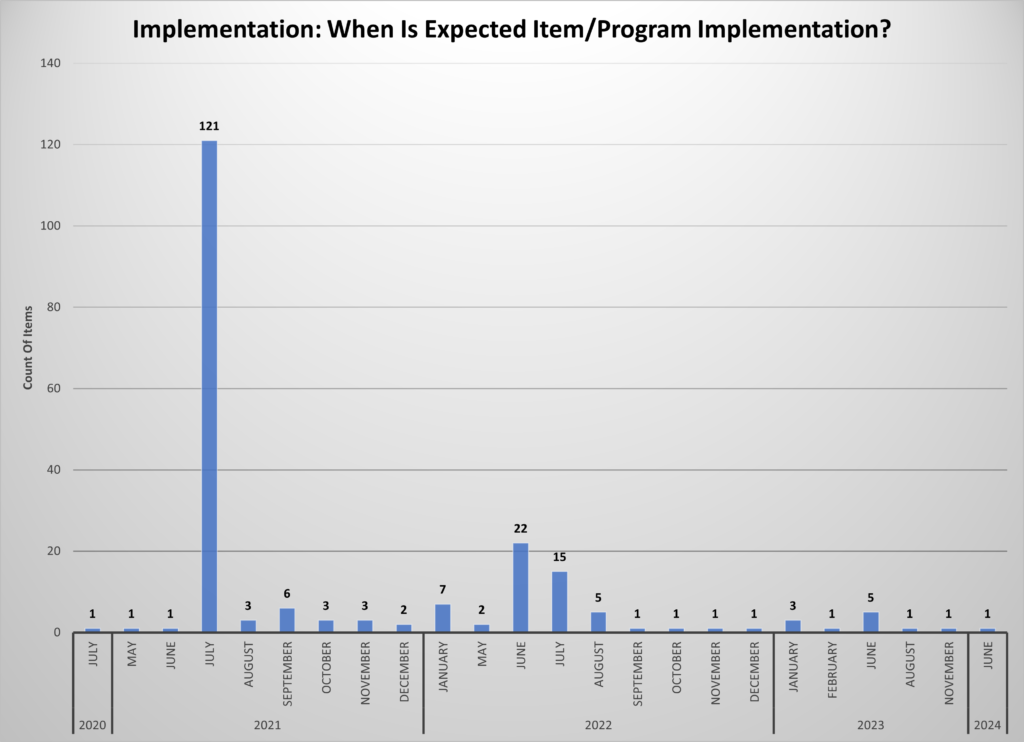
Of about 250 funding items in the report, agencies did not report implementation data for 39 items.
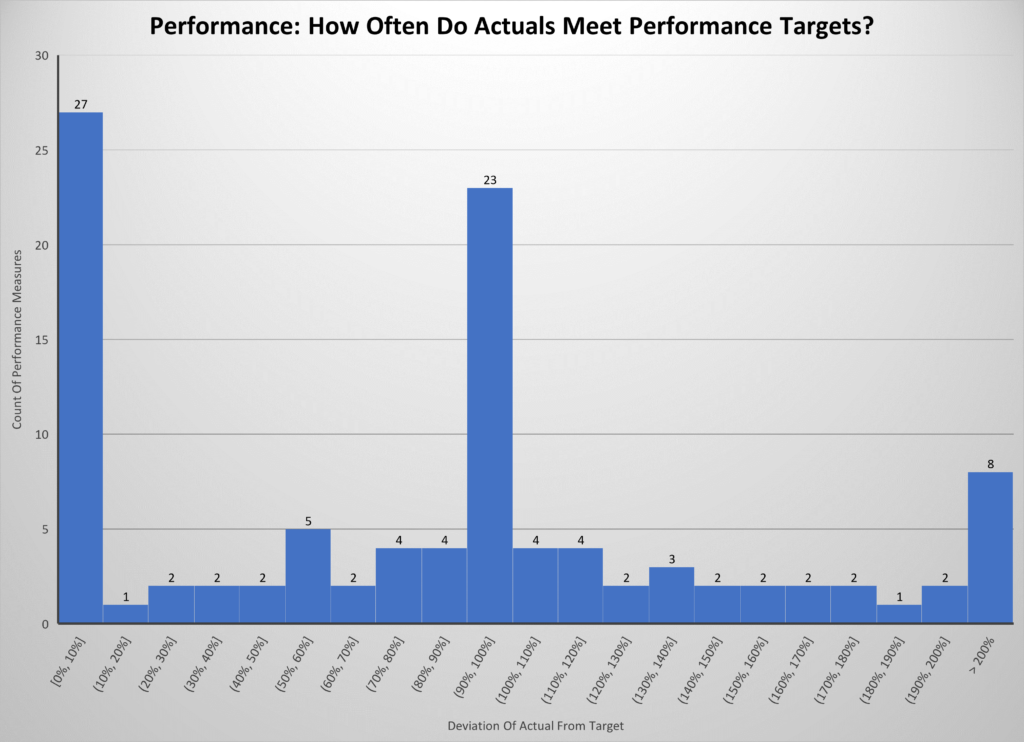
Of about 250 funding items in the report, agencies did not report performance results data or reported only qualitative (text-based) data for 143 items.
Note: The number of funding items in the graphs totals about 250, whereas the full report has about 220 items, because items in the report are aggregated by appropriations subcommittee.
Revitalized Cultural and Event Grant Programs Bestow FY 2023 Awards
During the 2022 General Session, the Legislature established a series of grant programs targeting arts, heritage, culture, events, and economic development. To accomplish their goals, policy makers revamped pass-through funding at the Department of Cultural and Community Engagement (CCE) and the Governor’s Office of Economic Opportunity (GOEO). For grants made by both departments, policymakers established two paths: a 'pass-through path' directed by legislative intent, and an 'application path' managed by the executive branch agencies. The grants in the pass-through path were directed through intent language in House Bill 2, “New Fiscal Year Supplemental Appropriations Act,” and House Bill 3, “Appropriations Adjustments.” The competitive grants were then set to begin after the end of the Fiscal Year (FY) on June 30, 2022. Competitive funds for each grants program were set as follows:
CCE Arts and Museums Competitive Grants Program - $6 million ongoing GF
CCE Capital Facilities Competitive Grants Program - $4 million one-time GF
CCE Heritage and Events Competitive Grants Program - $2 million ongoing GF
GOEO Economic Assistance Competitive Grants Program - $4.5 million ongoing GF
Now that FY 2023 has begun, all competitive grant programs in CCE and GOEO are at some stage of operation, ranging from the closing of applications to allocation and distribution of funds to successful applicants. Currently, the Capital Facilities Grants Program (which helps organizations with new construction, renovations, remodeling, and consulting for major Capital Projects) and the Economic Assistance Grants Program, (which provides funding to organizations, projects, and programs that create or retain high quality jobs or otherwise enhance the economy of the state of Utah) have closed their application pools and begun the process of ranking and determining successful applicants. Both the Arts and Museums Grant Program (which focuses on operational support for non-profit cultural and arts organizations within the state) and the Heritage and Events Grants Program (which focuses primarily on events that enhance the culture of Utah including festivals, heritage celebrations, and fairs) have finished their selection processes for recipients. The results of these two competitive grant programs are included in the tables below, with recipients listed in alphabetical order.
CCE Arts and Museums Competitive Grants Program: FY 2023 Recipients
CCE Capital Facilities Competitive Grants Program: FY 2023 Recipients
CCE Heritage and Events Competitive Grants Program: FY 2023 Recipients
GOEO Economic Assistance Competitive Grants Program: FY 2023 Recipients
Coming Together: An Update on Bringing Services to the Community of Westwater
During the 2021 General Session, the legislature appropriated $500,000 one-time from the General Fund to the Department of Community and Cultural Engagement for cost-share to assist with bringing services to the community of Westwater, including electricity, drinking water, and sewer from the next-door municipality of Blanding. Westwater is a small community comprised of approximately 29 residences that reside on 120 acres which is owned by the Navajo Tribe; however, the property does not fall inside the boundaries of the Navajo Reservation. Westwater residents have relied on solar power, wind, generators, and transporting water to their homes.
In January of 2022, the Drinking Water Board provided $798,000 in grant funds to the City of Blanding and the Navajo Tribal Utility Authority (NTUA) for engineering design of the upgrades and distribution systems necessary to supply drinking water to Westwater. These grant funds are available through the Hardship Grant Program, which is funded by interest payments and fees assessments on loans provided by the Drinking Water State Revolving Loan Fund.
During the 2022 General Session, that $500,000 appropriation was transferred to the Department of Environmental Quality, being the agency that regulates both waste and drinking water. Additionally, $3.5 million onetime from the American Rescue Plan Act was set aside to further the efforts of bringing services to the community of Westwater. This amount was a portion of the $25 million allotment the Executive Appropriations Committee reallocated for drinking water projects during their November 2021 meeting.
In July of 2022, an agreement was signed by the State of Utah, Navajo Nation, NTUA, and San Juan County which outlined responsibilities and financial obligations. NTUA will own and operate Westwater’s utilities and also oversee the construction and design of the new system; San Juan County will act as the fiscal agent between the State of Utah and Westwater; and finally, the City of Blanding will supply water and oversee the design and construction of upgrades to the existing system in Blanding.
As of September 1st, San Juan Water Conservancy District has approved the change application for the water rights to supply Westwater, and electrification of eligible homes in the community has been completed. Looking forward, the necessary upgrades for the City of Blanding include the need to drill an additional well, which is currently in the process of engineering design. A long-term agreement outlining distribution and cost will be signed by the City of Blanding and NTUA. Lastly, the new water distribution system for the community of Westwater is currently under design.
Putting the Fun in Funding: Recent Investments in Parks and Recreation
During the 2021 General Session, the Legislature passed H.B. 346, "Natural Resources Entities Amendments." Among other things, the legislation split the Division of Parks and Recreation into two separate line items: the Division of State Parks and the Division of Recreation.
Between the 2021 and 2022 General Sessions, the Legislature invested over $185 million one-time from General Fund surpluses to expand outdoor recreation opportunities for Utah’s citizens and visitors. This is the largest amount of state funds ever appropriated for State Parks and Outdoor Recreation. (By comparison, combined base budget for the two divisions from the General Fund is less than $5 million.)
The additional funding is being used to create new facilities, including building two new state parks (Utahraptor and Lost Creek), revamping the Antelope Island Visitor Center, and adding a new marina at Bear Lake. The Divisions are also using funds to improve existing infrastructure, such as creating or expanding campgrounds and trails, increasing parking capacity, enhancing day-use pavilions, and more. The following chart shows how the funding is being used, summarized into major categories.
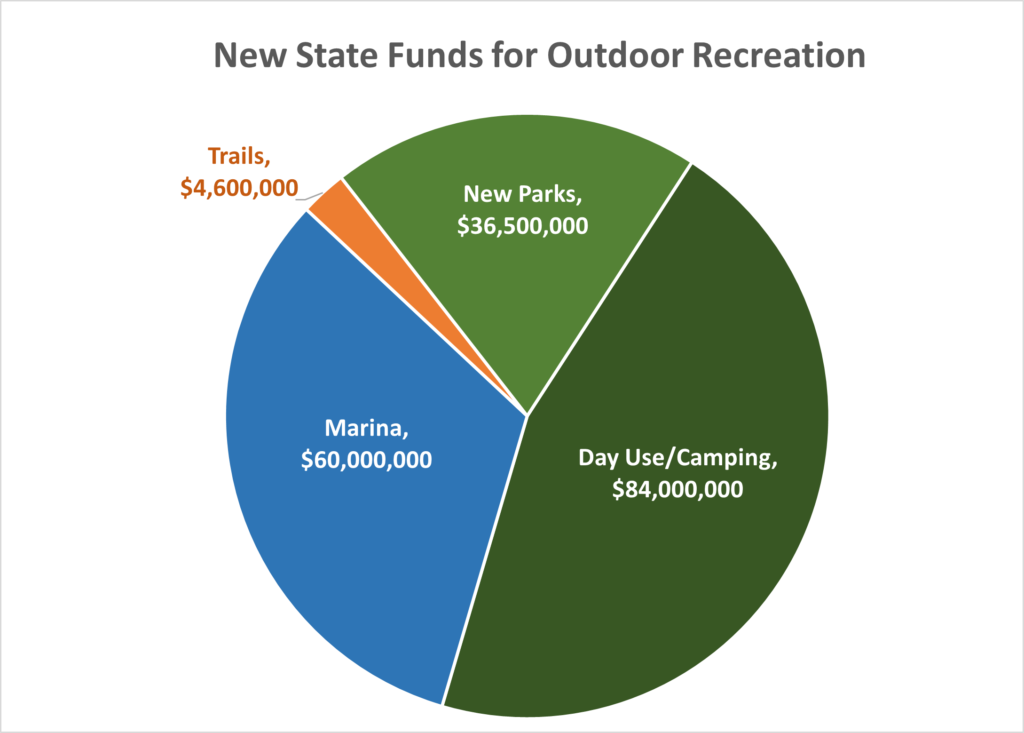
The following table includes an alphabetical list of the projects underway by the Divisions, along with a budget estimate for each project:
| Project Title | Cost ($) |
| Antelope Island Visitor Center Expansion | 12,000,000 |
| Antelope White Rock Bay Campground | 8,000,000 |
| Bear Lake Campground - Beach/Day Use Improvements (Rainbow Cove) | 5,000,000 |
| Bear Lake Marina | 60,000,000 |
| Bike Park Phase I | 450,000 |
| Bountiful Trails Master Plan | 500,000 |
| Cache Valley Nature Park and Accessible Recreation | 300,000 |
| Cedar Mountain Winter Recreation Project | 200,000 |
| Deer Creek Campground | 4,000,000 |
| Escalante Campground - Day Use Amenities | 3,000,000 |
| Goblin Valley Campground - Day Use Improvements and Expansion | 1,000,000 |
| Green River Campground and Lodging Expansion | 2,000,000 |
| Gunlock Campground - Day Use Area (Below Dam) | 4,500,000 |
| Helper River Restoration Phase VI | 500,000 |
| Jordan River Nature Center Phase II (Salt Lake County) | 250,000 |
| Jordanelle - Beach Expansion, Adding Parking, and Trail Access | 3,000,000 |
| Jordanelle - Campground and Day Use Area (Rock Cliff) | 12,000,000 |
| Kanab City Connector Trail - Trailhead | 50,000 |
| Lost Creek State Park - Campground, Day Use Area | 8,000,000 |
| Mt. Pleasant to Spring City Multi-use Trail - Phase II | 500,000 |
| Outdoor Access and Vertical Trails | 800,000 |
| Pine Valley Ranger District Trail Network - Spring Hollow Phase II | 450,000 |
| Bridal Veil Falls Surrounding Trail Development (Planning) | 400,000 |
| Provo River Parkway | 500,000 |
| Quail Creek Campground | 3,000,000 |
| Red Fleet - Campground and Day Use Area | 7,500,000 |
| Ron Wood Park, Bike and Skate Park Facility | 500,000 |
| Sand Hollow Campground - Add'l Day Use Area | 6,000,000 |
| Utah Lake State Park - Day Use Area | 3,000,000 |
| Utahraptor State Park - Design Engineering, Well Drilling, and Land Purchase | 28,500,000 |
| Willard Campground - Beach Area and Parking | 8,000,000 |
| Working with Utah County, Monument Sign Design | 1,200,000 |
| Total | 185,100,000 |
Haunting Inflation Brings Strong First Quarter Collections
In the first three periods of Fiscal Year (FY) 2023, collections have averaged 10.4% year-over-year (YoY) growth to state funds, exceeding consensus forecasts released in May. Inflation appears to have aided the General Fund in its 16.4 percent growth over the same period last year, while it may be negatively impacting the Transportation Fund.
Collections from Sales Tax totaled $881 million through the first quarter of the fiscal year, exceeding the range of projections by over $70 million. Oil and Gas Severance Tax (a General Fund contributor) continues to post strong numbers, even after having a banner FY 2022. In the first three months of the fiscal year, Oil and Gas Severance Tax is up 149% over last October’s collections.
The Income Tax Fund (previously known as the Education Fund) increased collections by 9.8 percent when compared to the first quarter of FY 2022. Corporate Tax shrank by 2.6% this year, dropping from $186 million in FY 2022, to $181 million this year. By comparison, this is still more than half of the total Corporate Tax collected in all FY 2020, and $44 million more than pre-pandemic collections at this point in the fiscal year.
The Transportation Fund totaled just 0.2% YoY growth, a product of growing Special Fuel Tax and lagging Motor Fuel Tax. It remains to be seen what impact these collections will have on Oil and Gas production in the coming year. In November, state economists will re-estimate revenue projections for the current fiscal year, and for the budget year (FY 2024). Consumer sentiment, persistent inflation, the Russia/Ukraine conflict, and other factors will all be considered when estimating revenue collections through June. These updated projections will guide appropriators in their work during the General Session.
The reports referenced in this post are available at the links below:
October (Q1) Revenue Snapshot (FY 2023)
Tax Commission Revenue Summary (Period 3, FY 2023)
Revenue Publications Archive
Drastic Times Call for Drastic Meters
In Utah, water providers use the term “secondary water” to refer to untreated, unfiltered water that is suitable to be used for residential landscaping and gardening. Historically, the state has not metered secondary connections, meaning that the amount of water applied to individual lawns and gardens was unknown and usage was only available on a system level based on water deliveries. In response to the ongoing drought, the Legislature has focused on the need to collect water data to improve the state’s understanding of how to best manage our hydrologic resources.
State Investments in Secondary Meters
In the 2019 General Session, the Legislature passed S.B. 52 “Secondary Water Requirements,” which allowed the Utah Board of Water Resources (Board) to annually issue up to $10 million in low interest loans to install secondary meters from the Water Resources Conservation and Development Fund.
During the 2021 General Session, S.B. 199 “Water Amendments” appropriated $2 million ongoing from the General Fund for grants to provide up to 50% cost share to install secondary meters on small systems in counties of the first and second class. During the 2021 First Special Session (and later by approval of the Executive Appropriations Committee), $50 million from the American Rescue Plan Act (ARPA) was appropriated to provide up to 70% cost share for secondary meter installation on existing systems1. During the 2022 General Session, H.B. 242 “Secondary Water Metering Amendments” appropriated $200 million from ARPA for grants that provide up to 70% of the cost to install meters on existing secondary systems, up to $10 million.
More than 75% of the ARPA funding for secondary meters has been authorized by the Board along with approximately $50 million in loan funds to 70 different applicants statewide. There remains $60.0 million in grant funding available from ARPA (70% cost share) and $2.75 million from the General Fund (50% cost share for certain systems). The Division expects to obligate remaining ARPA funds at their upcoming board meetings. This month the Division issued the first reimbursement for meters that have been installed with ARPA funds, meaning that most of the funded meters have yet to be installed.
Progress Towards Statewide Metering
| Total Appropriation | $250,000,000 |
| Allocated Currently | $190,000,000 |
| Appropriated, Not Yet Allocated | $60,000,000 |
It’s estimated that there are 260,000 secondary connections statewide and that 20% (or 52,000) of those connections were metered prior to 2022 (a small percentage of these were funded through loans made by the Board). The funding awarded by the Board to date is expected to meter an additional 114,000 secondary connections. Funding that has been appropriated to the Division which is not currently obligated is expected to meter an additional 35,000 connections.
| Total Meters in the State | 260,000 |
| Metered Before 2022 | 52,000 |
| Estimated - To be Metered with Current Funding | 149,000 |
| Estimated - Remaining Unmetered and Unfunded | 59,000 |
There are still approximately 59,000 connections statewide which are unmetered and will not be covered by currently appropriated grant funding. In the last two years, the cost of installing meters has also increased by about 25%. At a state cost share of $2,100 per meter, this would require an additional $124 million to meter systems statewide under the current grant program outlined in H.B. 242 (2022 General Session). UCA 73-10-34 institutes a $10 million loan cap annually for secondary metering projects, which has been achieved for FY 2023. As of September, the Water Resources Conservation and Development Fund has an unencumbered balance of approximately $31 million, however the Division expects this to be needed for other large water infrastructure projects, such as dam safety and irrigation pipelines.
Notes:
- See a complete list of investments in water infrastructure in this blog post from May 2022: https://budget.utah.gov/a-changing-landscape/.
Targeted Results: An Update on Compensation Increases for Corrections and Public Safety Departments
During the 2022 General Session, the Legislature appropriated targeted salary increases for Corrections Officers ($39.5 million ongoing) and the Department of Public Safety’s Sworn Officers ($20.0 million ongoing and $10.0 million one-time) to address recruitment and retention issues within these agencies. These challenges resemble a recent pattern of difficulty in attracting and keeping law enforcement officers nationwide, which is compounded by stiff competition within various state and local law enforcement agencies.
Corrections Officers
With the newly appropriated funds, the Department of Corrections (DOC) averaged a 27% compensation increase for all corrections officers implemented in two separate phases. In March, DOC implemented the first phase of compensation increases, equating to a 14% average salary boost for correctional officers, with the combined goals of combating high turnover and vacancy rates, while also to becoming more competitive with local law enforcement agencies. Per recent legislative policy changes, DOC opened eligibility for 19- and 20-year-olds to become corrections officers. During the 2022 August interim, the Legislature approved DOC repurposing certain operational savings from the new prison to provide a second phase of salary increases, equaling about a 13% average bump in salaries for correctional officers. This second adjustment brought salaries into the top quartile for sworn officers in law enforcement agencies statewide. While DOC still reports high vacancies for officers and saw record-setting turnover in FY 2022, the department is seeing recent improvement due to increased funding. Since this most recent pay increase, monthly applicants to the Department increased to 134 in August, and 171 in September, up from lows of 61 in June and 58 in July. Additionally, officers leaving the agency dropped to 5 in August and 9 in September, down from a high of 21 in May.
The current vacancy rate still requires mandatory overtime from officers throughout state to provide the minimum level of staffing required to operate the new Utah State Correctional Facility. However, these two recent salary adjustments have helped slow both the vacancy and turnover rates, and the department projects this pattern will continue through the end of the year. Looking forward, DOC is focused on using a strategic approach to recruiting and retaining officers and is carefully considering what resources may be needed going forward.
Department of Public Safety Sworn Officers
The Department of Public Safety (DPS) used the one-time funding through the last quarter FY 2022 for retention incentives until ongoing compensation increases were fully implemented in FY 2023. New funding allowed DPS to increase the hourly rate for sworn officers from $22.35 - $33.00/hour to $30.00 - $43.00/hour. Prior to the change, DPS’ entry level (or lowest end of their salary range) was the 32nd highest in the state among competing law enforcement agencies. After the targeted salary increase, DPS now ranks 2nd highest for entry level salaries of sworn officers. Similarly, the top tier of the DPS salary is 3rd highest in the state among similar law enforcement positions.
DPS has seen improvement in both recruitment and retention for these positions after implementing this salary adjustment. DPS reports that they will have hired 60 new officers by the end of the calendar year, compared to just 32 officers in all of CY 2021. This represents an 82% increase on average over the previous two fiscal years. DPS also reports success in retention rates. Their projected number of employment separations for sworn officers in CY 2022 is 34, down 40% from 2021. While DPS is monitoring the impacts of outside factors on staffing (including actions by competing agencies and inflation), they are increasingly optimistic about their ability to attract and retain high quality talent for this key law enforcement function.
Winter is Coming… Yet Revenue Remains Hot
On Thursday, November 17th, the Tax Commission released their Revenue Summary report through the first four months of the fiscal year (FY), in conjunction with the Monthly Revenue Snapshot produced by the Legislative Fiscal Analyst and Governor’s Office of Planning and Budget. From July to October of FY 2023, collections to the General Fund are up 14.5 percent over FY 2022. Similarly, the Income Tax Fund posted 15.4 percent year-over-year (YoY) growth. Collections to the General Fund have been primarily driven by Sales Tax while the Income Tax Fund has been spurred by its namesake revenue source.
Earlier this week, the Executive Appropriations Committee (EAC) received the preliminary Financial Highlights report for FY 2022 from the Division of Finance. The report details surpluses for the fiscal year ending June 30th, 2022. As opposed to a forecasted surplus, this report details cash already collected, which can be appropriated during the 2023 General Session for new projects, programs, or set aside in preparation for an economic slowdown. (When revenues are above the 10-year trend, Legislative economists advise treating them as one time, to avoid appropriating them for ongoing expenses.) Also included in the report are YoY revenue changes by source. Standouts include Federal Mineral Lease revenue (up 54.2%), Oil, Gas and Mining Severance Taxes (up 153.1%), and Corporate Income Tax (up 27.4%). The Financial Highlights details the amount of funding left over from the budget appropriated by the legislature; the state ended the year 14.6% under budget statewide.
December’s EAC agenda will include stress testing results and adoption of updated revenue estimates for FY 2023 and FY 2024. By statute, stress testing is part of a three-year cycle of long-term fiscal sustainability analysis. Stress testing examines the economy for a 5-year period, determining to what extent the state of Utah is prepared to handle an economic downturns varying in degrees of severity. Consensus revenue estimates will include budgets for one-time and ongoing revenue, which legislators can use during the 2023 General Session.
The reports referenced in this post are available at the links below:
November Revenue Snapshot (FY 2023)
Tax Commission Revenue Summary (Period 4, FY 2023)
Revenue Snapshot Yearend FY 2022
TC-23 (Yearend, FY 2022)
Revenue Publications Archive
The Build Up: Learn about Capital Development Requests
Prioritization of new building requests for both state agencies and higher education institutions starts long before a General Session begins. Lists of ranked building project requests are created by both the Division of Facilities Construction and Management (DFCM) and the State Board of Higher Education (SBHE) for consideration by the Governor and the Legislature during a legislative session.
First, state agencies submit capital development project requests and feasibility studies to DFCM for its review and prioritization (a process defined in administrative rule). DFCM does not prioritize building requests for buildings financed with restricted funds like revenue bonds or fees and fines.
Meanwhile, higher education institutions submit building requests to the SBHE for prioritization and approval. The list proposed by SBHE is divided into ‘Dedicated Projects,’ ‘Non-Dedicated Projects,’ and ‘Land Banks.’ Dedicated Projects are those that the institution can fund within ongoing appropriations to the Higher Education and Technical Colleges Capital Projects Funds, while Non-Dedicated Projects require additional funding from the Legislature. Land Banks are parcels of land that a state agency or institution of higher education would like to purchase for a future purpose. If a state agency or an institution of higher education purchases land as a land bank, it must later receive approval from the Legislature for any capital development project on that land.
Like state agencies, SBHE is required under UCA 63A-5b-403 to submit its approved list to DFCM. The division makes recommendations to the Legislature for Dedicated Projects, and weighs in on the priorities for SBHE’s Non-Dedicated project list.
Both DFCM and SBHE submit their lists of priorities to the Legislature for consideration. These requests are typically presented in the Infrastructure and General Government Appropriations Subcommittee. The subcommittee advances the lists, revised to reflect their legislative priorities, to the Executive Appropriations Committee for consideration. Finally, the refined selection of capital development projects is subject to a final vote by the Legislature as a whole.
2022 Building Projects
During the 2022 General Session, the Legislature appropriated $344.9 million one-time from the Income Tax Fund for the following higher education capital development (building) projects:
- Davis Technical College - Campus Renovations ($20.4 million)
- Mountainland Technical College - Payson Campus Building ($47.9 million);
- Southern Utah University - Music Center Renovation ($19.5 million);
- Southern Utah University – Flood Repair and Prevention ($9.2 million);
- Tooele Technical College - Campus Building Expansion ($24.7 million);
- University of Utah School of Medicine ($60.0 million);
- Utah Tech University - General Classroom Building ($56.1 million);
- Utah Valley University - Engineering Building ($80.0 million); and
- Weber State David O. McKay Education Building Renovation ($27.1 million).
Additionally, the Legislature appropriated $5.0 million one-time federal American Rescue Plan Act (ARPA) funds for Utah State University - Monument Valley.
The Legislature also funded a number of projects for state agencies, appropriating $167.6 million one-time from the General Fund for the following:
- Capitol Hill North Building Rebuild ($68.0 million);
- Fleet, Surplus, and DFCM Relocation ($8.9 million);
- Forestry, Fire, and Land Lone Peak Facility Relocation ($16.6 million);
- Salt Lake Veterans Nursing Home Replacement ($21.3 million);
- Sixth District Court - Manti Courthouse ($14.2 million); and
- Utah State Development Center Comprehensive Therapy Building ($38.6 million).
Due to inflation concerns, the Legislature also included intent language in Items 226 and 227 of House Bill 2 that directed the Division of Facilities Construction and Management (DFCM) to delay project certain implementation, not using appropriated funds for the following projects until March 1, 2023:
- Utah Valley University - Engineering Building;
- Utah Tech University - General Classroom Building;
- Southern Utah University - Music Center Renovation;
- Utah State Development Center Comprehensive Therapy Building; and
- Sixth District Court - Manti Courthouse.
The intent language also directed DFCM to submit a detailed plan to the Executive Appropriations Committee by June 1, 2022, for the implementation timing of capital development projects approved. That report was presented to EAC on May 17, 2022. Looking forward to the 2023 General Session, SBHE and DFCM have each approved lists of new projects which will be considered by the Legislature.
The reports referenced in this report are available at the following links:
DFCM Priority List
USHE Priority List
Getting Schooled on Education Funding
In the fall of 2022, the Common Data Committee for Public Education Appropriations gathered to determine enrollment estimates for FY 2024 (2023-2024 School Year) and weighted pupil units (WPUs). The goal of the informal committee is to agree to a consensus projection of future year growth and spending that balances the various models used by the Legislature, Utah State Board of Education (USBE), and Governor’s Office. In its forecasting, the group came to a consensus estimate for statewide student enrollment (including public and charter schools) of 677,144, a 0.22% increase over enrollment data for FY 2023. Consequently, WPUs are estimated to see a slight increase to a total of 914,842, 0.9% higher than the previous year.
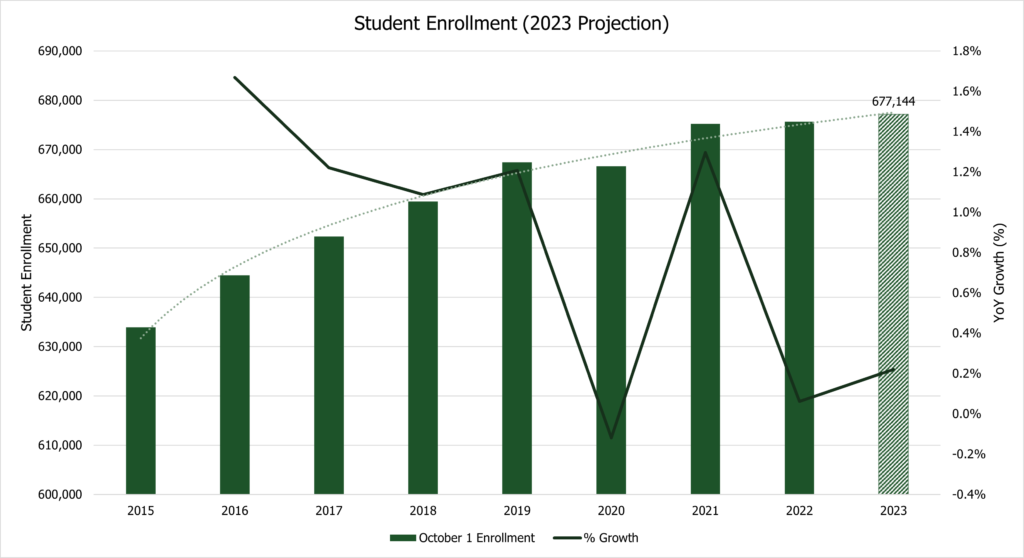
The Weighted Pupil Unit (WPU) forms the foundation of Utah’s public education funding system. The WPU represents the common factor used to determine the “costs of a program on a uniform basis” and to distribute program funding to the local education agencies (LEAs). Twelve programs established by the Legislature use the WPU in cost and distribution formulas. These programs are grouped together in the Basic School Program (BSP) which is part of the Minimum School Program (MSP). Indicative of the name, WPUs are determined based on both the total number and composition of students enrolled (53-F-2-302). The cost of these programs is determined by multiplying the number of WPUs by the WPU Value established by the Legislature.
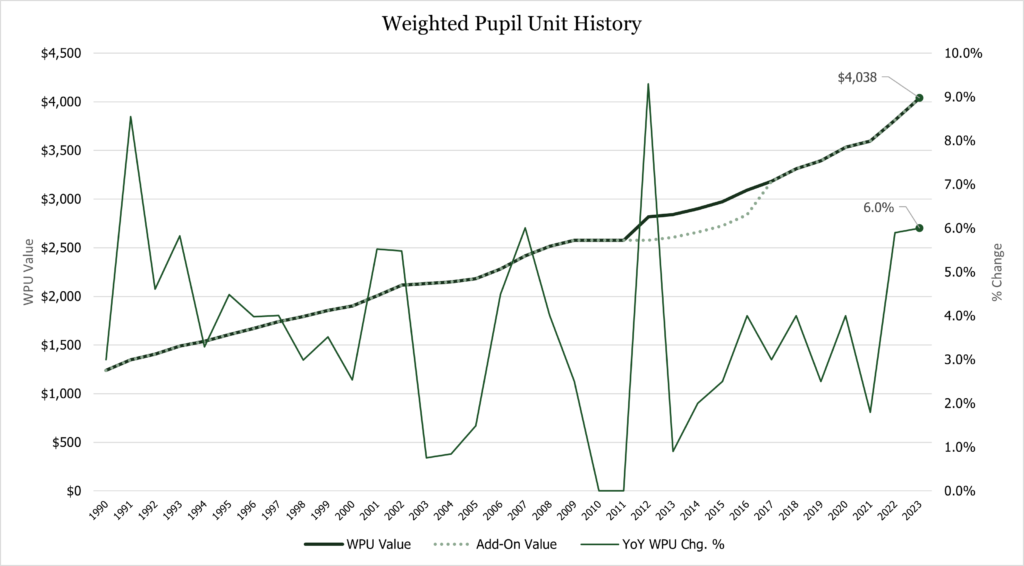
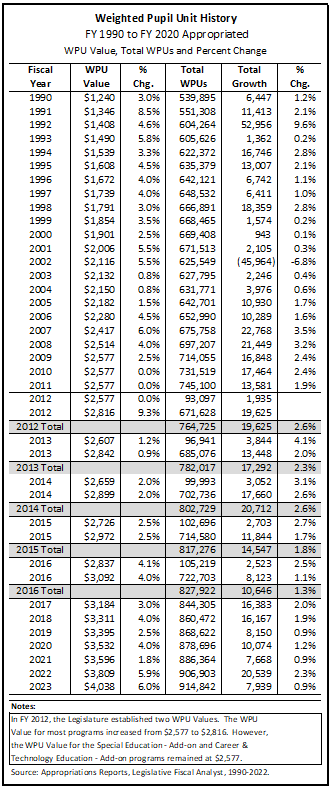
On March 24, 2022, Governor Cox signed Senate Bill 2, “Public Education Budget Amendments” into law, approving an increase in the value of the WPU to $4,038 for FY 2023, a 6% increase over the FY 2022. For FY 2024, funding for the Basic School Program would be the product of the Common Data Committee’s consensus forecast and this new WPU Value, resulting in an estimated cost of nearly $3.7 billion for the Basic School Program (an increase of 6.9% over current year estimates). The Basic School Program is only a portion of the overall Minimum School Program, which itself is only a fraction of the state’s overall public education spending.
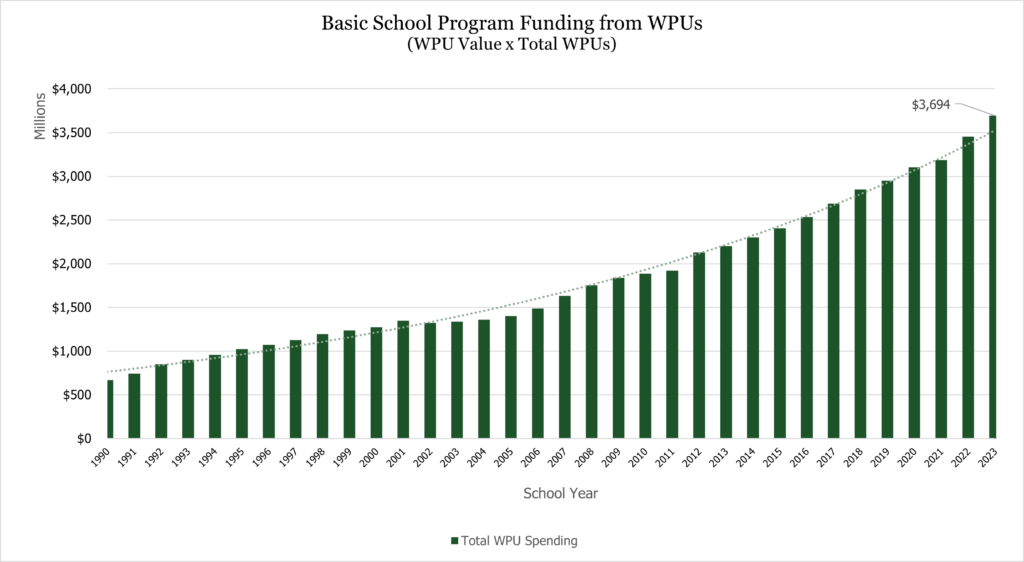
It should be noted that the estimated expenses for the programs which use WPU calculations are just that, estimates. These numbers often do not reflect the total dollar amount which the legislature will appropriate, as discretionary increases can be made on top of baseline estimates. Basic School Program funding has grown over the last few years despite stagnate student enrollment, largely due to annual increases in the WPU Value. It’s expected that this trend will continue, with Basic School Program expenditures topping $4 billion in the next three years (though not all of this funding is provided by the state).
The State of Utah and local school districts share the cost of educating Utah's school children through a combination of locally generated property tax revenues and state appropriations using WPUs. Formulas distributing MSP revenues are designed to provide ‘reasonably equal educational opportunities’ among school districts and charter schools. This funding equalization is done on a weighted pupil basis to partially accommodate the revenue differences between school districts with higher and lower property values. Each school district is required by statute to pay a portion of the cost of providing a basic education for their students through the Basic Property Tax Levy. The revenue generated by the levy in each school district is applied to the total estimated cost of Basic School Programs, with any cost not covered by property tax revenue being paid by the state. The local cost share for Basic School Programs has increased over time. In FY 2023, Local Education Revenue accounted for just over 18% of total revenues for the BSP, whereas in 2015 local funding accounted for only 12% of the BSP program revenues. While education expenditures for the Basic and Minimum School Programs have grown, the impact on the Income Tax Fund has been partially offset by increases in local property taxes.
As local levies grow (both nominally and in their share in funding for public education) and enrollment slows, the state’s cost burden per student is expected to change. Combined with other cost savings measures and formula modifications, this shift in education funding is expected to free up just over $18 million in ongoing funds for FY 2024, helping to offset other changes to the state’s public education budget. While it’s difficult to say if this growth in local revenue/cost share will continue to increase (depending on external economic conditions), the annual work done by the Common Data Committee for Public Education Appropriations helps legislators maximize available education funding.
The Numbers Are In: LFA Releases the 2022 Medicaid Consensus Forecast
Background
Medicaid is a federal and state program that pays for medical services for low-income, disabled, and elderly individuals. In order to qualify, individuals must meet specific eligibility requirements. Officially, Medicaid is an "optional" program, meaning it’s one that a state can elect to offer. However, if a state chooses to offer Medicaid, then it must adhere to strict federal regulations. Utah (having chosen to offer Medicaid) established an “entitlement program” for qualified individuals, so that anyone who meets specific eligibility criteria is entitled to Medicaid services. An accurate forecast is essential to adequately funding that entitlement. The Medicaid consensus forecast team includes the Legislative Fiscal Analyst, Governor’s Office of Planning and Budget, and the Department of Health and Human Services. The team uses employment, labor force participation, population, and other demographic and economic indicators to forecast enrollment. Total cost for the program includes enrollment as well as the per-member per-month (PMPM) cost, which is the monthly payment received by enrolled Medicaid members. The team compares models and outputs in an attempt to produce the most well-rounded forecast which incorporates the best available information.
In FY 2021, nearly three in every ten General Fund dollars went to Medicaid ($634 million), yet this still represented only a fraction of the nearly $3.9 billion that was used for Medicaid statewide. (Utah’s General Fund contribution in FY 2021 was lower than usual due to increased federal funding associated with the pandemic). From 2000 to 2012, Utah’s Medicaid enrollment grew from 121,300 clients to 252,600 clients, an increase of 108%. Over the same period, the percentage of the State’s population on Medicaid grew from 5.4% to 8.8%. According to statute, a portion of Medicaid expenditures are included in the Social Services base budget (S.B. 7), including growth rates for Accountable Care Organization contracts and behavior health services (UCA 26-18-405.5), and mandated Medicaid program changes (UCA 26-18-405).
Current Budget Cycle Cost Estimates
Since the last consensus forecast, estimates for FY 2023 have decreased ($42.0) million, while FY 2024 estimates have increased by $21.1 million one-time and $44.3 ongoing for Medicaid and the Children’s Health Insurance Program (CHIP). A variety of factors contributed to these changes:
--- the extended Federal requirement to keep everyone on Medicaid is projected to through February 2023;
--- the one-time federal match for rate enhancement is forecasted to last through March 2023 which will provide one-time reductions of ($147.2) million in FY 2023;
--- Medicaid caseload is forecasted to increase by 9,600 or 2.8% in FY 2023 and decrease by (65,000) or (18.2%) in FY 2024, (this assumes 12 months to review all cases after the conclusion of the maintenance of effort requirement which begins in February 2023);
--- the increased payments to the federal government for Clawback (the state contribution for outpatient prescription drugs) and Medicare buy-in; and
--- Utah’s statutorily required 2% inflationary rate increases for accountable care organizations and behavioral health plans.
The team estimates that the Medicaid Expansion Fund’s ending fund balance will increase by $63.5 million due to:
--- forecasted caseload increases of 26,300 or 23.1% in FY 2023 and decreases of (7,700) or (5.5%) in FY 2024;
--- federal approval of housing supportive services; and
--- the statutorily-required 2% inflationary rate increases for accountable care organizations and behavioral health plans.
For more information on this year’s Medicaid Consensus Forecast, please see this issue brief prepared by the Office Legislative Fiscal Analyst.
LFA Releases Governor's Budget Summary
Last week, Governor Spencer Cox released his budget recommendations for FY 2023 - FY 2024, announcing Tax and Education items on December 9th with the full budget following on December 10th. While Utah's constitution makes budgeting a plenary power of the Legislature, past legislators delegated power to the Governor to recommend budget changes through the Budgetary Procedures Act, as long as the recommendations assume current tax law.
The Office of the Legislative Fiscal Analyst has prepared a summary of the Governor's requests, which can be found here. The Executive Appropriations Committee began budgeting in earnest during their meeting on December 13th.
Revenues Still Merry, and Fiscal Reserves Appear Bright
On December 15th, 2022 the Tax Commission released their revenue summary through the first five months of the fiscal year. Along with that summary, the Legislative Fiscal Analyst and Governor’s Office of Planning and Budget released their monthly Revenue Snapshot, detailing collections in comparison to the consensus forecast. Through November, revenues to all state funds totaled 8.2 percent growth over the same period in the previous fiscal year; with General Fund showing the most momentum at 14.9 percent year-over-year (YoY) growth and the Transportation Fund showing the least, posting a 0.3 percent YoY increase.
It’s important to consider that December’s report captures collections from November, for sales and wages that took place in October. Further, depending on the tax type, collections can lag economic activity by up to four months. So, while it seems that everyone’s Christmas tree has been up since November 1st, it may be spring before the full impact of the holiday season is reflected in state collections.
Top performers for the General Fund include Sales Tax (up 12.1 percent over FY 2022) and Oil and Gas Severance Tax (up 107.1 percent YoY). Mirroring last month, the Income Tax Fund/Uniform School Fund has been primarily driven by individual income tax collections (up 9.7 percent over last December), while Corporate income tax has slowed when compared to FY 2022’s above trend collections (-29.3 percent YoY).
On Tuesday, the Executive Appropriations Committee recognized the state’s FY 2022 General and Income Tax budget surplus of $1.25 billion, and adopted revenue estimates of $11.6 billion for FY 2023 (an increase of 1.1 percent YoY) and $11.8 billion for FY 2024 (an increase of 1.3 percent YoY). The most recent Revenue Snapshot reflects these updated estimates and associated revenue targets. Legislative Economists also presented the results of their annual Stress Testing Analysis, examining budget reserves. Stress testing occurs in a three year cycle, with the goal of helping Legislators determine the state’s financial risk under various economic scenarios. A complete look at stress testing will be published on budget.utah.gov later this month.
The reports referenced in this post are available at the links below:
December Revenue Snapshot (FY 2023)
Tax Commission Revenue Summary (Period 5, FY 2023)
Revenue Publications Archive
New Performance Measurement and Efficiency Improvement Initiative Wraps Up Its First Year
In the 2021 General Session, the Legislature passed H.B. 326, “Performance Reporting and Efficiency Requirements,” which codified and expanded performance measurement and created an efficiency improvement process for operations at state agencies. The legislation was novel in that it requires extensive collaboration across the legislative and executive branches of government, including between the Office of the Legislative Fiscal Analyst, the Governor’s Office of Planning and Budget, the Office of the Legislative Auditor General (OLAG), and state agencies. In accordance with the legislation, each December LFA and GOPB report to the Governor and the Legislative Management Committee on the status of the efficiency improvement process and any recommended changes.
LFA and GOPB provided the December 2022 report on December 13th. More information about the vision and operation of the program is available in the December 2021 and May 2022 reports.
Performance Measurement
In 2022, LFA and GOPB significantly expanded the functionality of the performance measure database. Agencies report all measure results into the database and analysts from LFA and GOPB review and approve measures, or work with agencies to improve those measures. Currently the database houses over 1,500 measures. The results of measures can currently be found in two places:
- Compendium of Budget Information (COBI) – for ongoing measures that are set by the Legislature, tied to line items in the budget, and ideally focused on outcomes
- Funding Item Follow-Up Report - FY 2022 – for new allocations of funding for a new or existing program appropriated by the Legislature in a legislative session, which cost over $10,000 from state funds
Efficiency Improvement Process
In May 2022, LFA and GOPB began the first efficiency evaluations of state agencies. This year’s evaluations included:
- Division of Technology Services (DTS): Procurement of Low-Cost IT Products (October 2022)
- Office of the Medical Examiner (OME): Final Reports of Examination (December 2022)
- Utah Department of Transportation (UDOT): Transportation Technician Training (February 2023)
Per statute, these reports are directed to the agency, who is then responsible for implementing the recommendations. OLAG is directed to provide follow up and oversight of implementation.
Other Initiatives and Recognition
This performance and efficiency initiatives work has been recognized by national organizations for Utah’s innovative approach to performance measurement and efficiency improvement. With the support of the Speaker, President, and Governor, Utah joined the Governing for Results Network, an initiative of the National Conference of State Legislatures and the Council of State Governments. The network has been keen to work with LFA and GOPB, particularly because the collaboration between the legislative and executive branches is quite unique. Additionally, for the fourth year in a row, Utah was recognized by Results for America as a leading state for the use of data and evidence. This year, Results for America recognized Utah’s increased capacity to use performance measurement to affect good government.
Too Blessed to be Stressed: Utah Fares Well in 2023 Budget Stress Test
In 2016, the Utah Office of the Legislative Fiscal Analyst (LFA) and the Governor’s Office of Planning and Budget (GOPB) conducted their first stress testing exercise, following the passage of the Dodd-Frank Act of 2010 during the Great Recession that required banks to conduct stress tests. The utility of this exercise resulted in the passage of 2018’s H.B. 452, “Legislative Fiscal Analyst Amendments,” which required LFA to conduct long-term fiscal sustainability analyses in a three year cycle, where year one is revenue volatility reporting, year two is long term budgeting, and year three is stress testing. Thus, Utah became the first state to adapt financial-industry stress testing to state budgets and require such a process regularly. Utah has since conducted two additional tests: the first statutorily required test in 2019, as well as a special stress test in 2020 following the onset of the COVID-19 pandemic. This year, LFA is required to conduct budget stress testing.
State budget stress tests measure the impacts of various hypothetical economic scenarios on long-term revenue and budget estimates. those scenarios are then compared to a more realistic baseline to measure potential value at risk, which includes the potential increased expenditures and lost revenues due to a downturn. Finally, the stress tests inventory budget ‘buffers,’ evaluating whether the buffers are adequate. In this latest stress test, economists conclude that Utah's easy-to-access and moderately-easy-to-access budget contingencies alone are nearly enough to cover the maximum estimated five-year value at risk of $5.6 billion. This means that, without dipping into buffers that are difficult to access, legislators could continue business as usual even in a severe recession.
Process
The stress test consists of three components:
- analysis of Utah’s primary revenue sources, including sales and use tax, individual income tax, corporate income tax, and all other state revenue sources;
- analysis of select expenditure categories that are either primary budget drivers and/or countercyclical to the economy, including public education, higher education, Medicaid, and retirement; and
- a cataloguing of available budget buffers, should Utah experience an economic downturn. The revenue and expenditure analyses are conducted under various economic scenarios, to determine the effects of such scenarios on the state budget.
Economists also calculate available budget reserves and buffers, categorized by ease of access, over a five-year time horizon, to determine whether the state has enough reserves to account for lost revenue and increased expenditures in case of economic downturn. This year’s analysis includes additional buffers that have been added in the years since the 2019 stress test, including General Fund infrastructure banks, the Public Education Economic Stabilization Restricted Account, and the Outdoor Recreation Infrastructure Account. It should be noted that, regardless of the way in which a reserve is classified in terms of ease of access, some reserves (such as the Medicaid Expansion Fund or the Public Education Economic Stabilization Restricted Account) have statutorily specified allowable uses. In this stress test, economists compared three economic scenarios to a baseline: a moderate recession, a severe recession, and a stagflation scenario, which assumes prolonged high inflation and high unemployment. The key points of the scenarios are highlighted in the table below.
| Economic Scenario | Peak-to-Trough Decline in Output | Peak Unemployment | Return to Full Employment |
| Baseline | N/A | 2.6% | Imminent |
| Moderate Recession | 1.4% | 4.4% | Q1 - 2025 |
| Severe Recession | 4.2% | 6.3% | 2032 |
| Stagflation | 3.3% | 6.5% | Indefinite |
Results
On the revenue side, economists estimate that between $409 million and $3.7 billion in total General Fund and Income Tax Fund revenue is at risk over the next five fiscal years in the case of economic downturn.
| Economic Scenario | Five-Year Revenue Value at Risk |
| Moderate Recession | $409,100,000 |
| Severe Recession | $3,727,800,000 |
| Stagflation | $2,204,600,000 |
On the expenditure side, economists estimate that between $1.5 billion and $1.9 billion in total increased expenditures across public education, higher education, Medicaid, and retirement contributions is at risk over the next five fiscal years in case of economic downturn.
| Economic Scenario | Five-Year Expenditure Value at Risk |
| Moderate Recession | $1,496,200,000 |
| Severe Recession | $1,901,300,000 |
| Stagflation | $1,685,500,000 |
When combining both revenues and expenditures at risk over five years, economists estimate a total value at risk of between $1.9 billion and $5.6 billion.
| Economic Scenario | Five-Year Total Value at Risk |
| Moderate Recession | $1,905,300,000 |
| Severe Recession | $5,629,100,000 |
| Stagflation | $3,890,100,0000 |
Economists estimate that the state has a maximum total of approximately $9.2 billion in budget buffers available for use over the next five years in case of an economic downturn.
| Ease of Accessibility | Five-Year Total |
| Easy to Access | $2,722,200,000 |
| Moderately Easy to Access | $2,670,600,000 |
| Somewhat Difficult to Access | $2,545,000,000 |
| Difficult to Access | $1,276,500,000 |
| Total | $9,214,000,000 |
Conclusion
Economists conclude that, even in a worst-case recession scenario, the state’s five-year total of budget reserves, including one-time funds and ongoing funds across a five-year time horizon, would be more than sufficient to cover the five-year maximum value at risk.
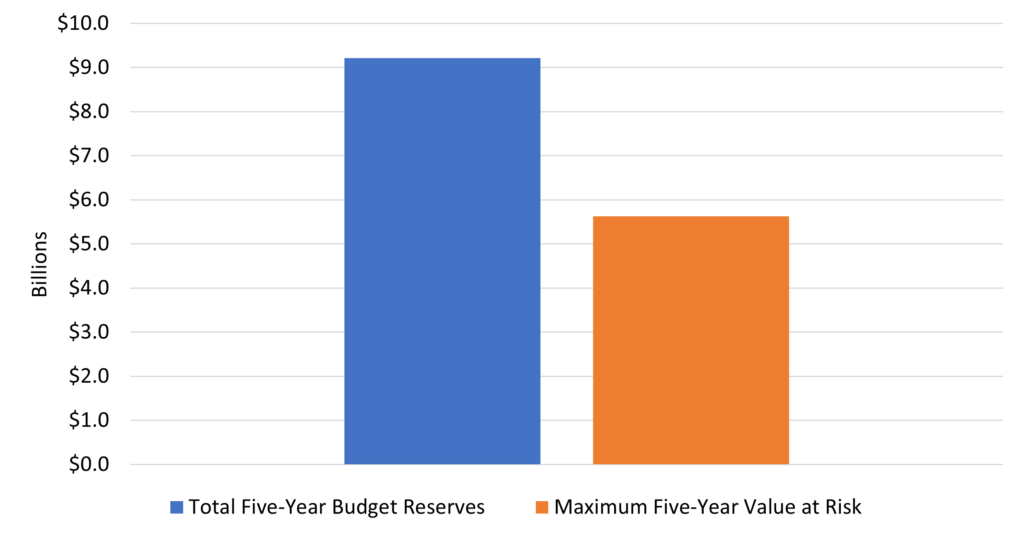
The report presented to EAC is available at the following link: 2023 Budget Stress Testing
Getting Schooled Pt. 2: the Minimum School Program and Property Taxes
Multiple factors contribute to the amount of property tax a homeowner pays, including the Minimum Basic Tax Rate. The Minimum Basic Tax Rate is the amount of property tax charged statewide to pay for the Minimum School Program (refresh your public education budget knowledge here). While the Basic Rate (and recent increases) factors into property tax obligation, other elements also play a role, including:
- a legislative policy change related to property tax notices;
- dramatic increases in the taxable value of residential property across the state;
- the relative value of one property type compared to others (residential vs business or industry); and,
- the Basic Rate is a statewide property tax for public education, so it considers the value of property across the state and shifts the tax obligation among school districts based on the value of property in each.
During the 2018 General Session, the Legislature passed "House Bill 293, “Tax Rebalancing Revisions" which implemented a 5-year “freeze” to the Basic Rate, holding it at 0.0016 per dollar of taxable value. In normal circumstances, a property tax rate will decrease over time as the taxable value of property in an area increases. Holding the rate generates additional revenue off the increasing value. Through state formulas for public education, this allowed for increased property tax revenue to contribute to paying for certain legislative initiatives. A summary presentation on "Tax Rebalancing for Utah Education" explains this in more detail.
While the freeze to the Basic Rate was largely blamed for the increased property tax bills experienced by Utah homeowners in 2022, the freeze represents only a small factor in the overall story. For a detailed look at the relationship between property taxes and public education funding, check out this brief prepared by the Office of the Legislative Fiscal Analyst: Property Tax and the Basic Rate.
Revenues Get a Jump on General Session
The Utah State Tax Commission published its revenue summary for the first half of FY 2023 on the first day of Legislative General Session. As shown in the accompanying Revenue Snapshot from the Office of the Legislative Fiscal Analyst (LFA) and Governor's Office of Planning and Budget (GOPB), General and Income Tax Fund collections remain strong. In fact, income tax payments jumped dramatically in December as tax planners took advantage of new laws on payment of state and local taxes for pass-through entities.
Through December, the total collections across all state funds came in at a 16.7% year-over-year (YoY) growth rate compared to the same period in the previous fiscal year. Contributing to this, Income Tax Fund collections showed high growth at 21.7% YoY, while Transportation Fund collections were again relatively moderate, at just 3.6% YoY.
Individual Income Tax collections this month were unusually high at 25.3% YoY. This high growth was largely the result of payments that have, in the past, come in during March and April shifting into December as a result of changes to how pass-through entities may file their returns. The effect of this timing shift was large this month, but the overall impact will diminish over the remainder of the fiscal year.
The reports referenced in this post are available at the links below:
January Revenue Snapshot (FY 23)
Tax Commission Revenue Summary (Period 6, FY 2023)
Revenue Publications Archive
The ABCs of RFAs
Requests for Appropriation – commonly referred to as RFAs – are a method for legislators to obtain funding for a public project, or to expand an existing program within state government. This method of funding is not to be confused with the funding associated with passed bills, as RFAs are not designed to support the implementation of legislation1. Funding for legislation is carried out through the fiscal note process, though these two pathways to obtaining government funding weren’t always separate.
Prior to the RFA system, attorneys drafted scores of bills that included nothing more than an appropriation - no policy changed, no statute amended. These bills would make their way through the standing committee process, inevitably taking up valuable committee and floor time. Legislators created the two distinct funding paths to allow for a more efficient General Session. By separating the budget items from policies which may or may not have a fiscal impact, the Legislature focused the budgeting and policy making processes, respectively, allowing more to be accomplished in 45 fast-paced days.
By rule, RFAs are due on the 11th day of the General Session at 12pm (this year, that’s Friday, January 27th). After RFAs are submitted, legislative rules direct the chairs of the Executive Appropriations Committee (EAC) to assign an RFA to an appropriations subcommittee, and the chair of that subcommittee to place it on an agenda. During the third week of the session, RFAs (along with all other budget requests) will be prioritized in order of preference by each subcommittee and presented to EAC. EAC’s review is the final step before items are added to an appropriations act.
Although there are no restrictions on which agencies legislators can request to receive the appropriated funding, there are laws for how funding is implemented. The legislature cannot appropriate funding to entities outside the state, meaning that all RFAs go through executive branch agencies, who are required to follow state procurement laws. State law also requires any recipient of state funds to adhere to specific reporting requirements unless the entity was selected through a competitive process.
A portion of the RFA application process focuses on the ‘success’ of the item, and that data helps legislative staff comply with the provisions outlined in H.B. 326 from the 2021 General Session. For more information on the legislature’s performance measurement process, check out this post.
As of publication, 63 RFAs have been approved and assigned to a subcommittee, for a total request of over $720 million one-time and more than $92 million ongoing.
____________________________________________________________________________
- Joint Rule 3-2-701 states that the LFA shall automatically generate a request for appropriation to fund the fiscal impact of legislation if the legislation has an expenditure impact of $1,000,000 or more from the General Fund or the Income Tax Fund, and LFA knows the fiscal impact of the legislation before the 11th day of session at 12pm.
Walking the Line: What Value is the State Getting for its Investments?
It’s budget season. Each year during the General Session, the Legislature appropriates the state budget – but the budget isn’t just money to be spent. The budget is policymakers’ investment in services and other priorities of the state, on behalf of the taxpayers.
What value is the state getting for its investments? The Legislature changed the budget conversation from spending to value with the passage of H.B. 326, “Performance Reporting and Efficiency Requirements” in the 2021 General Session. The bill codified and expanded performance measurement, and required legislative, Governor’s Office, and state agency staff to work together to develop and report performance measures.
One way the state quantifies value is through “line item” performance measures. The Legislature sets these measures each year in the appropriations acts and associates them with line items in the budget. These measures are tracked over time and ideally focused on outcomes, so that the Legislature can assess whether a state agency is meeting the set goals for each portion of the budget.
Where are line item performance measures published? LFA published the FY 2022 results in the Compendium of Budget Information (COBI). Use the Navigate button at the top left to choose a line item from the budget, then click to the Performance tab.
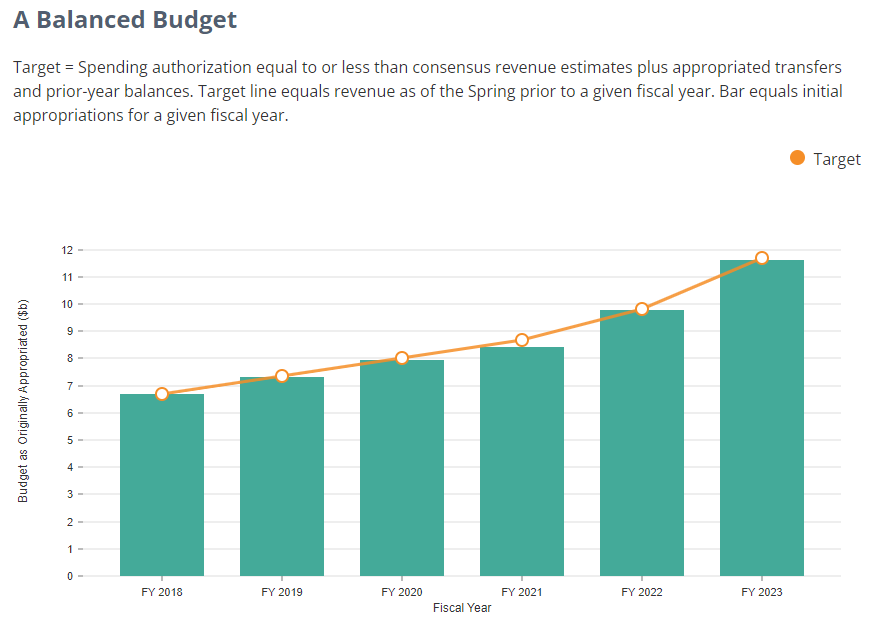
Performance measures do not provide all the information that policymakers need, even about a state agency’s progress toward their goals, but they do provide important insight. Imagine a personal health tracker – it measures a person’s heart rate and could identify if their heart rate is elevated, but it cannot explain why their heart rate is elevated or what action the person should take in the short or longer term. A personal health tracker also only measures certain parts of a complex system. Similarly, performance measures can inform the conversation about how effective the state’s investments have been, by bringing objective data and highlighting areas that may need attention. Policymakers then need to ask questions to fully assess the value of those previous investments, and to consider what future actions to take to move the state closer to its goals.
What questions help assess value? Check out the New Program Questions, which are applicable to many kinds of budget considerations.
What other performance data are available? See the Funding Item Follow-Up Report - FY 2022 for information about new allocations of funding that Legislature provided during the 2021 and 2022 General Sessions.
How do you want to learn about the results of the state’s investments? Whether you’re a policymaker or other interested party, take this 2-question survey to help LFA staff develop and disseminate performance measurement information and products. Thank you!
Hidden in Plain (Web)sites
Each year, appropriators spend most of the Legislative General Session jockeying for available General and Income Tax Fund revenue. That’s understandable, given that the General and Income Tax Funds are the most versatile funds that can be appropriated. These funds are based on broad taxes and spending from them is, for the most part, discretionary.
However, General and Income Tax appropriations represented only about one-third of the State’s $26 billion budget in FY 2022. Federal funds accounted for another third, leaving the last part comprised of local property taxes, dedicated credits, and about $5 billion in restricted accounts and funds... this ‘last third’ is full of surprises!
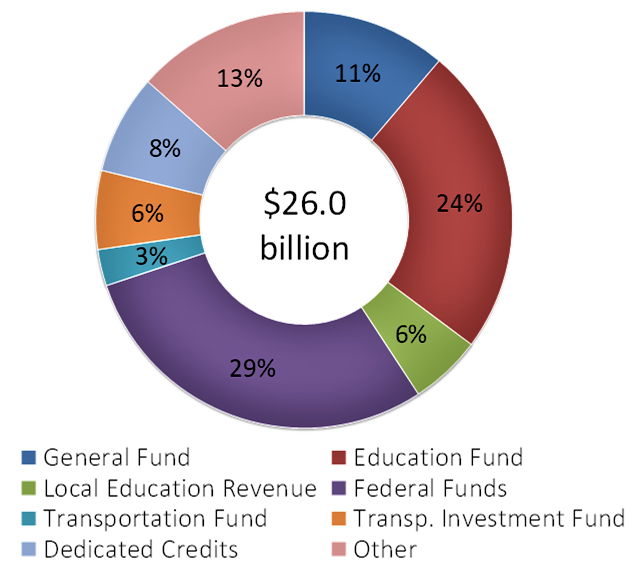
If you’ve ever wondered where the 13% of “other” money in the last third comes from, exactly how much is collected and spent, and how much remains unspent every year, you’re not alone. Each December, the Executive Appropriations Committee hears two important reports: the first covers money in restricted accounts and funds, the second looks at unspent resources in agency budgets.
This year, the Office of the Legislative Fiscal Analyst created two new online interactive sites to reveal account and budget balances: check out account balances here and unspent budget balances here. Access these dashboards by perusing the lists, filtering with drop-downs, or using the search feature, then click on items for greater detail.
You can find the statutory authority, history, and purpose of any given fund or account on yet another site - the financials tab of the Compendium of Budget Information.
While not every unspent balance is available for use, and because we know more data usually leads to more questions, please reach-out to your local fiscal analyst for greater insights on the state’s budget composition!
Passing the Baton: Subcommittees Present Priorities to Executive Appropriations Committee
We've crossed the halfway point of the 45-day General Session, meaning that appropriations subcommittees have officially concluded their work to review agency budgets, make necessary approvals, and prioritize wish lists for new funding. The process of prioritizing new funding requests is laid out in the Joint Rule 3-2-402. Requests for new funding come from agencies (if approved in the Governor's Budget), from legislators (as requests for appropriations), or from legislative staff recommendations. Many times, a single request makes its way through multiple channels, and the Executive Appropriations Committee (EAC) serves as a final filtering mechanism to make sure the right amount is appropriated to the correct project. EAC is aided by revenue estimates, updated during the last weeks of the General Session, in determining the total amount of one-time and ongoing funding to appropriate to new projects. "New funding" (that is, funding above and beyond what was included in base budgets) is contained in several bills, including: the New Fiscal Year Supplemental Appropriations Act and Current Fiscal Year Supplemental Appropriations (a.k.a., Appropriations Acts), Appropriations Adjustments (a.k.a., the Bill of Bills).
On February 9th and February 10th, chairs of the seven topical appropriations subcommittees will present reports to the Executive Appropriations Committee detailing committee actions and highlighting the prioritized lists for one-time and ongoing state funds:
Business, Economic Development, and Labor: 2023 Recommendations
Executive Offices and Criminal Justice: 2023 Recommendations
Higher Education: 2023 Recommendations
Infrastructure and General Government: 2023 Recommendations
Natural Resources, Agriculture and Environmental Quality: 2023 Recommendations
Public Education: 2023 Recommendations
Social Services: 2023 Recommendations
Consolidated Priority Lists for All Committees: One-time and Ongoing
Nothing is Certain in Life, Except Death and the Volatility of Income Taxes
Individual income tax is one of the most discussed and examined sources of revenue in Utah, and for good reason -- most of us pay individual income tax, and it is also the largest single source of revenue to the state. While it may seem a familiar topic, there are many nuances that contribute to income tax being a source of state revenue that is as uncertain as it is significant.
There are two main components of individual income tax: withholding and final payments. Withholding is money that is withheld by an employer from an employee’s paycheck each pay period, which is then remitted to the state and held as a credit against the employee’s annual income tax liability. This is typically a steady stream of payments to the state throughout the year. On the other hand, final payments are the actual, closing assessments of taxes, typically due when the tax year is complete and the deductions, credits, exemptions, etc. needed to calculate tax liability are known. There are certain situations when final payments may be collected throughout the year including filing extensions, tax audit adjustments, and others.
Compared to withholding, final payments fluctuate seasonally throughout the year with ripples coming in at the end of each quarter before cresting in a large wave of payments in April and May, aligning with the annual tax return deadline. Importantly, final payments reflect not just wage income, but all taxable events an individual experiences throughout the year, including capital gains, interest earned, dividends collected, and more. These collections typically don’t come into the state until near the final return deadline. Unlike withholding, final payments are tightly connected to the broader markets, including real estate prices, stock market returns, and interest rates.
These caveats are key to understanding why individual income tax represents the largest source of state revenue which is also the most volatile. Seen in the figure below, the amount of year-to-year variability in individual income tax is pronounced, rivaled only by corporate income tax.
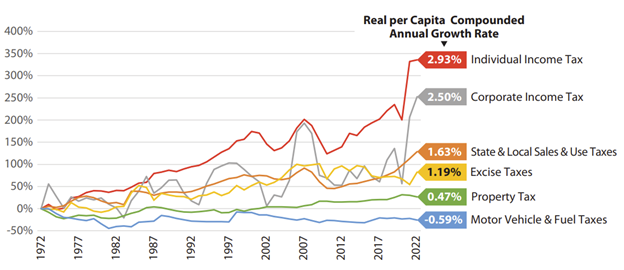
Image courtesy of the Kem C. Gardner Policy Institute.
This volatility has been especially apparent in recent years. Out of the pandemic-induced lows of 2020, the stock market rallied in 2021, with home prices climbing to historic levels which led to high levels of capital gains. This income, in addition to a broadly strong recovery in the economy and a tight labor market, pushed Fiscal Year (FY) 2022 final payments to nearly double those seen FY 2019.
Capital gains represent just one part of non-wage sources of income which impact final payments. Shown with the figure below, these “other” income sources lead to the large swings in individual income tax collections, despite the relative stability of wage income. Non-wage income is the most volatile component of individual income tax.
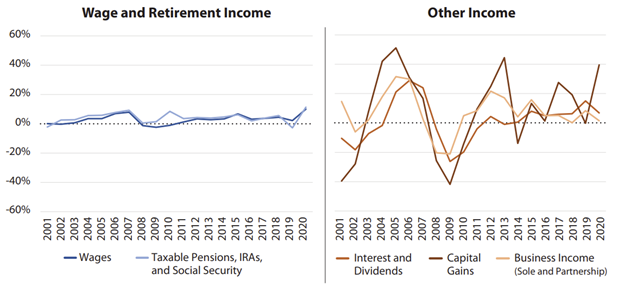
This volatility is evident in the most recent tax revenue reports. Specifically, year-over-year growth rates for individual income tax were inordinately high in both December and January this year, at 25.3% and 24.5%, respectively. This is due to a large amount of pass-through entity payments, which would have typically come near the usual April 15th filing deadline, shifting into December and January. H.B. 444, “Income Tax Revisions,” from the 2022 General Session made changes to how individuals are allowed to file returns. The impact of this shift on the year-over-year growth rate will moderate as we draw closer to the end of the fiscal year, when these filings would have previously been collected. In short, the end of the calendar year spike seen on revenue summaries represents a timing change more than an absolute increase in collections. As with many parts of the state budget, the devil is in the details.
A detailed examination of income tax volatility is available in this report from the Kem C. Gardner Policy Institute.
The reports referenced in this post are available at the links below:
February Revenue Snapshot (FY 23)
Tax Commission Revenue Summary (Period 7, FY 2023)
Revenue Publications Archive
Spotlight on Infrastructure: Recent Large Investments in Water, Roads, and More
Over the last two General Sessions, the Legislature has made significant investments in Utah’s transportation, water, recreation, and other categories of infrastructure, financed by extraordinary General Fund surpluses and federal stimulus (primarily the American Rescue Plan Act). In the table below, you will see summarized amounts according to area of infrastructure, along with a link to posts with more information. The totals below are not intended to be comprehensive figures, they instead describe large amounts that have been appropriated in the last two calendar years (General and Special Sessions).
| Infrastructure Area | 2021 | 2022 | Totals | Budget.Utah.Gov Post |
| Transportation (Cash) | 834,600,000 | 1,294,000,000 | 2,128,600,000 | Lanes, Trains, and Automobiles |
| Transportation (Debt) | 314,000,000 | (294,000,000) | 20,000,000 | Lanes, Trains, and Automobiles |
| Water | 100,000,000 | 379,840,300 | 479,840,300 | A Changing Landscape |
| Recreation | 104,995,200 | 80,040,000 | 185,000,000 | Putting the Fun in Funding |
| Buildings (State, Higher Ed.) | 349,900,000 | 349,900,000 | The Build Up | |
| Long Term Capital Projects Fund | 75,000,000 | 85,000,000 | 160,000,000 | (Information Below) |
| Electric Vehicle Charging Stations | 10,700,000 | 10,700,000 | It's Electric! | |
| Totals | 1,428,595,200 | 1,905,480,300 | 3,334,075,500 |
Long Term Capital Projects Fund
During the 2021 General Session, the Legislature created the Long Term Capital Projects Fund (LTCP Fund), a non-statutory, administratively created account that is located under the Capital Budget. In the same session, the legislature set aside $115.0 million General Fund for future allocation to specific infrastructure projects. The Legislature later reduced the fund by $40.0 million in the 2021 First Special Session.
During the 2022 General Session, the Legislature transferred $15.0 million from the LTCP Fund to Utah State University for electric vehicle research in the current fiscal year, and also appropriated an additional $100 million into the account, for a net increase of $85 million.
In the 2023 General Session, $50 million was transferred to the Inland Port Authority in S.B. 6, Item 95. However, the bill directed the funding to lapse back to the LTCP Fund if it was not needed for the settlement described in intent language.
Sine Die and to all a Goodnight: A Budget Summary of the 2023 Legislature
The Utah Legislature concluded its 2023 General Session with a budget of $29.4 billion for fiscal year 2024. The budget includes $14.6 billion from state funds (General Fund, Income Tax Fund, Uniform School Fund) and $170 million from the federal American Rescue Plan Act (ARPA).
Top legislative budget priorities included state fund investments in:
- Taxes -- Reduced Income Tax ($400 million), repealed state sales tax on food conditional upon repeal of the constitutional income tax earmark ($165 million), removed freeze on basic property tax levy ($145 million), cut gas tax ($33 million), offered Low Income Housing Tax Credit ($52 million), Child Tax Credit ($10 million), and Adoption Tax Credit ($3 million), among other tax cuts;
- Public Education -- $233.1 million to increase the Weighted Pupil Unit (WPU) value by 6% from $4,038 to $4,280 and $196.9 million for educator salary bonuses;
- Transportation -- $1.2 billion for commuter rail, trail projects, Cottonwood Canyons transportation, and other enhancements;
- Higher Education -- $35 million for performance funding;
- Medicaid -- ($127.2 million) one-time in FY 2023, $27.3 million ongoing, and ($300,000) one-time in FY 2024 to provide medical services to an estimated 505,000 clients in FY 2023 and 435,600 clients in FY 2024;
- State employee compensation -- $242 million ongoing, including state employees: 5% cost-of-living adjustment, 3.75% targeted, 2.5% discretionary pay-for-performance; and higher education employees: 8.75% discretionary pay; and
- Debt reduction and avoidance -- $915 million ($775 million transportation debt pre-payment, $140 million state revenue bond avoidance).
As required by the Utah Constitution, legislators balanced the budget to projections of available revenue.
This document lists the most significant budget actions according to appropriations subcommittee: Spending Summary.
There are a number of resources available for the public and legislators to understand more about Fiscal Year 2023 and 2024 funding:
Budget Quick Facts – A pocket-sized guide to the budget.
DataViz – An interactive graphical representation of the budget. View the budget by sources, uses, and new money. Click a bubble to see how that item has changed over time, and in what bills it changed. Search for budget requests and find where it exists in appropriations bills.
Compendium of Budget Information (COBI) – A complete guide to the Utah State budget. Find budget requests on the Issues tab, and Line item/program budgets on the Financials tab.
Luck Remains as Revenue Collections Stay Golden
Earlier this week, the Tax Commission released their Revenue Summary (TC-23) for March, detailing collections through March 7th, 2023. The Office of the Legislative Fiscal Analyst and Governor’s Office of Planning and Budget jointly released their revenue snapshot, summarizing monthly revenue in contrast to yearly forecasts. Through the first eight months of the fiscal year, collections to all state funds totaled 14.0 percent year-over-year (YoY) growth when compared to March of 2022.
General Fund collections totaled just over $2.25 billion, representing a 12.9 percent increase YoY. Oil and Gas collections continue their upward trajectory, with Oil and Gas Severance Tax posting a nearly $38 million or 74.0 percent increase over FY 2022 (a year which was already substantially higher than FY 2021). While not represented on the Revenue Summary or the Snapshot, “All Other Sources” to the General Fund have been bolstered by the state’s investment income (fund balances invested by the treasurer), which through the end of February were 1,100 percent higher than the same time last year.
Income Tax remains elevated due to a timing change for certain filings being advanced from the usually April filing deadline to the end of calendar year 2021. Corporate tax collections were down $47 million over the previous year, representing a 11.2 percent decrease. However, it’s worth noting that this contraction is on top of two years of exceptional growth in corporate earnings (February 2022 and February 2021).
Income to the Transportation Fund was bolstered by the annual recalculating of fuel tax, which increased four and a half cents per gallon on January 1st. Aviation Fuel tax also increased by 13.7 percent YoY, likely an indicator that post-pandemic travel demand is continuing to run its course.
The reports referenced in this post are available at the links below:
March Revenue Snapshot (FY 23)
Tax Commission Revenue Summary (Period 8, FY 2023)
Revenue Publications Archive
Too Blessed to be Stressed, Pt. 2: 2023 Updates to Budget Contingencies
Last December, Legislative economists presented their findings from the 2022 Budget Stress Testing exercise to the Executive Appropriations Committee in a report jointly prepared with the Governor’s Office. Stress testing is one part of the long-term fiscal sustainability analysis required under UAC 36-12-13. In a three-year cycle, the Office of the Legislative Fiscal Analyst is required to prepare a revenue volatility report (forthcoming in 2023), long-term budgeting (2024), and budget stress testing (2022 and 2025).
As summarized in this post from December, Utah’s “easy to access” and “moderately-easy to access” budget buffers would be enough to cover reductions in revenue in the event of a severe recession for up to five years. The purpose of this update is to summarize additional contingencies that were appropriated during the 2023 General Session that would fall under the easy and moderately-easy to access categories of budget reserves. These budget buffers represent Utah’s Working Rainy Day Funds, one lever in Utah’s Fiscal Tool Kit. Working Rainy Day Funds are cash-funded infrastructure projects that can be replaced with debt financing in the case of a recession. For instance: if the Legislature appropriates $50 million ongoing for highway development, in the case of a financial crisis this project expense could instead be paid for through bonding, and most of the ongoing funding would be available for more urgent needs.
During the 2023 General Session, the following items considered additional budget contingencies were appropriated by the legislature:
Easy to Access
- Cash-funded Buildings
- --- $571.1 million one-time for 28 projects for state agencies and higher education entities
- --- $108 million one-time for the Point of the Mountain State Land Authority
- --- $125 million one-time for the State Building Infrastructure Fund
- Cash-funded Transportation
- --- $45 million ongoing for Active Transportation Statewide Trails Network
- --- $200 million one-time for commuter rail improvements
- ---$100 million one-time for Cottonwood Canyons transportation
- --- $800 million one-time for various transportation enhancements
- Cash-Funded Water
- --- $170 million one-time for Ag. Water Optimization
- --- $50 million one-time for aqueduct seismic upgrades
- --- $30 million one-time for a local match program for water infrastructure needs
- --- $13.1 million one-time for the Graveyard Wash Reuse Reservoir
- Medicaid Expansion Fund
- --- $59 million ongoing for authorized uses under UCA 26-36b-208
- Capital Improvements
- --- $18.5 million ongoing to increase the capital improvements rate set aside from .9% to 1.5% of asset value
- Debt Service
- --- $440 million one-time and $335 million ongoing to accelerate bonding payments
Moderately Easy to Access
- State Infrastructure Banks
- --- $10 million one-time for the Utah Inland Port Authority
- Public Education Economic Stabilization Account
- --- $193 million ongoing for public education including enrollment growth in the case of insufficient revenues in the Income Tax Fund
These changes in working budgetary reserves from December through the end of the 2023 General Session are summarized in the table below:
| Ease of Accessibility | Five-Year Total (Dec. 2022) | Five-Year Total (March 2023) |
| Easy to Access | $2,722,200,000 | $4,386,200,000 |
| Moderately Easy to Access | $2,670,600,000 | $3,159,700,000 |
| Somewhat Difficult to Access | $2,545,000,000 | $5,321,300,000 |
| Difficult to Access | $1,276,500,000 | $1,276,500,000 |
| Total | $9,214,000,000 | $14,143,700,000 |
In light of recent and ongoing economic uncertainty, these working rainy day funds and regularly updated analyses provide lawmakers and Utah residents with the security of knowing that the State is prepared to weather the next storm.
A Look at Recent Events in Tax Collection History
This month's Revenue Summary Report from the Utah State Tax Commission (TC-23) and April Revenue Snapshot produced by the Legislative Fiscal Analyst and Governor's Office of Planning and Budget show General and Income Tax Fund collections through April 7th up 12.2% over the same collection period in FY 2022. While Legislative Fiscal Analysts don't enjoy tax day per se, they do observe tax season with eager eyes, to disentangle macroeconomic factors and see how the forecast aligns with collections. Several events in recent tax history have left legislative economists with their work cut out for them when it comes to revenue projections. To better understand how these events have shaped collections to state funds, the graph below calls out several factors that have made both forecasting and comparisons challenging:
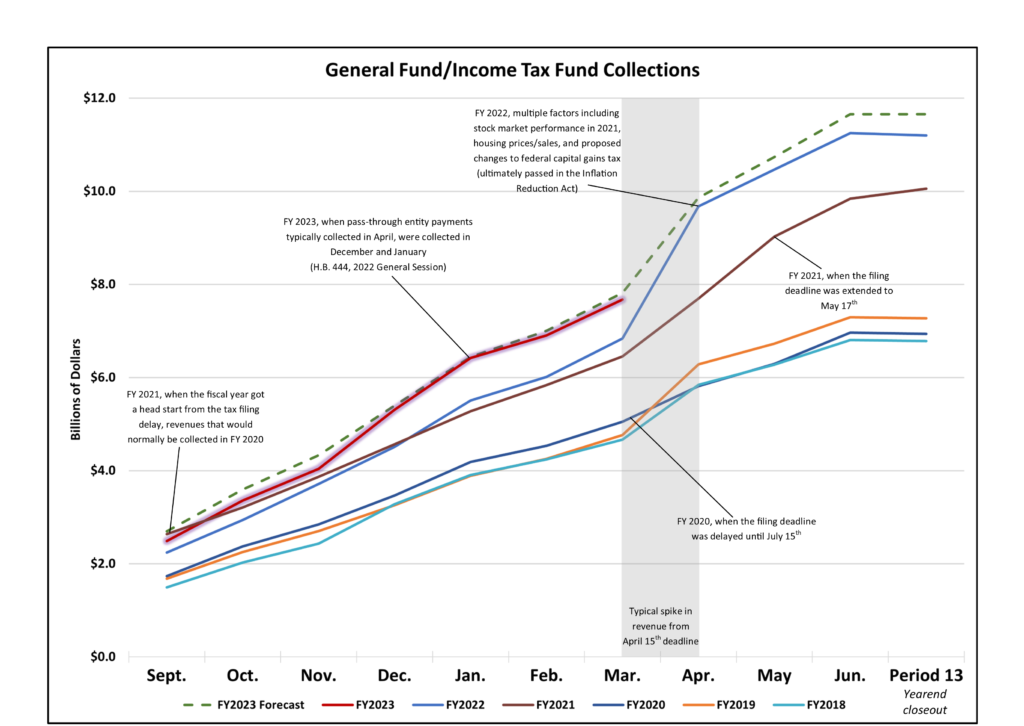
Click on the image above for a high resolution chart with captions linked to previous blog posts.
In the graph above, most of the contemporary anomalies began with the pandemic, as we saw two consecutive years of filing deadline extensions (in this way, LFA does have a fondness for the reliability of April 15th). Most recently, H.B. 444 from the 2022 General Session changed the way that pass-through entities (LLCs and the like) pay state and local taxes (SALT). They are now allowed to file information returns and pay state taxes separately from their owners for favorable federal tax treatment. This deviation in revenue trajectory can be observed starting in November of FY 2023 (impacts are noted in the Revenue Snapshot table under "Passthrough SALT").
Economists update revenue projections in June, October, December, and February, which allows the legislature to be nimble when it comes to addressing economic events as they occur. You can also read our last post to learn more about the budget contingencies that further improve Utah's budget resiliency.
Financing NOAA's Arc
You don't need the National Oceanic and Atmospheric Administration (NOAA) to tell you that Utah's winter packed a wallop. No matter how you measure it - 750 inches of snowfall or 30 inches of snow water equivalent in Utah's mountains - all that water has to go somewhere, and it's all downhill from there.
NOAA's National Weather Service is now weaving a tale of upward trending temperatures leading to above-average run-off. The story's climax: flooding; implying the need to prepare.
Governor Cox's disaster declaration is a good start. It begins to free-up resources the Legislature provided for such situations. The table below shows just how much money is currently available, and what policymakers need to do to access it.
| Currently Budgeted/Appropriated | FY 2023 | Would require legislative action? | Conditional on President, Gov. or local authority declaring a disaster? | Notes |
| General Fund Appropriation for Flood Mitigation | $5,000,000 | No | No | Funding has been allocated to certain purposes and counties. |
| GFR - Disaster Recovery Fund (Fund 1334) | $7,117,500 | No up to $5M | Yes | Funding could be used for state costs after there is a declared disaster by the Governor. Amounts above $5M would need to be reviewed by the Legislature. |
| GFR - Response, Recovery, and Post-disaster Mitigation Restricted Account (Fund 1249) | $10,600,000 | No up to $5M | Yes | Funding is mainly from SB 33 passed in the 2023 General Session and for local costs. $600,000 is available immediately while the $10,000,000 is not technically available until May 3rd (special effective date). Amounts above $5M would need to be reviewed by the Legislature. |
| Development/Enhancement of emergency management capabilities (Fund 1334) | $750,000 | No | No | Funding is mainly from SB 33 passed in the 2023 General Session and for local costs for DPS - Emergency Management capabilities. The Division prefers not use this, nevertheless it could be used. An option is the Legislature could appropriate an equivalent amount to them next year. |
And there's more where that came from. With legislative action, appropriators could unlock amounts above the maximums listed above as well as appropriate additional amounts from reserves. Disaster-related reserve fund balances are shown in table 2, below.
| FY 2023 | Would require legislative action? | Conditional on President, Gov. or local authority declaring a disaster? | Notes | |
| Local Government Emergency Response Loan Fund (Fund 5515) | $7,127,900 | Yes | No | Reflects balance in the fund. Would require statute change - Statute says that balance has to be at least $10M before any loans from this fund are made. |
| GFR - Disaster Recovery (Fund 1334) | $53,965,300 | Yes | Yes | Reflects approximate balance (minus commitments) in the fund and would require an appropriation. |
Financially speaking, the state is flooded with options to hit the high water mark. Now, if we could only figure out what a cubit is.
H-2-Whoa: 2023 General Session Investments in Water Management
Whether addressing the issue of having too much or too little water, recent hydrologic conditions of the state have kept law makers on their toes. Last year, the state made several large investments focused on mitigating drought conditions and increasing conservation, of which $450 million was funded by the American Rescue Plant Act (ARPA) and roughly $55 million was from the General Fund. During the 2023 General Session, legislators were inundated with bills and funding requests aimed at increasing the state’s ability to adapt to an unpredictable water cycle. The table below shows funding items (which may be associated with legislation), including the amount and funding source. The items are linked to their entry in COBI.
Several bills were also passed that impact water management, which may not have included an appropriation (in the list above):
| Bill Number | Short Title |
| S.B. 34 | Water Infrastructure Funding Study |
| S.B. 53 | Groundwater Use Amendments |
| S.B. 76 | Water Amendments |
| S.B. 118 | Water Efficient Landscaping Incentives |
| S.B. 119 | Per Capita Consumptive Use |
| S.B. 144 | Water Instream Flow Amendments |
| S.B. 158 | Water Exactions Amendments |
| S.B. 191 | Condominium and Community Association Amendments |
| S.B. 236 | Legislative Water Development Commission Amendments |
| S.B. 251 | Secondary Water Metering Requirements |
| S.B. 277 | Water Conservation and Augmentation Amendments |
| H.B. 33 | Water Related Liability Amendments |
| H.B. 150 | Emergency Water Shortages Amendments |
| H.B. 207 | Compact Commission Amendments |
| H.B. 307 | Utah Water Ways |
| H.B. 349 | Water Reuse Projects Amendments |
| H.B. 450 | Landscaping Requirements |
| H.B. 491 | Amendments Related to the Great Salt Lake |
| H.B. 513 | Great Salt Lake Amendments |
There are also a number of existing water-related funding programs in the state (some of which were supplemented by items listed above). This year's record breaking snowpack provides policymakers and water managers alike with a unique set of challenges, distinct from the issues faced in previous water years. Our last post summarized emergency-response funding available to address above average flows as the weather warms up. While it remains to be seen how this year's runoff will impact the state, it's clear that the Legislature has been actively working to respond to the water woes facing Utah.
Introducing the Reimagined budget.utah.gov
During the Executive Appropriations Committee meeting on Tuesday, May 16th, the Office of the Legislative Fiscal Analyst unveiled the newly designed budget website for the state of Utah. The site (affectionately referred to by LFA as the acronym 'B.U.G.') aims to make it easy for legislators and the public to find products while also understanding the office structure for the Legislative Fiscal Analyst (LFA). The budget homepage offers four tiles (reflecting LFA's staff structure) which flip when clicked to display easy-access product links:
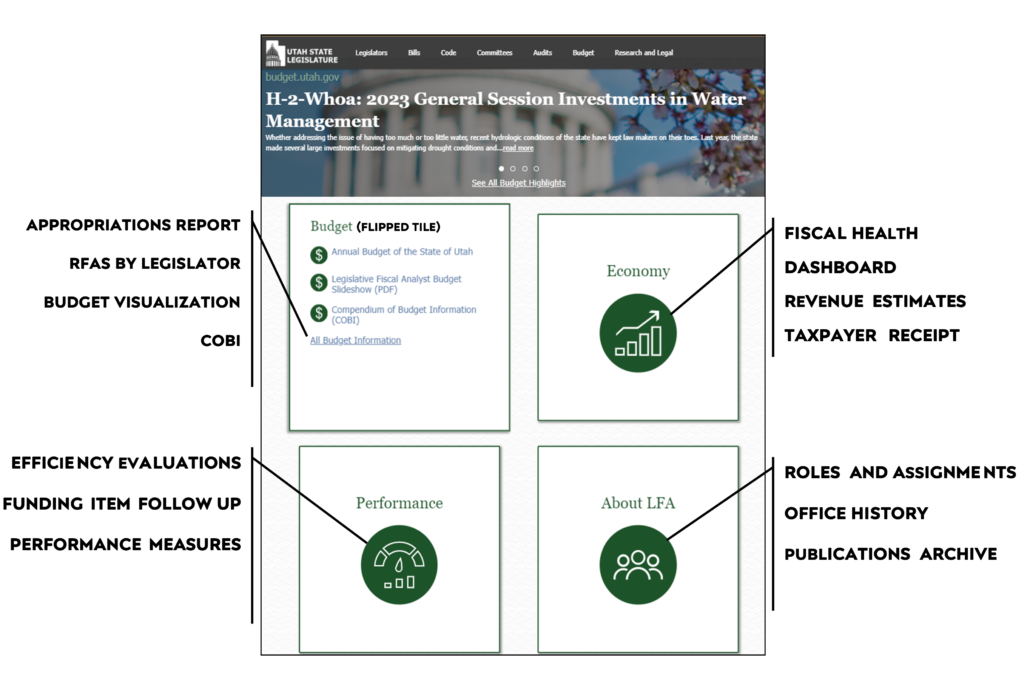
The Budget Highlights archive now offers key word searches and allows users to filter by date of publication. You can access this page from the homepage or from the left hand navigation bar.
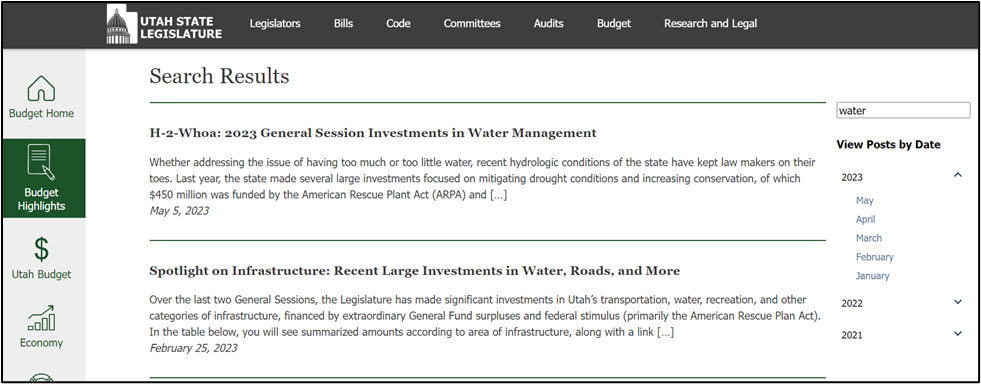
The Roles and Assignments page (located under the About section) also features a search function, to find the appropriate LFA staff quickly and easily:
We welcome feedback on usefulness and accessibility. Legislators can reach out to their fiscal staff and members of the public can contact the webmaster.
Income Tax Collections Down Slightly, As Expected
On Tuesday, May 16th, the Tax Commission released their Revenue Summary Report detailing collections through 10 months of the fiscal year, in conjunction with the May Revenue Snapshot produced by the Legislative Fiscal Analyst and Governor’s Office of Planning and Budget which compares collections to consensus revenue estimates. Total collections to all sources were down 1.1% compared to Fiscal Year 2022, a figure within 2.5 percentage points of the projected growth rate.
The General Fund performance remained steady at 10.6% year-over-year (YoY) growth, only slightly reduced from the 11.8% YoY reported last month. Sales and use tax set asides, including Water Infrastructure, Medicaid Expansion and more, grew 10.4% over FY 2022. These set asides may grow at a different rate than the larger General Fund because of the specific items that are taxed, and because certain set asides have collection limits set in statute.
The Income Tax Fund collections were down from last year, posting (4.8%) when compared to FY 2022’s astronomical final payments. However, withholding amounts actually increased 6% YoY, reflecting a strong labor market with increased wages. As discussed in detail during the May Executive Appropriations Meeting, multiple factors have influenced income tax collections over the last several years, most recently with pass-through entities (i.e. limited liability companies) adjusting their final payments to December.
It’s worth reminding readers of the lag between collections and reporting, with May’s report detailing collections made in April, for sales and wages that took place in March. May’s report captures the final payments which were made on-time for the typical April 15th filing deadline, a refreshing return to status quo from the last few fiscal years.
BOTSU: Simply the Best
The Budget of the State of Utah (BOTSU) is an annual report detailing budget actions taken during legislative sessions, providing the historical record for state appropriations made during each meeting of the legislature. BOTSU is an office-wide publication of the Legislative Fiscal Analyst (LFA), all subcommittee staff participate in writing the chapters for their respective subject areas and in reviewing and finalizing other chapters for accuracy and completeness. In LFA, this report is referred to as “BOTSU,” and whether that’s because the legislature will assign an acronym whenever possible or if it’s because in Japanese BOTSU translates to “death” --- the world may never know.
BOTSU, also known as the Appropriations Report, is something that LFA takes pride in producing. While staff would not hesitate to draft, review, and publish this nearly 600-page report simply of their own volition, it furthers their fiscal-resolve that in doing so, staff fulfill a statutory requirement under the Budgetary Procedures Act to “prepare, after each session of the Legislature, a summary showing the effect of the final legislative program on the financial condition of the state,” (UCA 36-12-13).
This year’s report was not published without its own bumps in the road. The timing of the May special session forced the LFA to make a tough call: either wait to publish the report until after the budgetary actions of the special session could be incorporated (delaying the publication, in turn preventing a written summary on the state’s current financial condition from being readily available) or, print an initial version sans budgetary actions taken in the special session. LFA opted to go with the latter, allowing legislators and the public to reference the report as soon as possible. LFA is currently working on an update that would include budgetary changes approved by the Legislature during the 2023 First Special Session held on May 17, 2023. The revised report will be published later this summer, and any subsequent special sessions will be included in next year’s report.
Now onto the fun part, how to access BOTSU. While the report is mostly an on-line document and is currently available on the newly redesigned budget.utah.gov site – discussed in this recent blog post – under the Budget tab on the homepage. We do print physical copies for those interested in feeling the pages between their fingertips as they read about the intricacies of things like education spending within our state. If you would like a hard copy, contact the Office of the Legislative Fiscal Analyst.
This report isn’t the kind of document that’s published and placed on a shelf to be immediately forgotten. Not only is this information relied on heavily by the legislature, but is also used broadly by state agencies, and referenced by financial institutions when determining the stability and financial condition of the state. With the large amount of customers referencing the report, LFA has formatted the online version with users in mind.
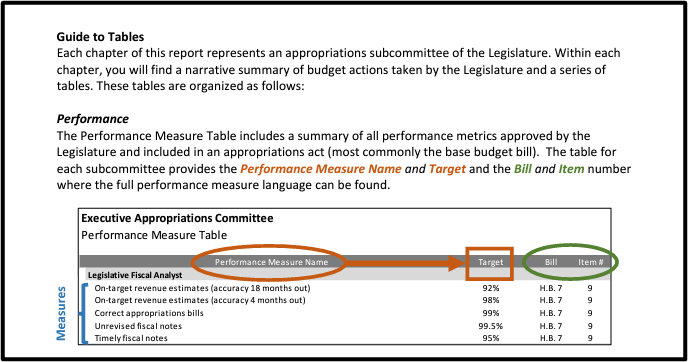
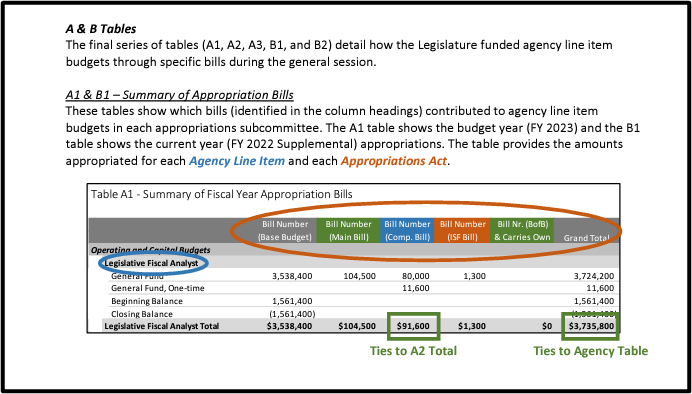
The PDF report is made to be easily parsed and is divided into chapters starting with a Statewide Summary, a brief overview into each subcommittee’s budget items, followed by chapters for each appropriations subcommittee. The “Guide to Tables” section at the beginning of the report was developed to help explain how the budget tables work together to provide a complete budget picture. The PDF report also includes bookmarks for each subject-area chapter and relevant budget tables, so users can easily jump to the section they need. The goal when working on this report is to provide an in-depth look into the state’s financial status, while also making it easy to read and understand.
How Will the Fiscal Responsibility Act Impact Utah?
At a glance, the Fiscal Responsibility Act of 2023:
- Holds FY 2024 discretionary spending constant and provides 1% increase in spending for FY 2025;
- Does not rescind funds from the American Rescue Plan Act (ARPA) State and Local Fiscal Recovery Fund or the ARPA Capital Projects Fund;
- Changes requirements for SNAP and TANF, though it’s not yet clear how these changes impact Utah.
With the all-important “X-date” nearly upon us (the projected day when the federal government would no longer be able pay its bills), a default-avoiding deal to suspend the federal debt ceiling has been reached. Over the last week, negotiations were drafted into a bill which passed out of rules, received a majority of votes in the House, passed in the Senate, and now awaits a signature from the President. As written, the Fiscal Responsibility Act of 2023 would do several things beyond suspending the limit on federal borrowing, with a range of possible impacts for Utah.
First and foremost, the bill holds constant federal discretionary spending for fiscal year (FY) 2024 and provides a nominal 1% spending increase for FY 2025. The legislation does not prescribe specific reductions to discretionary programs that would be required to maintain ‘flat’ federal spending for FY 2024, or the 1% increase for FY 2025. Since the bill only addresses the issue of a spending limit, the question of which cuts will be made is yet to be legislated, later this year. As a result, the potential impact on the state’s budget could vary significantly, depending on what programs are targeted. As a failsafe, the legislation includes a sequestration clause. This comes in the form of a 1% blanket reduction to all discretionary spending categories, in the case that congress opts for a single omnibus spending bill instead of passing its twelve individual appropriations bills by the end of 2023. These bills would then outline the specific programmatic reductions to achieve the spending goals for FY 2024 and FY 2025. This penalty for inaction will likely be avoided, because of the impact it would have on defense programs which are currently exempt from the bill’s spending caps.
The bill also pulls back approximately $28 billion, in aggregate, of unobligated COVID-19 relief revenue. These funds were originally appropriated through the CARES Act, ARPA, and four other stimulus bills associated with the pandemic. This $28 billion is comprised of unobligated balances from specific sections of the stimulus bills, and funding will not be pulled back if it’s been obligated by a federal agency, but not fully spent by a state or local government. Notably, the ARPA State and Local Fiscal Recovery Fund and ARPA Capital Projects Fund were not included in the targeted list of claw-back funds. The state is currently reviewing the entire list and comparing it to pandemic stimulus grant awards made to the State of Utah along with reported federal obligations.
Two other components of the legislation with potential state budget impacts are the eligibility and work-requirement related changes to SNAP (Supplemental Nutrition Assistance Program) and TANF (Temporary Assistance for Needy Families).
The expansion of work requirements for SNAP eligibility would likely result in certain able-bodied people who are between 50- and 54-years-old, without dependents, becoming ineligible (assuming they do not work or volunteer at least 80 hours a month). However, the bill removes SNAP eligibility work requirements for former foster children, veterans, and unhoused individuals, which would likely increase the number of eligible beneficiaries. The net impact on the number of SNAP recipients in Utah is currently unclear. Because SNAP is solely federally funded, any reduction in eligibility may have indirect effects on food purchases but won’t directly impact state expenditures or revenues (SNAP purchases are tax exempt). However, there may be a marginal cost to administration of the program (which is split between federal and state) due to the changes in eligibility.
Another change in the bill without definitive impacts to Utah is the adjustment to TANF’s benchmark year for demonstrating caseload reduction. The current benchmark year is 2005; the Fiscal Responsibility Act proposes to change that year to 2015. To receive TANF funding, the state must meet a work-participation standard among program recipient families. However, by demonstrating a reduction in caseload (the number of recipients), the state receives ‘credit’ towards that work-participation standard. From 2005 to 2022, Utah’s credited caseload decline from 2005 to 2022 under TANF is 73.8 percent (down to roughly 2,000 from over 9,000). Because of this large decline in caseload, the current work-participation standard for recipient families in Utah has been reduced from 50% to 0%. It's not currently clear how changing the benchmark year will impact the state’s budget or Utah’s eligibility. An outcome could be that federal block grants are reduced if the new benchmark increases the work-participation standard and current recipients do not meet that higher threshold, however this would only apply if the state could not comply with a corrective action plan. A blog post with more information on the TANF program will be released this month.
Other provisions of the bill are unlikely to have direct impacts on the state’s finances, including the reduction in the appropriation for the IRS, the permits for the Mountain Valley Pipeline, or the student loan payment resumption.
Revenues through June Nearly Identical to FY 2022
On Thursday, June 15th, the Tax Commission released their Revenue Summary report, detailing collections through 11 months of FY 2023. Through June 7th, Sales and Use Tax in total is up 6.7% year-over-year (YoY) and up 5.5% YoY excluding Sales and Use Tax Set-Asides. Individual Income Tax is down, (5.6%) when compared to the same time in FY 2022. The Legislative Fiscal Analyst, along with the Governor’s Office, released their monthly Revenue Snapshot which details collections in comparison to revenue forecasts. When measured up to the annual forecast finalized in February, total collections from all sources are nearly identical YoY to FY 2022, amounting to a rate 1.4 percentage points below the full year forecast.
General Fund performance has continued to gradually moderate over the fiscal year, still posting more than 10% growth when compared to the report from June 2022. As noted by Legislative economists, growth in total taxable sales has slowed in recent months as consumers shift their focus away from goods and towards services. Similar to last month, the largest contributors to General Fund growth besides Sales and Use Tax were Investment Income (up almost 1,200% YoY) and Oil and Gas Severance Tax (up 64% YoY).
Final payments on Individual Income Tax are down, (57.1%) over FY 2022. However, when factoring in the payments that came in ‘early’ due to statutory changes (discussed in this post) final payments are only reduced (28.7%), YoY. A combination of factors underly final payments performance, including capital gains and tax changes at the federal level which likely positively influenced last year’s collections. In total, the Income Tax Fund collections are short (5.4%) compared to the same period last year.
While not large contributors to the state’s overall revenues, a few observations from the Tax Commission’s reporting:
- In Local Option and Use Taxes, the TRCC (Tourism, Recreation, Cultural, Convention, and Airport Facilities Tax) RV and OHV Leasing Tax is up 309.9%.
- Motor vehicle registration fees are up 15%, perhaps an indication that vehicles are becoming more available for purchase.
- Snowmobile registration fees are up 11.5% (thank you, snow).
The reports referenced in this post are available at the links below:
June Revenue Snapshot (FY 23)
Tax Commission Revenue Summary (Period 11, FY 2023)
Revenue Publications Archive
Driving a Culture Shift: Creating Performance Measures to Enhance Public Service Value
In today's rapidly evolving world, government agencies face the crucial task of continuously improving their services to better serve the public. The paradigm has shifted from mere service delivery to emphasizing value creation for citizens. Utah has been actively working to measure government performance for over a decade now through various initiatives. In 2021, the Legislature codified a collaborative approach between the executive and legislative branches and state agencies. To foster this culture of improvement, the joint Legislative Fiscal Analyst (LFA) and Governor’s Office of Planning and Budget (GOPB) performance team hosted national partners from the National Conference of State Legislatures (NCSL) Center for Results-Driven Governing and The Policy Lab at Brown University in Salt Lake City for an exciting workshop on creating performance measures (see agenda here).
Performance measures serve as the foundation for evaluating the effectiveness of government services. They provide tangible metrics that enable legislators to understand agencies' progress toward goals, identify areas for improvement, and make data-driven decisions. By implementing robust performance measures, agencies can enhance accountability, transparency, and citizen-centricity and communicate effectively to the legislative branch.
Rather than measuring outputs, the emphasis of the workshop was on capturing outcomes that truly matter to the public. This shift is essential to aligning government efforts with citizens' needs, expectations, and desired outcomes. By measuring the impact and value created, agencies can proactively adapt their strategies and policies to better serve the citizens of our state.
The workshop fostered collaboration among state agency representatives, LFA, GOPB, and experts in performance management. This cross-functional engagement allowed participants to exchange best practices, share experiences, and learn from one another. LFA presented on how Utah measures performance by utilizing funding item and line item measures. NCSL presented on the national landscape of performance measurement and showed that Utah is unique in its collaborative approach between the executive and legislative branches and in following up on the performance of individual appropriations. The Policy Lab, from Brown University, trained state employees how to create a causal chain/logic model for how a program activity creates outputs, which affect outcomes, and ultimately impact a population. They also cautioned about misinterpretations that can occur and gave suggestions on how to correct them. The training culminated in a workshop where agencies worked with LFA, GOPB, NCSL, and the Policy Lab to create individual performance measures. State employees, tasked with the creation of performance measures for each funding item actively engaged in determining the full purpose of the funding item and, ultimately, a measure.
Other states, such as New Mexico, have been doing this work for a long time and we know from them that success occurs in small increments over time. Our training with national peers and our agency partners gave us a boost of confidence in this work and in our efforts to continue to shift the conversation about government performance.
A crucial aspect of this cultural shift lies in celebrating improvement. The workshop highlighted the significance of recognizing and appreciating the efforts of government agencies in enhancing their services. By embracing a culture that values continuous improvement, agencies can motivate their employees, boost morale, and cultivate an environment conducive to innovation and excellence. Recognizing achievements can inspire all to strive for excellence in their respective roles.
The workshop also focused on creating performance measures to increase value, which drives culture shifts in how state agencies serve the public. By regularly evaluating their performance, identifying areas for improvement, and celebrating successes, agencies can create a virtuous cycle of continuous enhancement that benefits both citizens and government.
Creating performance measures to enhance public service value is an exciting step towards the outstanding service we aspire to see in government agencies. By placing a stronger emphasis on outcomes, collaborating across sectors, and celebrating improvement, agencies can elevate their services to the citizens of Utah. We are excited to embrace this improvement mindset, drive positive change, and shape a future where government agencies consistently deliver value and exceed citizens' expectations.
Additional Resources for Measuring Performance
For more resources on creating performance measures, see:
- Performance Measure Rubric
- Performance Measure Playbook
- NCSL Doc on Buildings and Other Difficult to Measure Items
In addition to best practices on creating measures, some states have clearing houses that inventory hundreds of public programs and services with ratings to show the extent to which rigorous research supports that a given program leads to a certain outcome. Some examples include:
- Minnesota Inventory: “Since 2015 the Results Team at Minnesota Management and Budget has inventoried hundreds of publicly-funded programs and services offered across Minnesota and assigned a rating that reflects the extent to which rigorous research indicates the program causes specific outcomes. You can search for a specific service by typing a keyword in the search bar below or use a filter to narrow the inventory based on your filter selections. Evidence-based practices are those that are rated Proven Effective or Promising.”
- Tennessee Inventory: “A comprehensive list of state-funded programs in the base budget, including whether they are supported by rigorous evidence. It includes information about the services provided and insight into the evidence that is tied to the program's desired outcomes.”
What in the TANF? Eligible Uses of Temporary Assistance for Needy Families Funding
In 1996, Congress created the Temporary Assistance for Needy Families (TANF) program through the Personal Responsibility and Work Opportunity Reconciliation Act (PRWORA). TANF replaced three separate preexisting programs: Aid to Families with Dependent Children, the Job Opportunities and Basic Skills training, and the Emergency Assistance program.
Under TANF, the federal government provides a fixed block-grant to states who use these funds to operate their own programs. The amount a state is awarded is based on how much the state received in federal funding from the pre-1996 suspended programs (mentioned previously). The TANF block grant has not been increased since the enactment of PRWORA, and there has been no adjustment for inflation or population change.
Annually, the state of Utah is awarded $75.4 million in TANF funding, of that $37.7 million is maintained as a reserve (which is consistent with national averages). The reserve amount was developed by the Governor’s Office of Planning and Budget and the Office of the Legislative Fiscal Analyst (LFA) through an informal scenario analysis. These evaluations noted the amount of TANF reserve necessary to sustain operations under two different recession scenarios: in the moderate scenario the estimated need was $30 million, while under the extreme recession scenario the estimated need was $55 million.
TANF requires a maintenance of effort (MOE) in the form of contributed state funds. The total state MOE requirement is approximately $24.9 million; this amount can fluctuate depending on the percentage of TANF recipients engaged in work-related activities. Federal regulations allow state funds expended for the Child Care and Development Fund MOE to be “double counted” in meeting the state TANF MOE requirement. Federal law also allows certain third-party expenditures (from contractors who receive TANF grants for distribution) to count toward meeting the state’s TANF MOE requirement.
Any costs charged to the TANF program must be necessary, reasonable, and allocable to the program under Federal Cost Principles. TANF funding cannot supplant other funding, and administrative costs (which can't exceed 15%) have to support direct services to the families.
Any expenditure of TANF funds must be included in the allowable uses, as defined in federal rule. The U.S. Department of Health and Human Services states:
“activities, benefits, or services that are reasonably calculated to accomplish a TANF purpose are those that directly lead to (or can be expected to lead to) achievement of a TANF purpose. It also includes activities whose relationship to a purpose may not be obvious, but for which there is evidence that it achieves a purpose.”
More specifically, TANF funds are designed to:
- provide assistance to needy families so that children may be cared for in their own homes or in the homes of relatives;
- reduce the dependency of needy parents by promoting job preparation, work, and marriage;
- prevent and reduce the incidence of out-of-wedlock pregnancies; and
- encourage the formation and maintenance of two-parent families.
So, how exactly can these funds be used? The table below lists ways that TANF funds have been used in the past and identifies activities that are not permitted. Ultimately, consulting with the Utah Department of Workforce Services remains the best method to screen a program for TANF eligibility.
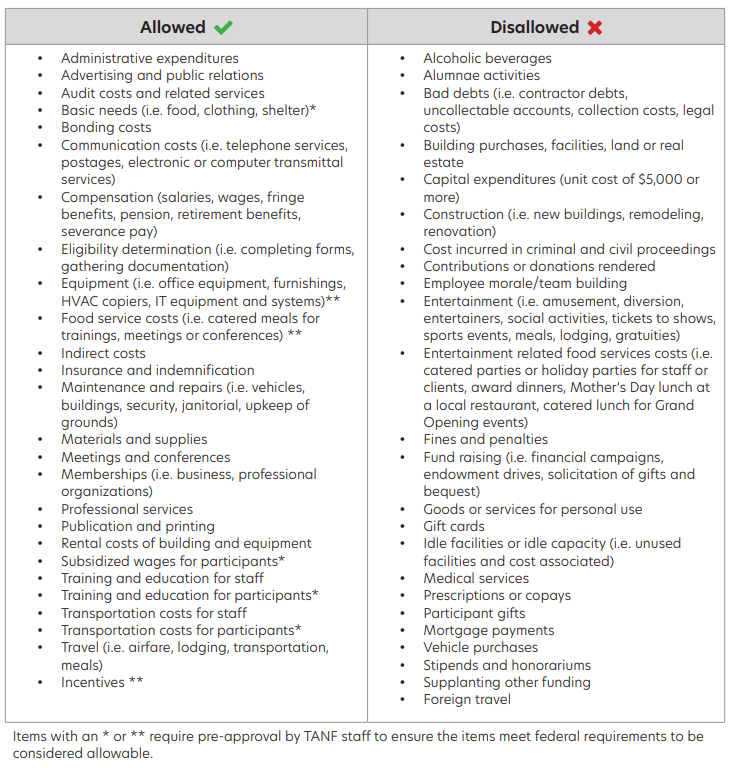
Further information can also be found in this annual report: LFA Issue Brief on TANF (2023 General Session).
Right on Schedule: Yearend Revenues Align with Consensus Forecast
On Thursday, July 13, the Tax Commission released its preliminary year-end Revenue Summary report detailing collections through 12 months of the fiscal year. Simultaneously, the Legislative Fiscal Analyst and Governor’s Office of Planning and Budget produced their monthly Revenue Snapshot which compares collected revenue to the consensus forecast. As of July 10th, revenue to all sources held steady with FY 2022’s collections, as statewide revenues posted 0.8% growth year-over-year (YoY). General and Income Tax collections grew by 0.3%, making collections around $100 million short of consensus estimates (less than 1%) in this latest report.
As with last month’s reports, collections reflect a moderating economy absent significant intervention by the federal government. Discretionary state revenues are lower than budgeted though well within projected ranges. Financial contingencies put into place by appropriators are playing out according to plan. A piece of the savvy budgeting employed during the 2023 General Session was accelerated payments to the state’s debt service (above and beyond the required payments, which are under quite favorable terms) and a set aside for future buildings. Revenues that were considered “high risk,” (meaning they were considerably above trend) were used for highway debt and to build the State Building Infrastructure Fund. The concept being that these appropriations could be reversed if higher priorities (or any deficits) presented themselves. The cushion afforded by this strategy covers any deficits in the current fiscal year and also provides some flexibility for next year’s budgeting cycle, to the tune of $565 million one-time and $335 million ongoing.
Collections to the General Fund were up slightly compared to last month’s report, at +5.8% YoY. Unchanged were the top performers of Investment Income (up 1,000% YoY) and Oil and Gas Severance Tax (up 48% YoY). A handful of sales and severance tax earmarks had not posted as of this month's TC-23, suggesting General Fund deposits could be adjusted down slightly in coming weeks. Income Tax Fund collections fell by as much as 4.8% compared with this time last year. Withholding tracked the General Fund due to a strong labor market and rising wages, growing 4.9% over FY 2022. However, final income tax payments paled in comparison to last year, down almost 30% due to lower capital gains. The Transportation Fund has benefitted from travel season, along with the increased fuel tax rate implemented in January of this year, rising 7.2%.
As always, the close out period (Fiscal Period 13) requires a few months to finalize, and could increase or decrease these latest reported figures. LFA will post the final yearend report in October, along with the first revenue report of FY 2024.
The reports referenced in this post are available at the links below:
July Revenue Snapshot (FY 23)
Tax Commission Revenue Summary (Preliminary Yearend/Period 12, FY 2023)
Revenue Publications Archive
The Carrot, Not the Stick: Performance Based Funding for the Utah System of Higher Education
In addition to their base budget, Utah’s sixteen higher education institutions have the potential to increase annual funding in aggregate by $35 million beginning in FY 2025 if they meet certain performance goals set by the Board of Higher Education (board). The amount of performance funding is variable from year-to-year, and is defined in statute as the lesser of:
- any remaining Income Tax Fund after all other obligations are met; and
- 20% of the forecasted income tax revenue growth from targeted, high-demand, high-earning jobs as designated by the Department of Workforce Services and the Governor’s Office of Economic Opportunity.
However, starting in FY 2025, the legislature appropriated $35 million from unrestricted state funds (spurred partially by record FY 2022 collections) to the higher education system. The Legislature may opt to transfer this funding into the Performance Funding Restricted Account for later distribution to higher education entities during the 2024 General Session.
By code, 80% is allocated to degree granting institutions, and 20% is set aside for Technical Colleges. Institutions’ performance determines what proportion of their allocation they will earn based on their progress towards five-year performance goals.
The Board of Higher Education sets five-year goals for the entire Utah System of Higher Education (USHE) and each individual institution, which are designed to be complimentary. These five-year goals are then broken down into annual targets for each institution. Performance is measured on three major areas:
- access (the percent of Utah high school graduates participating in the system);
- timely completion (students completing their degree or certificate within 1.5 times the program’s standard schedule); and
- high-yield awards (degrees and certificates in fields with high-demand, high-earning jobs, as defined by the board).
The Legislature approves the systemwide goals and sets them in statute (UCA 53B-7-709). The table below shows the current goals for the timely completion metric according to institution:
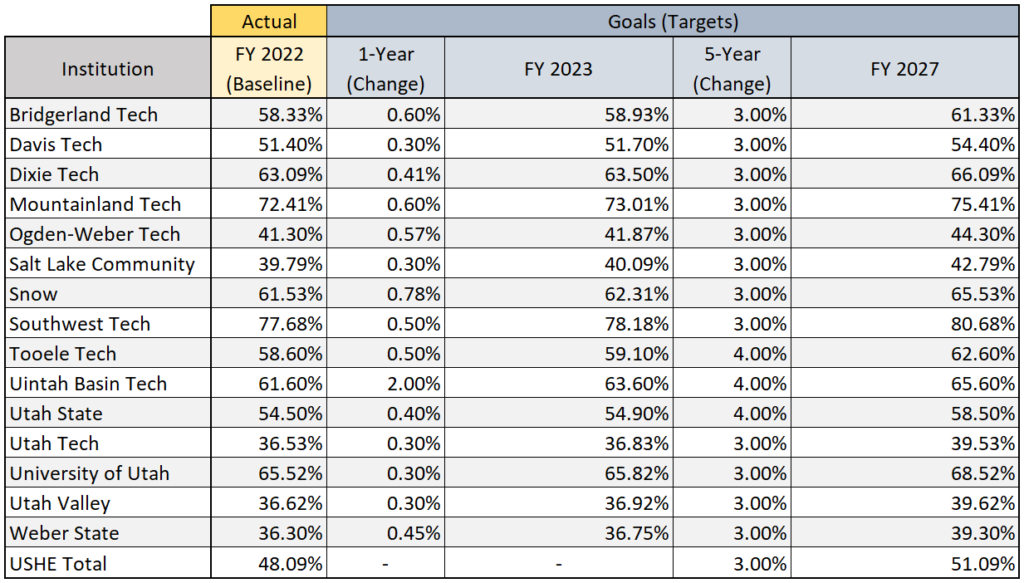
The FY 2025 ongoing appropriation will be distributed based on meeting 1-Year goals. If an institution meets or exceeds their goals, it will receive all their allocated performance funding. If an institution does not meet its goals but shows measurable progress towards the targets (increases of greater than zero), they will receive a proportional amount of their performance funding. Institutions not making progress towards their performance goals are not eligible for performance incentives. The board may reallocate leftover funding one-time from underperforming institutions to colleges or universities that meet or exceed performance goals. If an institution does not meet their performance target in a particular year, but later within the five-year period meets or exceeds their goals, the institution would be eligible to increase their ongoing appropriation to account for previously unearned performance bonuses.
The Cost of Counsel: A Look at the Attorney General's Internal Service Fund
Background
In response to a legislative audit during the 2016 General Session, the Legislature passed H.B. 351, "Attorney General Fiscal Amendments." This legislation provided the Office of the Attorney General (AG) the option to function as an Internal Service Fund, or "ISF." The AG began implementing its ISF during the 2018 General Session, concluding in the 2021 General Session. Specific to the Attorney General's Office, UCA 67-5-5 mandates that the AG hires and provides legal counsel for state agencies (except in certain situations). Following recommendations from the Office of the Legislative Auditor General in the 2015 In-Depth Budget Review, the Legislature adjusted the AG's budget to fit the ISF model. The Legislature also granted the Attorney General authority for a phased implementation of this new budget format. This transition concluded in Fiscal Year 2022.
What is an ISF?
Internal Service Funds are a government accounting model based on centralized resources. ISFs involve sharing services between different agencies where each participant is billed for the resources used. The money received for services is considered "intra-governmental revenue," an ISF's primary funding source. In Utah, other prominent ISFs are housed in the Department of Government Operations, including Technology Services and Facilities Management.
In an ISF, rates charged to users are set to cover the service costs without running a profit. The model aims to enhance state financial efficiency. ISFs help determine the true cost of government services, foster accountability, and provide accurate data for lawmakers, which supports informed decision-making. Agencies can weigh service benefits against its costs, creating market-like incentives. Like private businesses, agencies can adjust usage based on received value. Before this model, as highlighted in the 2015 audit, agencies lacked clarity on billing relative to their service needs due to the absence of a formal rate-setting process with legislative oversight.
Client Focused Budgeting
By design, agencies receive appropriations to cover legal expenses from the AG’s Office. If an agency requires additional legal services, they must request a budget adjustment from the Governor’s Office, which in turn has to be funded by the Legislature. This is a key distinction from the pre-2018 budget, because agencies determine their AG service-level and make budget requests which are prioritized in their respective subcommittees. This paradigm shift has taken some adjusting; prior to the AG ISF, the Attorney General would typically initiate and champion funding requests for additional services to an agency.
Funds received from client agencies are reflected as Dedicated Credits in the Attorney General’s budget (and in fiscal notes). Changes in service levels or rates require both an adjustment to the Dedicated Credits appropriation for the AG and changes to the total appropriation for agencies receiving services.
While funds received by the AG are booked as Dedicated Credits, these funds are comprised of a mix of revenue types that are dictated by the budget of the client agencies. During the 2023 General Session, “Attorney General Targeted Compensation Increases” provided $5 million one-time and $19.4 million ongoing for salary increases to the AG. Of that amount, $5.0 million one-time and $7.7 million ongoing were from state funds, and another 43 sources comprised the remainder of the funding mix.
It's Electric! Legislative Actions on EV Charging Infrastructure
As the transportation system becomes increasingly electric, the State of Utah has taken several preparatory actions including funding planning efforts and installation projects for electric vehicle charging stations. Multiple factors are driving this transition to "electric avenue" including Federal actions, market demand, and air quality on the Wasatch Front. Frequently cited as a barrier to electric vehicle adoption is 'range anxiety,' or the fear of being stranded between destinations without a plug-in to utilize. The list below includes legislative funding actions according to session that have incrementally worked to improve the electric vehicle network in the state of Utah:
2018 General Session
- Intent language allowed the Utah Department of Transportation (UDOT) to expend up to $200,000 Transportation Fund to partner with other entities to expand availability of infrastructure for emerging vehicle technology (House Bill 3, Item 137). UDOT leveraged this funding to apply for a grant from the Volkswagen settlement proceeds for $1.2 million, plus $160,000 in Rocky Mountain Power incentives. The total funding of $1.56 million was used to create a project to install fast DC chargers in 11 locations, and two of the locations (Price City and Kane County) now own and operate the chargers.
2019 General Session
- $4.99 million one-time to the Division of Air Quality from the General Fund for incentives for businesses and government entities to install electric vehicle charging equipment.
- $2.0 million one-time to the Department of Government Operations from the General Fund for the installation of electric vehicle charging stations at state-owned facilities.
2020 General Session
- $3.0 million one-time Income Tax Fund for the Advancing Sustainability through Powered Infrastructure for Roadway Electrification (ASPIRE) Center at Utah State University to match support from Rocky Mountain Power.
- The Legislature passed H.B. 259, “Electric Vehicle Charging Network” directing UDOT to lead in creating a statewide electric vehicle charging network plan to provide electric vehicle charging facilities along certain state highways.
2022 General Session
- $3.0 million one-time to the Office of Energy Development from the General Fund for a for a matching grant program for electric co-operatives to implement EV infrastructure in rural Utah.
- $127,700 ongoing to the Division of Air Quality from the Clean Fuel Conversion Fund to implement S.B. 188, “Energy Efficiency Amendments,” which expanded the Clean Fuels and Emission Reduction Technology Program to include grants and loans for electric vehicle fleets for businesses and electric charging stations.
- $15.0 million one-time to Utah State University (USU) from the Income Tax Fund for the ASPIRE program for electric vehicle charging and grid research.
- $18.0 million one-time from to USU the Income Tax Fund for research and development of electric mass transit and air quality effects.
2023 General Session
- $2.1 million ongoing to USU from the Income Tax Fund to implement S.B. 125, “Transportation Infrastructure Amendments,” which designated USU’s ASPIRE Engineering Research Center as the state’s lead research center for electric transportation initiatives.
Electrification of Transportation Infrastructure Steering Committee
S.B. 125 from the 2023 General Session also created the Electrification of Transportation Infrastructure Steering Committee to provide direction for the ASPIRE electric transportation system project director. The steering committee is comprised of relevant state agency heads and program directors, representatives from large transit districts and power providers, and the chair of the Industry Advisory Board (also authorized in the bill). The Industry Advisory Board may include representatives from 11 different named sectors, with discretion given to ASPIRE to add additional expertise as necessary. The purpose of the Industry Advisory Board is to assist the project director in implementing strategic planning and to contribute to the program’s annual report with industry insights. The Electrification of Transportation Infrastructure Steering Committee has already met twice this interim.
National Electric Vehicle Infrastructure (NEVI) Formula Program
In addition to state resources, Congress passed the Infrastructure Investment and Jobs Act (IIJA), which included the creation of the National Electric Vehicle Infrastructure (NEVI) formula grant program. UDOT has received $12.1 million to date and expects to receive $6.7 million each year for the next three years. The NEVI formula grant requires matching funds, which UDOT hopes to receive from private partners. Federal program administrators require that the first phase of the plan fill EV charging gaps on Utah's interstates and alternative fuel corridors (US-6 & US-191), which has yielded 15 site areas:
- Bluff;
- Cove Fort;
- Crescent Junction;
- Delle;
- Ivie Creek Rest & Picnic Area;
- Layton/Riverdale;
- Moab;
- Monticello;
- Morgan;
- Nephi;
- Price/Wellington;
- Tie Fork Rest Area;
- Thompson Springs;
- Tremonton/Ellwood; and
- US-40/US-80 Junction.
In Stock Now: Efficiency Evaluations Identify Opportunities to Improve DABS Inventory Management
Efficiency evaluations are a collaborative process between the Office of the Legislative Fiscal Analyst (LFA) and the Governor's Office of Planning and Budget (GOPB). The July 2023 efficiency evaluation of the Department of Alcoholic Beverage Services (DABS) identified opportunities to improve revenues by preventing empty shelves for top-selling products (a.k.a stockout) and avoiding losses from spoilage of low-volume products.
Efficiency Evaluations Aim to Improve State Government
In 2021, the Utah State Legislature enacted UCA 63J-1-904, establishing a cross-branch initiative focused on operational efficiencies and performance measurement. As a result, opportunities to improve efficiency throughout state government can be found in the four publicly available evaluations:
- (DABS) Inventory Management Efficiency Evaluation (July 2023)
- (UDOT) Transportation Technician Training Efficiency Evaluation (March 2023)
- (HHS) Office of the Medical Examiner Efficiency Evaluation (December 2022)
- (DTS) Low-Cost IT Procurement Efficiency Evaluation (October 2022)
Applying the principles of process improvement while building mutual trust, these products from the legislative-executive branch collaboration are designed to eliminate sources of waste and reduce errors. The goal of efficiency evaluations is not merely to cut costs, rather the intent is often to improve the quality of services provided to Utah residents and reduce stress placed on agencies in providing these services.
The recent evaluation of DABS pointed out that calculated values for inventory and forecasts are insufficient, increasing the reliance on human estimates. Automating data-driven tasks allows state employees to focus on services that provide greater value to customers. A similar situation was identified in the Office of the Medical Examiner, where a recommendation was made for employees to utilize data collection and automation to expedite publication time for their final reports.
DABS Inventory Management Best Practices
During the three-month evaluation, the team met with DABS to learn their process, conduct site visits to warehouses and stores, and reviewed agency data. LFA and GOPB staff worked with DABS to identify the process where improvement would generate the most value: inventory management and product selection; the processes that most directly impact DABS customers’ experience.
DABS has many successful inventory practices including their well-known automated warehouse. However, examples exist of best-selling items being out of stock and low-volume items being at risk of spoilage due to excess inventory. These situations can result in missed revenue opportunities and product losses, and potentially diminish the customer experience.
DABS shared an example where insufficient forecasting for special events almost scratched a popular bourbon selection for Kentucky Derby viewers in Utah. In this case, it required extra efforts from DABS staff down the home stretch to preserve this springtime customer beverage tradition. DABS’ stockpile of Stella Rosa Moscato demonstrates the opposite problem: with average sales of roughly 1,600 bottles per month, the nearly 35,000 bottles in the DABS warehouse (nearly 2 years expected supply) could lead to spoilage based on the product's recommended shelf life of 1-2 years.
DABS Recommendations
As detailed in the report, DABS’ inventory management practices have capacity for improvement, including the following recommended best practices:
- Fully utilize forecasting and planning software;
- Avoid rough estimates or ‘rules of thumb’—instead rely on calculated values;
- Adopt inventory models that match customer demand data;
- Extend DABS’ planning horizon for inventory; and
- Ensure data-driven decision making for the listing and delisting processes.
These recommendations should ensure that popular items are on DABS shelves when they are likely to be in the highest demand and avoid wasting of low-volume items.
It's Kind of a Money Story.. How the New Funding Follow-up Report for 2023 Answers All Your Questions
During the Legislature’s previous three general sessions, $2 to $3 billion in new funding has been appropriated each year for two to four hundred projects. In many instances, agencies spend the full appropriation, projects are fully implemented, and taxpayers are better served. However, this isn’t always the case, which begs the question: how can we provide accountability, transparency, and ensure new state funding is used in the way the Legislature intended? And what actions can legislators take when projects don’t go as planned?
The New Funding Follow-up Report is the answer to those questions. The 2023 report encompasses 359 projects and offers 118 options for appropriations subcommittees to consider in their October meetings. For example, over $250,000 in funds were left over after one agency fully implemented a project. The legislative financial analyst assigned to this agency recommended that their appropriations subcommittee reallocate the remaining one-time funds to a better use within the department—promoting fiscal responsibility in state government.
This Report Enables Stakeholders to Dive into Reported Results
This year’s edition was presented to the Executive Appropriations Committee on September 18, 2023 and summarizes $2.4 billion in new funding. Relying on data provided by various state agencies, the report highlights trends in spending, implementation, and performance for funded projects as shown below:
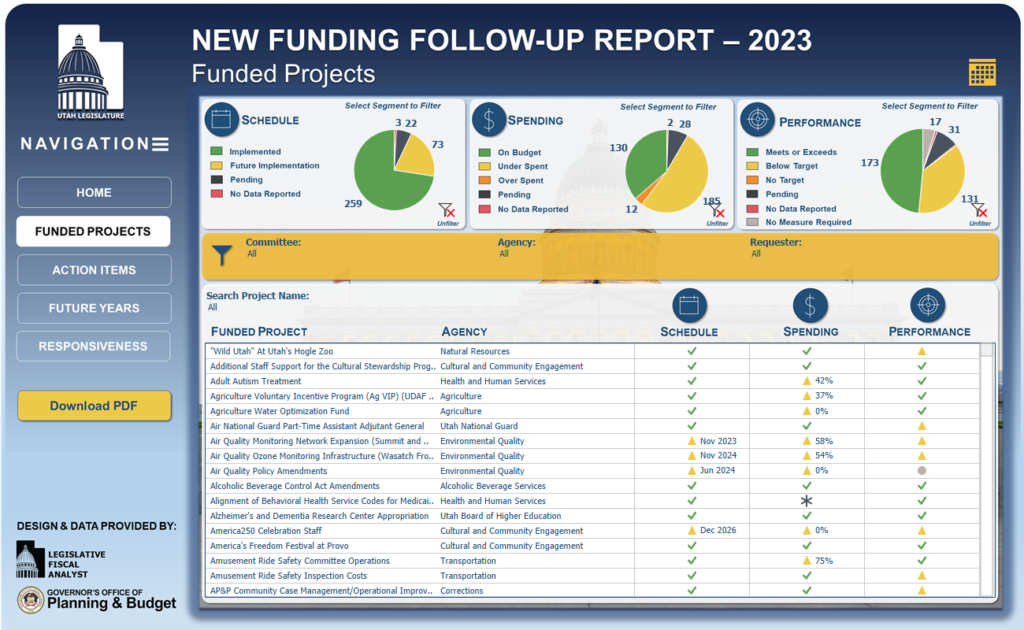
The report’s interactive structure using multiple dashboards allows legislators and stakeholders to drill down into reported data to assess where taxpayer dollars went. Was it all spent? Is the project complete? How were taxpayers better served by the results? This dashboard specifically allows users to filter based on results and follow-up on their areas of interest.
This Report Allows Analysts to Recommend
Additional Follow-up and Reallocation of Funds
Financial analysts staffing the Legislature’s seven appropriations subcommittees and EAC have synthesized the data represented in the New Funding Follow-up Report to present recommendations to the Legislature. Specific emphasis has been placed on implemented projects that did not spend their appropriation as well as projects with future implementation dates. These may require additional reporting after projects are implemented and data become available. All Utah legislators serve on an appropriations subcommittee and can download a copy of their analyst recommendations, which will resemble the excerpt shown below:
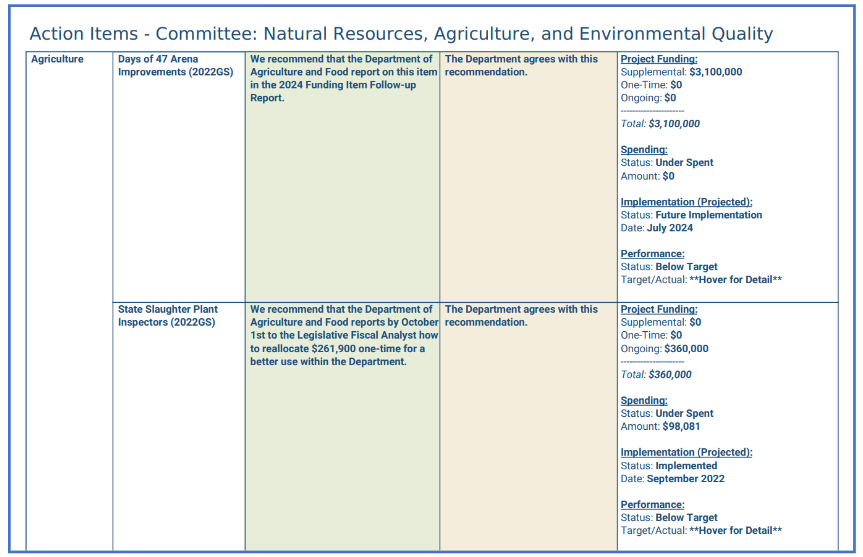
This Report Promotes Accountability for Multi-Year Projects
Infrastructure and other projects with the biggest price tags often correspond with the lengthiest implementation schedules, with reporting set for the year of their intended completion. We believe that this delayed reporting promotes accountability for Utah’s largest projects.
Accordingly, a new feature of this report tracks previously funded projects that are scheduled for completion in future years. The “Future Years” tab includes a breakdown of the reporting status for projects funded in the previous three legislative sessions, including $4.2 billion in funded projects that will be implemented and reviewed in the next few years.
As the Office of Legislative Fiscal Analyst strives to provide objective, accurate, and relevant budget advice, we believe that the 2023 edition of the New Funding Follow-up Report is a valuable tool that provides information, trends, and recommendations for legislators and stakeholders. This information can be utilized to promote accountability and fiscal responsibility.
Bend.. and SNAP! How Medicaid & SNAP Funding Have Changed Post-Pandemic
On March 1, 2023, the Department of Workforce Services (DWS) began reviewing all Medicaid cases for eligibility. Prior to this the federal government would not allow any State to disenroll Medicaid clients regardless of eligibility changes as part of its response to the public health emergency. From March until August, the department has reviewed 121,025 cases for eligibility. As of August 2023, the department has 167,728 cases still to review of which 37% are being held open because they are not following the normal eligibility process since the public health emergency. Further information can be found on the Medicaid website.
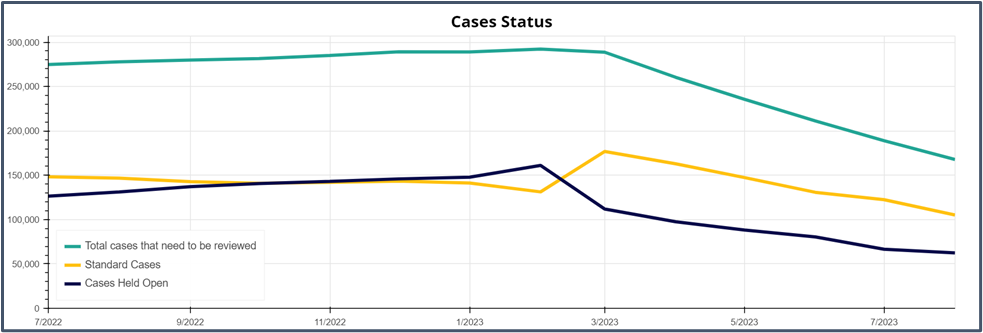
The continuous enrollment resulted in significant increases in Medicaid Enrollment. The program grew from approximately 320,000 individuals in January 2020 to approximately 532,000 individuals in April 2023. Continuous enrollment ended in April 2023 and Utah began the process of reviewing eligibility of all 532,000 individuals enrolled in Medicaid and the Children's Health Insurance Program (CHIP). This process involves determining if individuals are still eligible for Medicaid, CHIP, or need to transition to other coverage options, such as the federal health insurance marketplace. To help enrollees, DWS has created this landing page with details and resources.
When the federal government declared a public health emergency at the beginning of the COVID-19 pandemic, it allowed for additional monthly Supplemental Nutrition Assistance Program (SNAP) benefits. Emergency allotments allowed all SNAP households to receive an additional $95 in benefits or an additional benefit valued up to the maximum benefit for their household size, whichever value was greater. With the passage of the Consolidated Appropriations Act of 2023, remaining federally funded temporary emergency aid programs ended. As of March 2023, recipients received the monthly allotment they were eligible for based on household size and income, with one allotment being issued per month. It is important to note that the SNAP benefit amount is 100% federally funded and eligibility for the SNAP program did not change. Additional information and frequently asked questions regarding the program can be found here.
Additionally, the Able Bodied Adults Without Dependents (ABAWD) SNAP benefit will also undergo a change. The ABAWD SNAP benefit was available to able bodied adults without dependents for 3 months in a 36 month timeframe. ABAWD individuals were exempt from this time limit if they were 49 years old or older. With the passing of the Fiscal Responsibility Act of 2023, the ABAWD age exemption will be increased from 49 to 52 years old beginning October 1, 2023.
In partnership with the Utah State Board of Education, DWS administered the SNAP Pandemic EBT or P-EBT program. This program is for school age children who were eligible for free and reduced meals during SY 2022-2023. They were eligible to receive a one-time payment of $120 in P-EBT summer benefits to help offset the increased costs to families while children are out of school. Payments were issued in July 2023 for these families. DWS issued $25,050,000 in benefits for 208,731 students.
The SNAP P-EBT benefit is 100% federally funded and the payment was not a cash benefit, but rather was added to an EBT card and was restricted to food purchases. The SNAP P-EBT program has become a permanent program, renamed SNAP Summer-EBT. DWS and USBE are working together again to provide this benefit to eligible children in the summer of 2024.
2023 Update on ARPA
Starting in spring of 2020, the Federal government provided a series of stimulus packages aimed at mitigating impacts associated with the pandemic, injecting over $31 billion into the state of Utah for various purposes. The American Rescue Plan Act (ARPA) carried the largest portion of discretionary funding under the State and Local Fiscal Recovery Fund (SLFRF). The SLFRF's $1.38 billion in discretionary spending allows Utah policy makers to provide funding where they feel it’s needed within guidance (allowable uses) established by the U.S. Treasury. ARPA also provided a smaller discretionary pot of $137.9 million (about 10% of the SLFRF) to fund capital projects (called the Capital Projects Fund or CPF). Authorized uses of the SLFRF and CPF are discussed in this budget.utah.gov post from May 2022.
The Legislature has budgeted for (or appropriated) all SLFRF funds the state expects to receive, apart from a contingency reserve of $6.9 million. The totals according to budget category are listed below:
| Category | Budgeted |
| Covid Response | 223,799,040 |
| Economy | 184,454,638 |
| Education | 30,708,955 |
| General Fund | 332,773,900 |
| Infrastructure | 523,454,100 |
| Local Allocation | 75,735,262 |
| Reserve | 6,940,993 |
| Total | 1,377,866,888 |
ARPA discretionary funds carry the requirement to be obligated (contracted) by December 31st, 2024, and to be expended by December 31st, 2026. Unobligated funds are slated to be committed in FY 2024 as newly created programs come online. To date, the state has obligated $1.05 billion and expended $679.9 million of the SLFRF funds. The Governor’s Office of Planning and Budget updates the obligations and expenditures monthly.
LFA has summarized stimulus funds into the following categories:
- Budgeted: planned spending which describes an approved budget for a project, but has not necessarily been spent or contracted.
- Obligated: this category captures both expended funds and also orders placed for property, services, and awarded contracts /subawards.
- Expended: captures actual spending that has taken place.
| Budgeted | Obligated | Expended | |
| ARPA - SLFRF | 1,377,866,888 | 1,045,199,703 | 679,945,881 |
| ARPA - CPF | 137,895,435 | 9,838,937 | 315,621 |
| Coronavirus Relief Fund | 934,766,277 | 934,683,579 | 934,683,579 |
| FEMA | 278,683,983 | 278,683,983 | 278,683,983 |
| State Funds | 28,914,940 | 28,912,384 | 28,912,384 |
| Total | 2,758,127,523 | 2,297,318,586 | 1,922,541,448 |
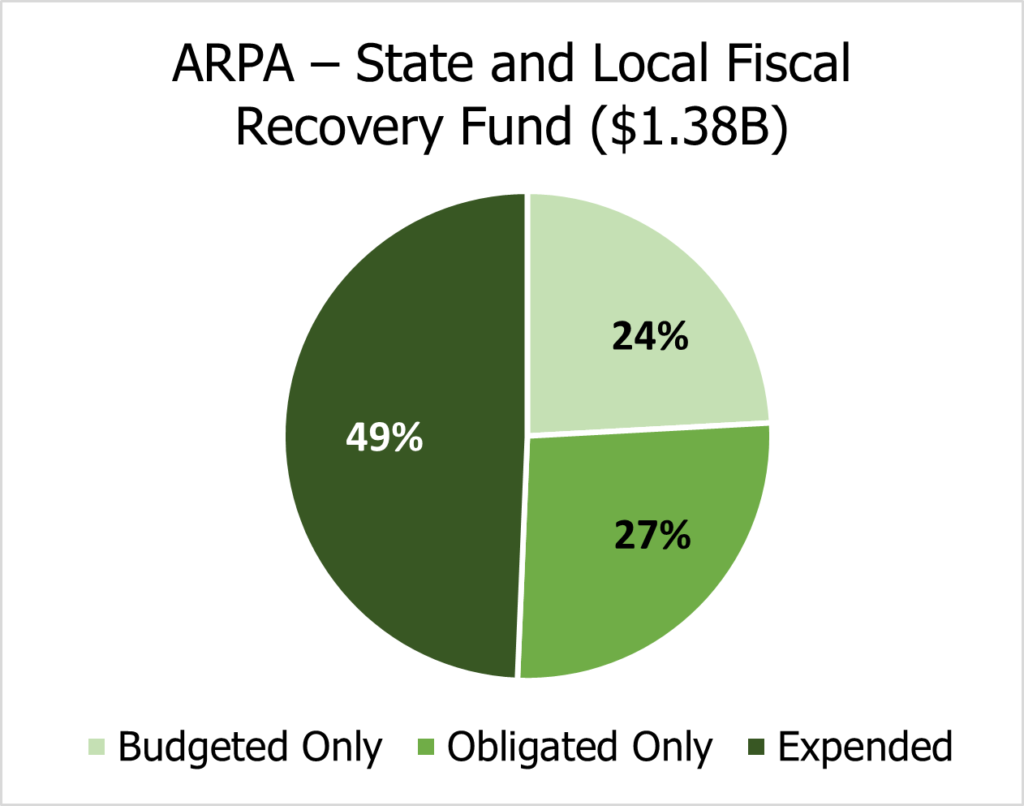
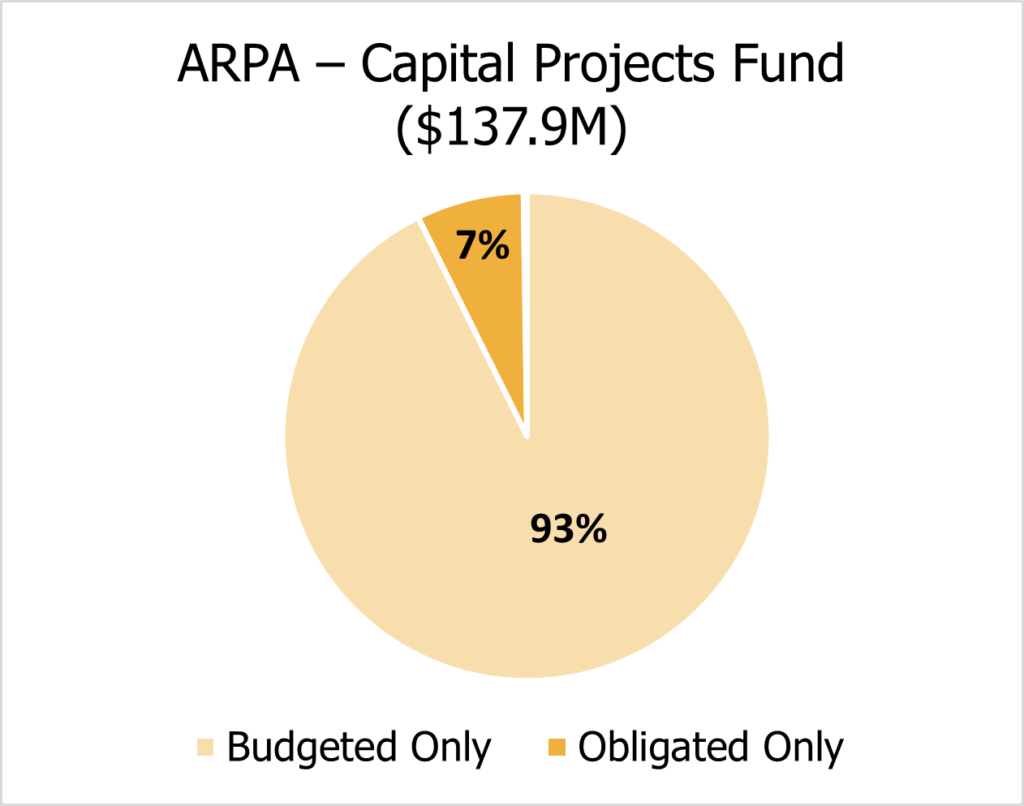
An updated list of projects that Utah has submitted for Treasury consideration of the state’s $137.9 million ARPA Capital Projects Fund allocation is detailed below. The CPF is limited to broadband expansion or investment in facilities that enable work, education, and healthcare monitoring. Final approval of CPF projects must come from the U.S. Treasury. The Treasury has approved the first four projects in the table below. The Wasatch Canyons Behavior Health Hospital and the University of Utah’s West Valley Community Center have been submitted to Treasury and are currently under review. The Legislature has reserved $5 million of the Capital Projects Fund as a contingency, which will be applied to an approved project before the 2024 obligation deadline.
| Capital Projects Fund | Budgeted | |
| 1) | Box Elder Crisis Shelter and Transitional Housing | 7,000,000 |
| 2) | Education and Telehealth Infrastructure | 19,295,400 |
| 3) | Middle Mile Broadband Projects | 46,600,035 |
| 4) | Rural Broadband Approved Funding | 10,000,000 |
| 5) | U of U West Valley Ambulatory, Health, Education and Community Center* | 25,000,000 |
| 6) | Wasatch Canyons Behavioral Health Hospital* | 25,000,000 |
| Total | 132,895,435 | |
| Unallocated | 5,000,000 | |
| Grand Total | 137,895,435 |
Initial Revenue Reports Less Spooky than Expected
On Tuesday, October 24th, the Tax Commission released the first revenue summary report for FY 2024, which details collections for the first quarter of the fiscal year. Along with that summary, the Legislative Fiscal Analyst and the Governor’s Office of Planning and Budget published the October Revenue Snapshot, comparing revenues to the consensus forecast. Through three months, performance to the General, Income, and Transportation Funds has outpaced expectations from revenue estimates forecasted in February, to differing degrees. (Economists are currently in the process of updating FY 2024 year-end revenue targets, which will be released in December.)
Unrestricted General Fund revenues totaled nearly $1.1 billion through October 7th. While Sales Tax contracted slightly (lagging the forecasted annual growth rate of 4.3%), investment income remains hot and has bolstered overall fund performance. Strategic budgeting has allowed previous years’ surpluses to increasingly insulate the state budget from economic slowing through investment of rainy day fund balances by the state treasurer. While rainy day funds are intended for major recessions, income from their investments provides the state increased flexibility during minor economic slowing. In total, collections to the General Fund outpaced the forecast by 0.7 percentage points, posting a year-over-year (YoY) growth rate of 3.1%.
Income Tax also came in ahead of expectations, posting (1.2%) YoY growth in contrast to the annual forecast of (4.8%). While final payments have decreased from this time last year, withholding remains strong, with collections still up 3.1% YoY despite the lower income tax rate (4.65%) passed during the 2023 General Session. While it’s typically too early in the fiscal year to see exactly how things will play out, through Q1, corporate income tax is almost 17 percentage points above the annual forecast.
The golden child for this month’s report is the Transportation Fund, posting 15.1% YoY growth compared to the forecast of 1.4%. All sources to the Transportation Fund posted double digit growth over FY 2023. Likely, this is due to a combination of the higher tax rate instituted in January of this year, 2023’s impact from the war in Ukraine, and finally shaking the pandemic’s influences on car and air travel.
As with all fiscal years, the first quarter growth rates will appear volatile, as relatively small nominal changes can result in large percentage swings, either up or down. As we draw nearer to key temporal points in the fiscal year (holiday shopping season, pass-through entity payment deadlines in December, etc.), Legislative economists will have better information with which to hone economic forecasts prior to important budgetary decisions.
The reports referenced in this post are available at the links below:
October Revenue Snapshot (FY 24)
Tax Commission Revenue Summary (Period 3, FY 2024)
Revenue Publications Archive
Interim Recap: Outcomes of the 2023 Accountable Budget Process
During the 2019 General Session, the Legislature passed H.J.R. 18, which amended Joint Rule 3-2-501. The bill requires each of the seven topical appropriations subcommittees to scrutinize twenty percent of their assigned budgets in a practice called the Accountable Budget Process (ABP). The goal of this interim review is to come away with an Accountable Process Budget, which becomes the base budget for reviewed agencies during the following general session. Examining budgets during the "offseason" provides a leg up for policy makers and staff ahead of the fast and furious 45-day General Session.
Each May, Subcommittees submit their plans for the ABP to the Executive Appropriations Committee, detailing 5-year plans to review each line item in their purview. This process started in 2019, with a one-year hiatus during the 2020 interim. In 2024, the ABP will be in its fifth year, completing the full cycle of reviewing the entire state budget. For a bit more detail on the ABP, see this post from June 2022.
During the 2021 General Session, the Legislature passed S.B. 142, “Public Education Funding Amendments” which directed the Public Education Appropriations Subcommittee to complete an evaluation of the funding structure for public education in lieu of the ABP. UCA 53E-1-202.2 outlines two phases for the evaluation, with specific study items for the committee to consider, and then report their recommendations to the Executive Appropriations Committee.
2023 Accountable Budget Process Outcomes
In the table below, you’ll find documents linked to recommendations considered by each subcommittee along with a summary of actions taken. (Mobile users may view this table better in landscape orientation.)
| Appropriations Subcommittee | Agencies Reviewed | Recommendations | Voting Results |
| Business, Economic Development, and Labor | DABS, Insurance, Public Service Commission | Recommendations Document | Approved items 5 and 6. |
| Executive Offices and Criminal Justice | Incarceration (Post-Adjudication) | Recommendations Document | Took no action, will revisit recommendations in the General Session. |
| Higher Education | Budget reflecting all sources of revenue and expenditure | 1. Recommendations Presentation 2. EAC Presentation | Accepted all recommendations. |
| Infrastructure and General Government | Capital Budget, Department of Government Operations non-ISF programs | Recommendations Document | Accepted all recommendations, removing “DGO” from items 11b and 11e. |
| Natural Resources, Agriculture, and Environmental Quality | Office of Energy Development, Water Rights, Water Resources Funds, Wildlife Resources | Recommendations Document | Accepted recommendations 9-20. |
| Public Education | Minimum School Program and Performance Measures for Education | Motions on Interim Study Items | Approved items 1,2, 4 and 5, and to discuss item 3 during session. |
| Social Services | Medicaid Administration, Workforce Operations and Policy, Office of Recovery Services, Aging and Adult Services | Recommendations Document with Results | Approved recommendations in the document. |
The Real Return to Normal: FY 2023 Financial Highlights and Latest Revenue Reports
On Friday, November 17th, 2023, the Tax Commission released their Revenue Summary report, detailing collections through four months of the fiscal year. Concurrently, the Legislative Fiscal Analyst and the Governor’s Office of Planning and Budget jointly published their Revenue Snapshot for November, which compares updated revenue figures to consensus revenue estimates from February of this year. At the Executive Appropriations Committee (EAC) Meeting on December 5th, new revenue estimates will be adopted based on the latest economic data, to better inform lawmakers as they enter the legislative session.
Through November 7th, revenues to all sources are just above the forecast, holding very close with the exceptional collections from FY 2023 (red line in the chart below). While October saw a slight uptick in both the General and Income Tax Fund performance, economists anticipate lower quarterly and final payments (dashed green line), due to reduced wage growth and tax cuts passed during the 2023 General Session (H.B. 54). This, along with any underperformance in sales tax, may have the effect of eroding the benefits from investment income discussed last month.
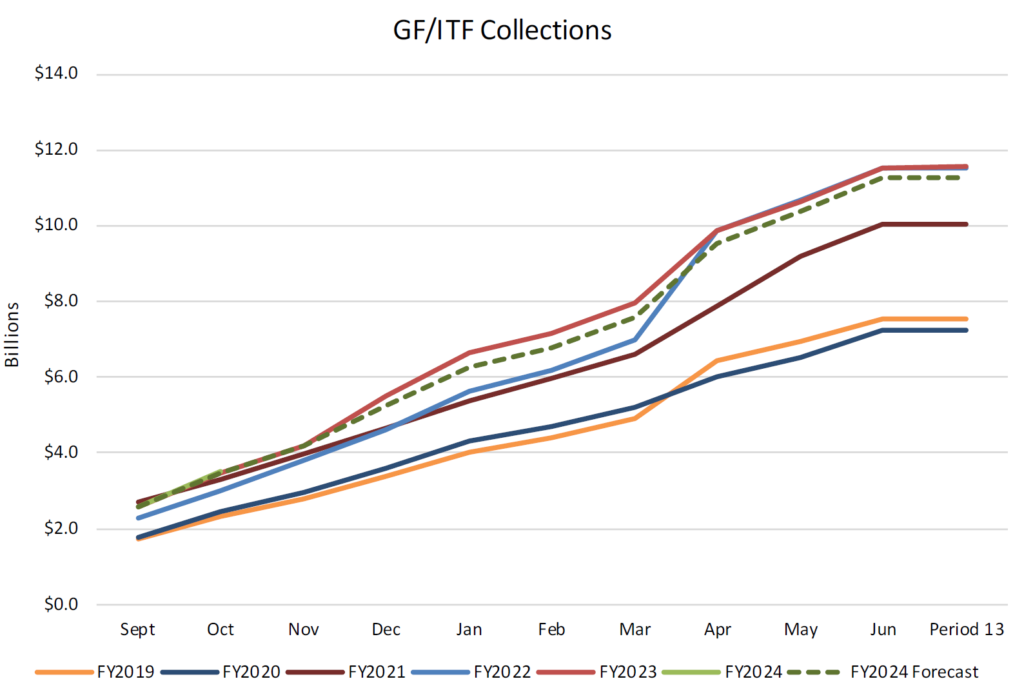
During their November 14th meeting, EAC received FY 2023’s Financial Highlights from the Division of Finance. The report summarizes collections and expenditures for major revenue sources and programs. In FY 2023, the General Fund ended the year with a $69.3 million surplus, while the Income Tax Fund closed with a ($119,187,000) deficit. The combined ($49.9 million) shortfall will be covered by a appropriation made to the State Building infrastructure Fund; a budget decision which was intentionally dependent on final collections, knowing that this one-time revenue was considered high risk (or considerably above trend). As summarized in our post from July, Highway Debt and State Buildings are two budget contingencies that will afford policy makers some flexibility in a year with limited new revenues.
The reports referenced in this post are available at the links below:
November Revenue Snapshot (FY 24)
Tax Commission Revenue Summary (Period 4, FY 2024)
Revenue Publications Archive
Plane and Simple: Budgeting for the State Air Fleet
The Utah Department of Transportation’s Aeronautics Division currently owns two airplanes: a King Air C90 (purchased in 1999) and a King Air B200 (purchased in 2000). These planes are available for agencies and officials to use to conduct state business. Additionally, the Department of Transportation (UDOT) leases two hangars and office space (approximately 19,000 square feet) at the Salt Lake City International Airport. The Department of Public Safety and the Department of Natural Resources also own aircraft and sublease hangar space from UDOT.
UDOT can schedule and reserve flights for state agencies to St. George, Moab, Cedar City, Vernal, Richfield, Price, Logan, and Kanab. State agencies are billed a subsidized fee to use the plane, which goes toward expenses of operating the planes. In Fiscal Year 2023, operating and maintenance for both planes totaled $836,900 and UDOT collected $192,000 in user fees.
In the 2022 General Session, the Legislature passed Senate Bill 166, “Aviation Amendments,” which directed UDOT to study alternative methods for user charges of the state air fleet and incrementally reduced the amount that could be used from the Aeronautics Restricted Account for operation and maintenance. The bill also created the State Aircraft Restricted Account, which will fund all operation and maintenance costs for the state airplanes starting in fiscal year 2028.
The Aeronautics Restricted Account primarily consists of funds from aviation fuel tax, aircraft registration fees, appropriations. The account can be used for the construction, improvement, operation, and maintenance of publicly used airports in this state, the payment of principal and interest on certain debt, operation of the UDOT Division of Aeronautics, promotion of aeronautics in the state, and UDOT administration costs. Per S.B. 166, the Aeronautics Restricted Account cannot be used to purchase an airplane or subsidize operating and maintenance costs after fiscal year 2027.
The new State Aircraft Restricted Account consists of fees UDOT collects for use of state-owned aircraft, appropriations, contributions from public and private sources, and interest income. Funding in the account is authorized to be used for the operation and maintenance of state-owned aircraft.
During the 2022 interim, UDOT made a presentation to the Transportation Interim Committee outlining user fees, including an alternative option for setting these fees. During the 2022 and 2023 General Sessions, the Legislature appropriated General Fund into the new State Aircraft Restricted Account to offset user fees which do not cover the cost of operating and maintaining the airplanes.
In the 2023 General Session, the Legislature appropriated $7.0 million in House Bill 3, “Current Fiscal Year Supplemental Appropriations,” (item 28), for UDOT to purchase a plane. The following intent language was attached to the appropriation:
The Legislature intends that up to $7,000,000 provided by this item be used to replace the Department of Transportation's (UDOT) two existing King Air airplanes with a single aircraft of similar capability. The Legislature further intends that UDOT transfer the existing King Airs to Utah Valley University (UVU) for use in state aviation instruction programs. UVU shall partner with other institutions to provide training and experience in twin engine fixed-wing aviation throughout the state. UVU shall also occasionally offer the use of these aircraft to UDOT and the State of Utah as back-up to the new state plane. The Legislature intends that UDOT and UVU report progress on the above transactions to the Executive Appropriations Committee before October 1, 2023.
In the report submitted to the Executive Appropriations Committee, UDOT stated that a contract has been signed and the new plane should be delivered in December 2024. UDOT is not planning to transfer the two existing planes to Utah Valley University until the new plane is delivered. Additionally, UDOT made a recommendation for a modified transfer scheme, which would allow them to retain one of the two existing King Air planes. The Legislature will consider this recommendation during the 2024 General Session.
'Tis the Season: Budget Season 2024 gets Underway
On Tuesday morning, Governor Spencer Cox released his budget recommendations for Fiscal Year 2025. The Governor stressed "people, growth, and good government", asking legislators to prioritize funding for housing and homelessness, mental health services, education, and employee compensation. The Office of the Legislative Fiscal Analyst annually provides a summary for the nearly 200 pages of recommendations, available here.
On Tuesday afternoon, legislative leaders met in the Executive Appropriations Committee (EAC) to kick-off the Legislature's budget process. The committee heard several reports on state revenue volatility that conclude our collections are returning to a more typical and sustainable pattern. EAC also heard how the $20 million savings due to declining K-12 enrollment will be more than offset by the $44 million in new costs from expanded special education rolls and longer kindergarten days, on top of an additional $165 million in inflationary pressure. Legislative staff also detailed how the unwinding of a federally-imposed freeze on Medicaid rolls will save Utah $103 million one-time and $43 million ongoing in state dollars over the next year and a half.
As is customary in December, appropriators adopted new revenue estimates reflecting 3% year-over-year growth. They voted to fund mandatory costs and take mandatory savings in base budgets, resulting in an overall decrease in subcommittee spending targets. Legislative leaders then set-aside newly available resources for a potential tax cut, employee compensation, and significant infrastructure improvements.
Unwrapping December's Revenue Report with Cautious Optimism
On Friday, December 15th, the Tax Commission published their monthly revenue summary (detailing collections according to tax type) in conjunction with the Revenue Snapshot from the Legislative Fiscal Analyst and Governor's Office of Planning and Budget (comparing collections to revenue estimates). Through five months of the fiscal year, the state's General, Income and Transportation Fund revenues totaled just over $4.5 billion, up 2.1% over the same time last fiscal year. The most recently updated yearend projection for all state sources expects to have a slight contraction from last year's astronomical revenue.
General Fund performance continues to squeak past expectations. While sales tax growth has been weak, other sources of revenue are doing well, which may suggest that people are spending less on goods and more on services. We will find out the coming months if last minute holiday shoppers can buck this trend. As with last month, the star performer for the General Fund is investment income, up 156% over FY 2023. Severance Tax from all extractive industries is down roughly 35%.
Individual Income Tax lags, posting a (2.3%) reduction from last year at this time. Withholding growth has slowed but remains positive, a testament to the labor market in Utah. Corporate Tax is also up 27.8% over FY 2023, far exceeding the annual expected negative growth rate of (4.8%). The General Fund's anticipation provided by the the holiday shopping season is now rivaled in the Income Tax Fund by SALT payments. Quarterly state and local tax (SALT) prepayments should show up in January's report and will provide a better picture of the Income Tax Fund performance.
As always, the first half of any fiscal year is quite volatile and makes comparisons difficult. December's report details collections that took place in November for sales and wages that were collected prior to that time. When the Legislature convenes in January, economists will again revise revenue estimates to ensure the state adjourns with a balanced budget.
The reports referenced in this post are available at the following links:
December Revenue Snapshot (FY 24)
Tax Commission Revenue Summary (Period 5, FY 2024)
Revenue Publications Archive
Confetti and Customer Service: Legislative Performance Initiative Rings in 2024
As the Legislature kicks off the 2024 General Session, many budget discussions will focus on how the Legislature can allocate funding to facilitate solutions. Meanwhile, the Legislative Fiscal Analyst's (LFA) Performance and Operations team will focus on improving internal processes for working with agencies that implement appropriated funding. A crucial step of process improvement is identification of problems, not just symptoms. Enter the 'Seductive Seven'; alluring would-be solutions which may not actually address underlying problems. They include simply adding:
- Technology
- Data
- Money
- Strategic Planning
- Reorganization
- Training
- Balance/Accountability
While these may superficially appear as solutions and offer short-term benefits, eventually core problems will resurface. As well intentioned as these approaches can be, they can mask the underlying cause and create an opportunity cost, where resources are used to address the symptoms rather than resolving the problem.
Avoiding the Seductive Seven
The LFA Efficiency Evaluation of the Medical Examiner’s Office demonstrates the allure of the Seductive Seven. The problem was simple—the Medical Examiner’s Office was not meeting professional timeliness standards for autopsy reports. A quick assessment of the situation may suggest additional funding to hire more pathologists as the solution. However, operational solutions were identified that could be implemented within existing budgets, such as:
- Improving the process of information collection to avoid delays,
- Delegating administrative and case management tasks differently, and
- Protecting pathologist time from unrelated interruptions.
While the Seductive Seven require additional resources, Efficiency Evaluations use operations improvement techniques which can typically provide a solution within existing constraints.
'TOP' Frameworks Focus on the Customer
As W. Edwards Deming said, “a bad system will beat a good person every time.” With this sentiment in mind, LFA's Performance and Operations team participated in the Transformational Operations and Performance (TOP) program offered by the University of Utah’s David Eccles School of Business during the 2023 interim. TOP is one of many process improvement techniques used during Efficiency Evaluations. The TOP certificate program focuses on process improvement within government systems. The Performance and Operations team adapted principles taught in the course for various operations within LFA in addition to the Efficiency Evaluation process. TOP principles were also key in producing the Medical Examiner’s Office evaluation in partnership with the Governor’s Office of Planning and Budget.
Focusing on why a process exists within a larger system is critical to identifying opportunities for improvement. Understanding the why requires identifying a primary customer. In government, customers are referred to as taxpayers, inmates, students, clients, drivers, residents, etc. The Performance and Operations team asks five questions when identifying a primary customer:
- Who is being served?
- What is their primary need?
- Why can’t non-government organizations better fulfill this need?
- What problem is being solved by executing the process?
- How do we know if our system is performing better or worse?
Knowing your customer is key to underlying cause of breakdowns in a process. In the case of the Medical Examiner’s Office, the agency was viewing the primary customer of their final autopsy report as the family member of the deceased. However, entities such as law enforcement, attorneys, or insurance companies use the details of these reports more frequently than families. Identifying the correct primary customer requires a clear understanding of the end user for any product. While families of the deceased should be an important consideration in the process (or 'strategic partner'), it was key to diagnose that they were not the primary customer for this particular report.
The Rules of Flow
After defining the primary customer, another critical step in process improvement is identifying the constraint. While constraints are typically thought of as the limiting factor, they can also be the biggest lever to improve results. Constraints control the speed and quality of the process and are often the most expensive or resource-intensive step.
In the Medical Examiner’s Office, pathologists are key to getting autopsy reports completed. Additionally, there are certain tasks that only pathologists can perform given their training and expertise. As such, the resource of pathologists' time is both expensive and critical to producing the goods and services of the Medical Examiner's Office. After identifying the constraint, best practice is to prioritize and build a system around the resource to ensure that it is utilized efficiently.
The TOP class provided the Performance and Operations team with the 'Rules of Flow,' which are strategies to help prioritize constraints and ensure that all other steps in a process are designed around these limited resources. Returning again to the example of pathologists' time in producing final autopsy reports, it was recommended to reduce or eliminate administrative work which can be performed by alternative staff, retaining pathologist time for tasks requiring their specific expertise. The Office can continue to improve the flow-through of their process by utilizing administrative staff to ensure all information required by the pathologist is ready, such as investigative and toxicology reports.
LFA looks forward to working hand-in-hand with state agencies to improve government services for the citizens of Utah. In the new year, the Performance and Operations team will be focused on applying the Rules of flow, identifying primary customers, avoiding the Seductive Seven, and providing updates on budget.utah.gov.
You can read the 2023 annual update for the Performance and Operations team along with past reports here.
COBI. This is the Way.
We Budgeteers of the Legislative Fiscal Analyst are over-the-moon about this year's edition of the Compendium of Budget Information (COBI)! Of course, we are also over-the-moon about the return of Mando and Grogu later this year. We're the staff office whose conference room is named after a popular space opera, after all. Consider the source.
COBI.utah.gov is designed to answer these five questions about every line item in the budget:
- What is it? (Overview)
- How has it changed? (Overview and Background)
- What is it accomplishing? (Performance)
- What are the details? (Financials)
- What do I need to decide? (Issues)
Getting Started
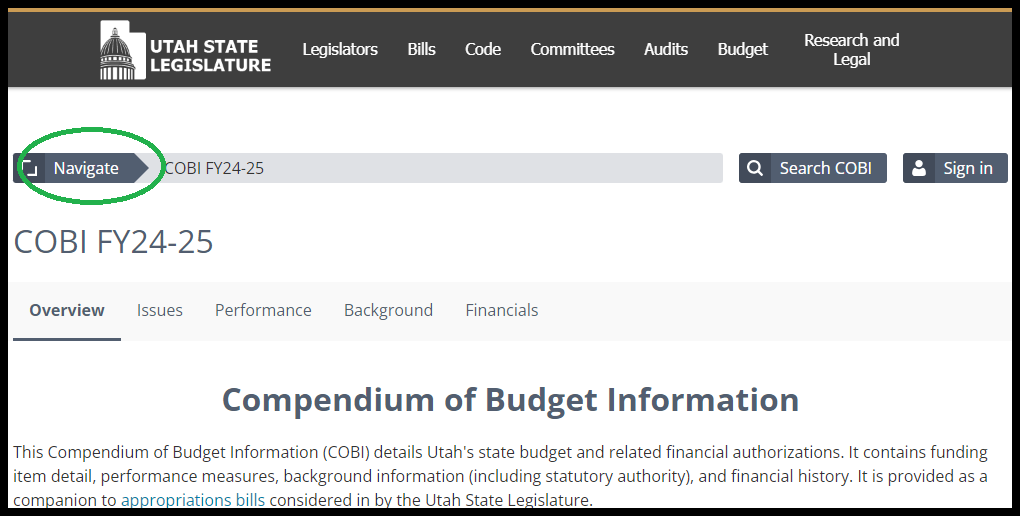
COBI is organized according to our budget's structure. To browse, click "Navigate" in the breadcrumbs at the top left of the page. This allows you to drill down through appropriations subcommittees, agencies, line items, and programs. The COBI Archive will show you previous versions of COBI from past sessions.
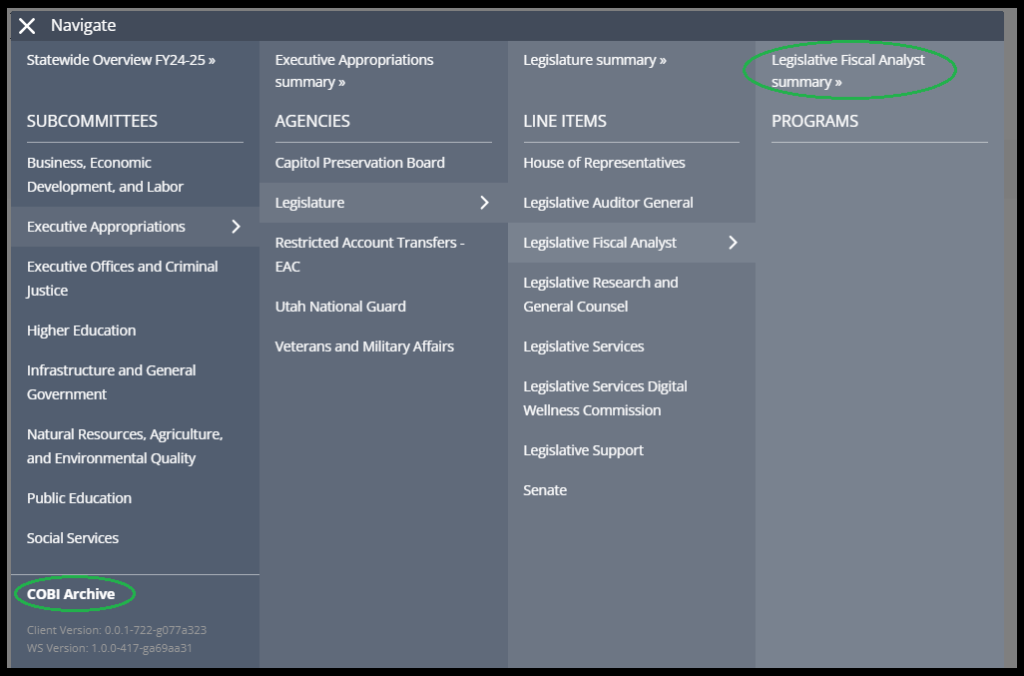
These are the Droids You're Looking For
If you're not sure where a program, function, or funding item falls within the budget structure, click the "Search COBI" button in the upper right corner and enter your search terms in the pop up.
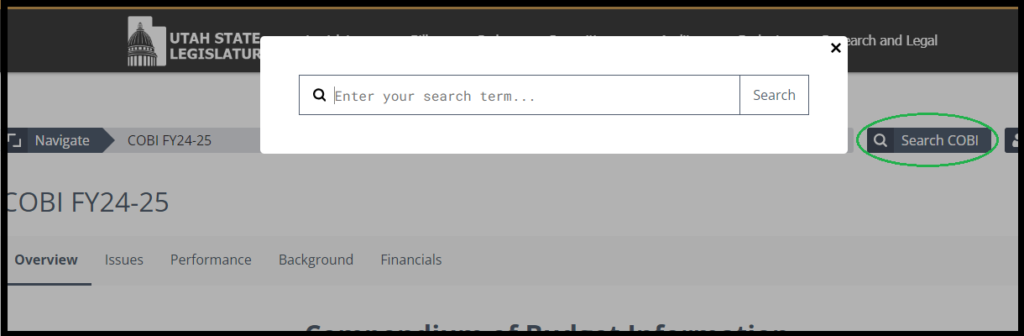
Let's say you are searching for a funding item from a past session, and you remember that it involved "cyber task force" (putting multiple words in quotes). Typing what you remember in COBI Search box, you will see results from all of COBI. The search results let you select multiple years, if you aren't sure which session the funding item was from.
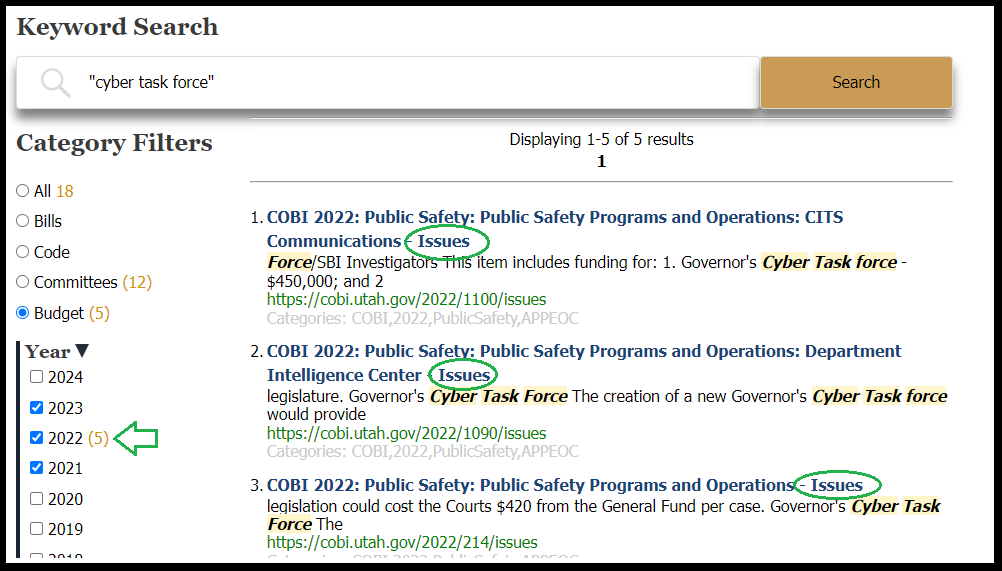
If you're looking for a specific funding item from the current budget cycle, head to the the "Issues" tab and enter the funding item name or another search term next to the spyglass under the "Description" heading. You can also filter for items that were requested versus ultimately funded. The headers of each category allow you to sort results (in the example below, sorting by one-time funding).
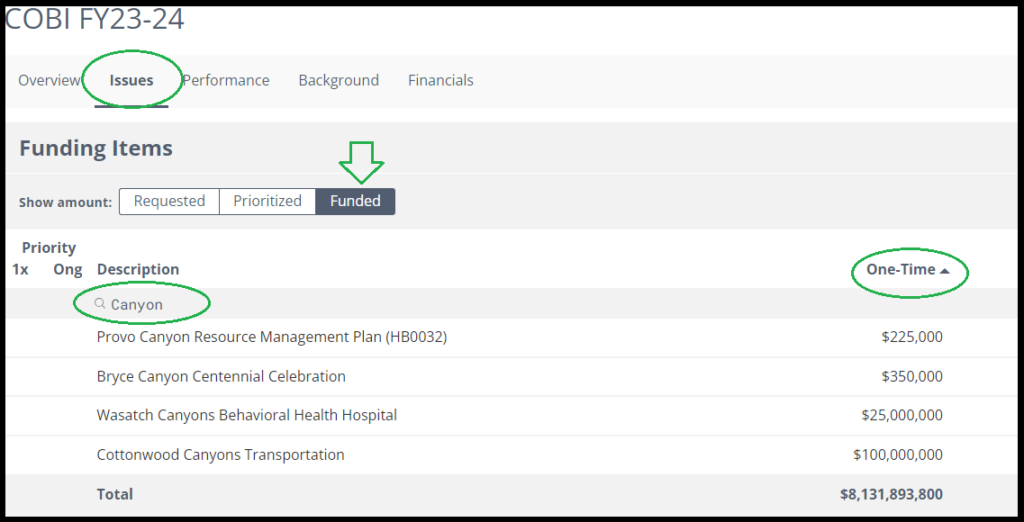
A New Hope
COBI's latest feature is also nested on the issues tab: fees proposed by agencies! The link to this new feature can be found under "Other Action Items" on the Issues tab for your agency of interest. This feature shows all the fees that an appropriations subcommittee will vote on during the 2024 General Session.
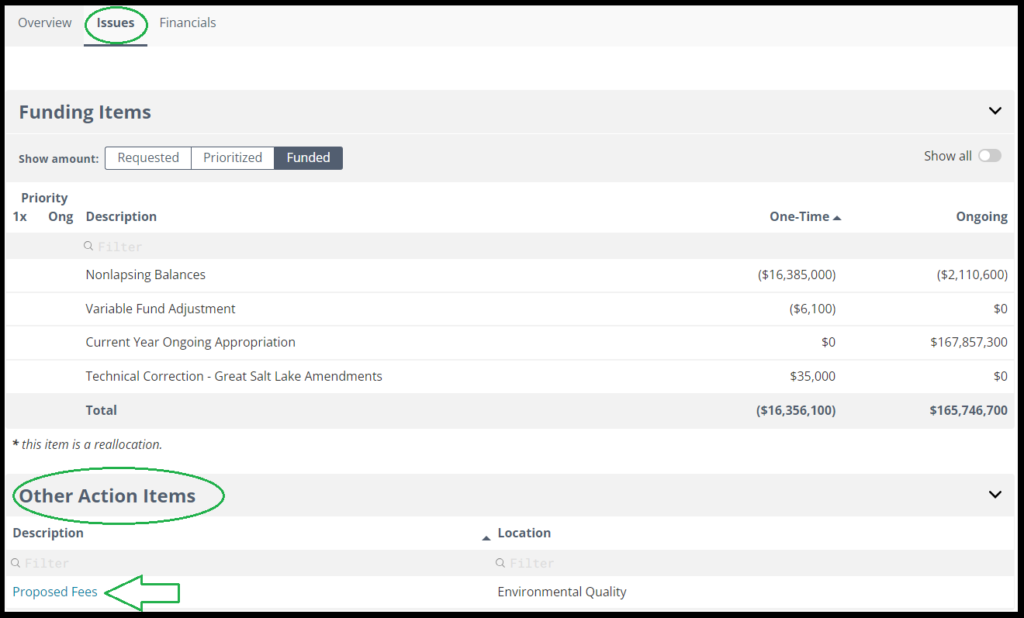
Clicking the proposed fees link shows all the fees that will included in H.B. 8 (forthcoming) for a particular agency. A hyperlinked fee on this list means the agency is proposing a new fee or proposing to change the fee amount.
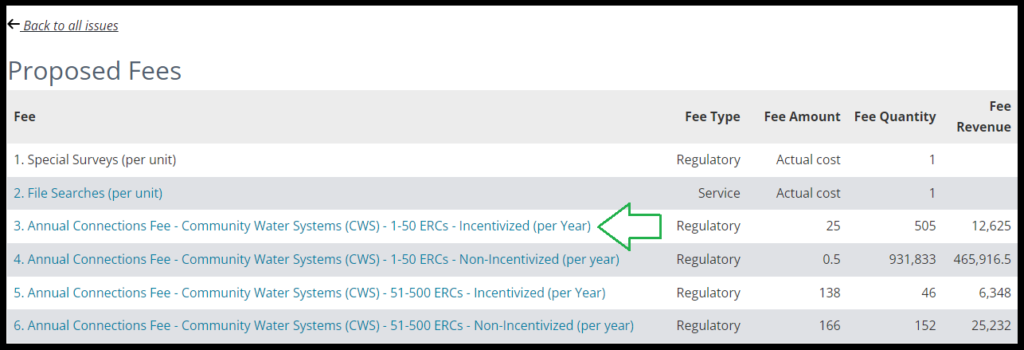
The linked titles for new or changed fees show additional required information like the fee's purpose, how the agency calculated the fee amount, and what other fees are in a particular program.
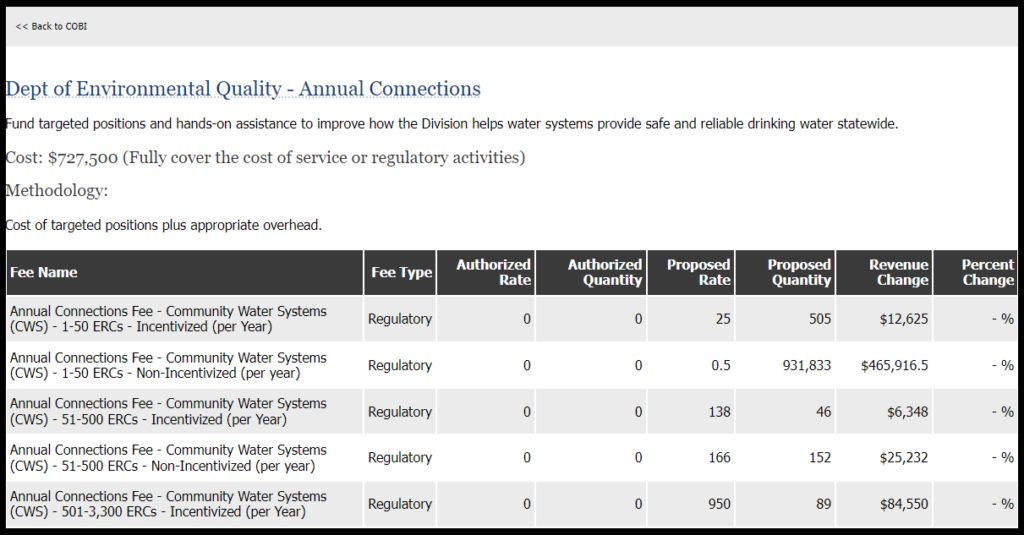
Help Me, Obi-Wan Kenobi
This helpful 'How To' video on all things COBI provides an in depth look into the layout and functions of the site. If COBI doesn't have what you're looking for, try one of our many other offerings at budget.Utah.gov. If you need help, you can always call, email, or text your LFA staff. We're also happy to talk about the upcoming season of The Mandalorian, if you're interested.
If Wishes Were Fishes: Balancing Revenues and Requests
Revenue Updates
Earlier this week, the Tax Commission released the latest revenue summary, detailing collections through January 8th. This month's report captures sales and wages from the first half of the holiday rush. Accordingly, it's no surprise that Sales Tax revenues ticked up slightly from December's revenue recap. In all, collections to the General Fund grew 4.5% over the same period in FY 2023. As we've discussed throughout this fiscal year, investment income from rainy day fund balances continues to be a top performer for the General Fund.
Last month, we waited in anticipation not only for these holiday-associated revenue bumps, but also for the year-over-year comparison of quarterly prepayments of State and Local Taxes (SALT) from Pass-through entities. The biggest change from last month was Final Payments surging by 40 percentage points, improving to be effectively identical to last year at this time. Combined with positive withholding, this paints a strong picture for Utah's labor market.
In total, revenues to all state funds are up 3.6% over the same time last year. The current yearend expectation for these funds is to contract slightly from FY 2023. Economists will update revenue estimates in late February, before appropriations bills are drafted.
Requests for Appropriation
Revenue estimates impact the ability of the Executive Appropriations Committee (EAC) to consider and ultimately fund Requests for Appropriation (RFAs). RFAs are used to fund programs and projects that are not associated with current legislation (Fiscal Notes are used to fund the impacts of policy changes). While the last few General Sessions presented the challenge of effectively using large surpluses, this year revenues look more 'typical.' Utah is constitutionally bound to end the session with a budget balanced to available revenue. As such, this year legislators face the once familiar challenge of living within Utah's means.
By legislative rule, RFAs are due the 11th day of the General Session at 12pm (next Friday, January 26th, 2024). Appropriations subcommittees will hear requests during their meetings over the next three weeks before presenting EAC with a prioritized list to consider. For more information on Requests for Appropriation, check out this post from last session: The ABCs of RFAs.
As of publication, there have been 89 RFAs assigned to a committee for a total ask of $160.6 million one-time and $50 million ongoing.
The reports referenced in this post are available at the following links:
January Revenue Snapshot (FY 24)
Tax Commission Revenue Summary (Period 6, FY 2024)
Revenue Publications Archive
Requests for Appropriations by Legislator
Metrics that Matter: Performance in the Budgeting Process
Management expert Peter Drucker said, “what gets measured, gets managed.” As a state, Utah is committed to wisely using state dollars in order to provide effective services. Recently, state agencies have been refining their strategic plans to better communicate a path to serve citizens (see executive branch agencies strategic plans). This effort focuses on the management side of the equation—ensuring that missions of programs and divisions support the overarching objectives of departments.
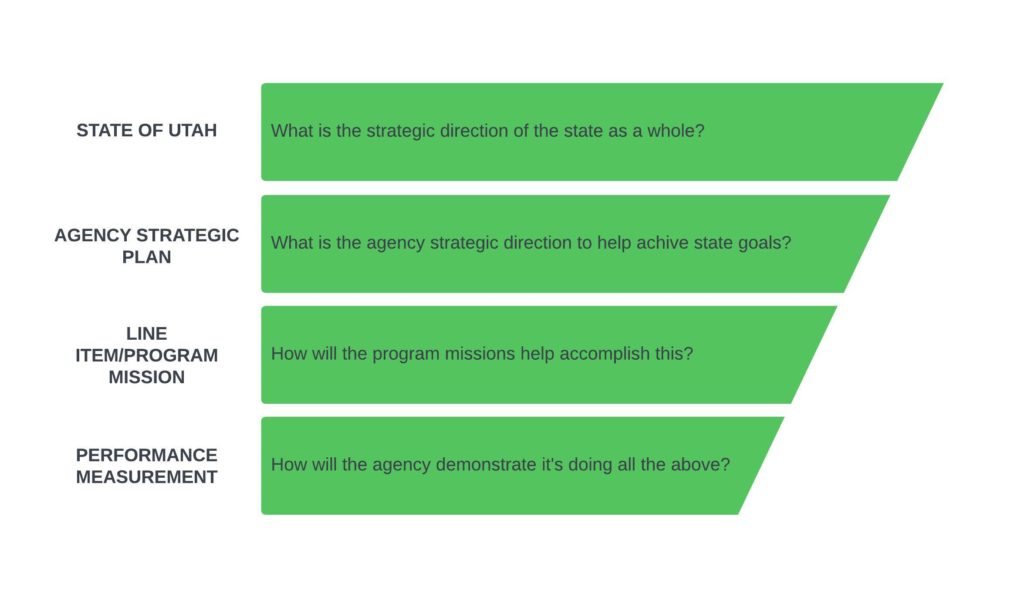
A similar level of alignment is needed for performance measures; they serve as a critical feedback mechanism on how ground level operations are contributing to the objectives of a division, whose contributions roll up to the effectiveness of an agency. As such, performance measures indicate to managers, legislators, and the public whether programs are moving toward an end goal. They should also show how programs are serving citizens, in addition to being a resource for making funding and policy decisions.
There are many approaches that help align performance with strategic direction. One example from a state agency that illustrates this alignment well is Results-based Accountability (RBA). RBA is an framework where each layer of action rolls up to create a unifying message that can be understood in the broader context of budgets. RBA activities can be viewed as working together as one system.
An example of how an organization’s strategic plan and performance metrics can align can be seen in the Department of Health and Human Services (DHHS). They have identified fragmented systems as a barrier to care. Their vision is to serve all individuals and communities in Utah to ensure they live safe and healthy lives through “effective policy and a seamless system of services and programs.”
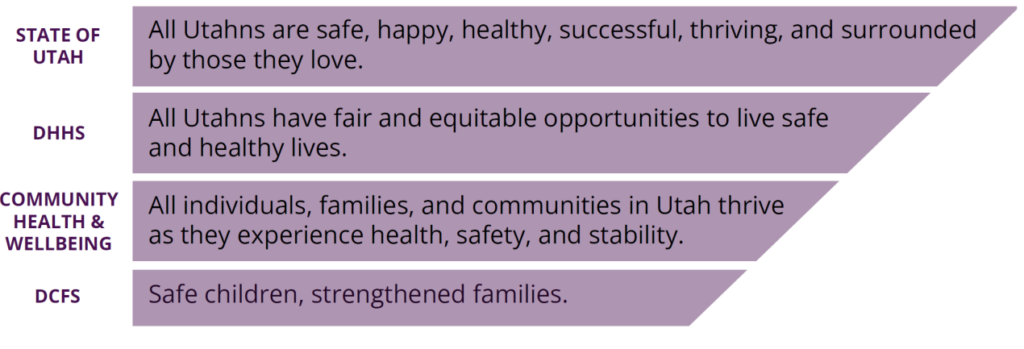
Carrying out this broader mission extends to the individual divisions within the Department. The Division of Child and Family Services (DCFS) within DHHS has a mission to “keep children safe from abuse and neglect through the strengthening of families.” Their vision of focus on the individual through effective policy is embodied in their “individualized, trauma-informed, community-based services that are both safety-driven and family-driven, and the funding of domestic violence shelters and outreach services.”
How DHHS aligns these strategic plans and objectives is reflected in its RBA framework as shown below:

Clearly defining the primary objectives of the program paves the way for measures that are meaningful. From there, agencies can define steps and markers that indicate if they are on the right path to achieving larger outcomes.
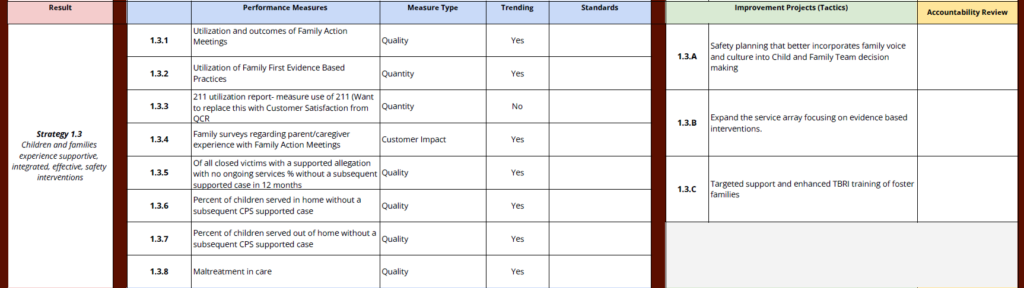
In this example, placing children in safe care is tied to keeping children safe from abuse and neglect, DCFS’s mission, and leads to individuals and communities living safe and healthy lives, DHHS’s broader vision. Understanding how a program is performing is really telling legislators and the public how well the Division and Agency are working toward the broader strategic goals of the agency and the State of Utah.
The Legislative Fiscal Analyst (LFA) does not currently prescribe a specific framework for demonstrating progress toward strategic plans, leaving this to agencies to determine how to best organize their work. Instead, LFA ask agencies to provide their performance measures at two levels: the budgetary line item for all existing funding (these measure progress over time) and the new funding item level (these measure the impact of additional funding). Both types of measures give information on how agencies are progressing toward their strategic goals.
Line item measures can be seen in COBI, where trends in funding can be seen alongside trends in performance (on the overview and performance tabs):
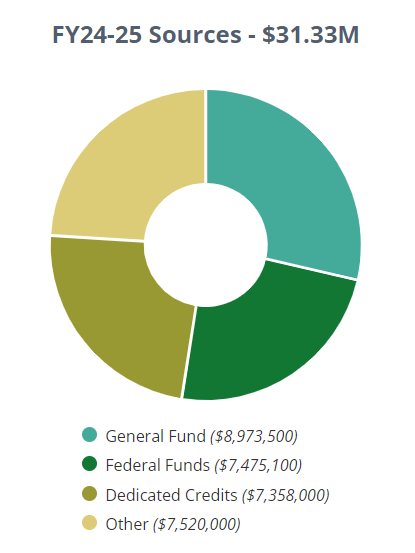
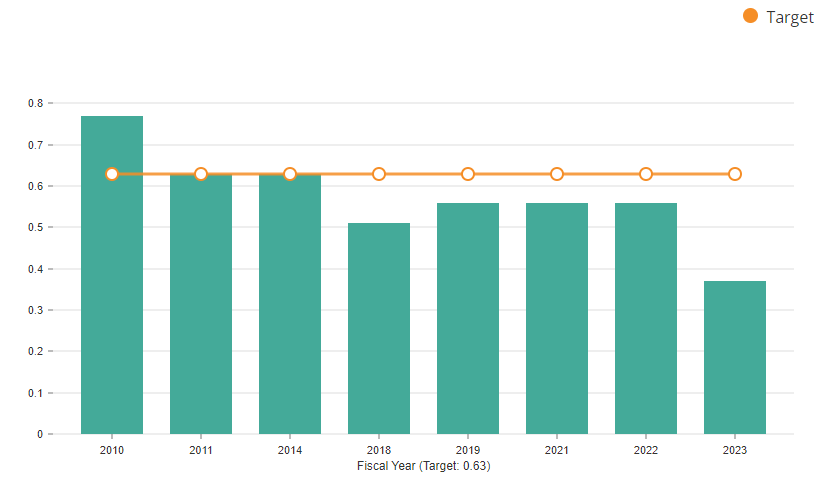
New funding item measures are shown in the Funding Item Follow-up Report, which is intended to capture the impact of new funding, how they were used, and whether performance targets were met.
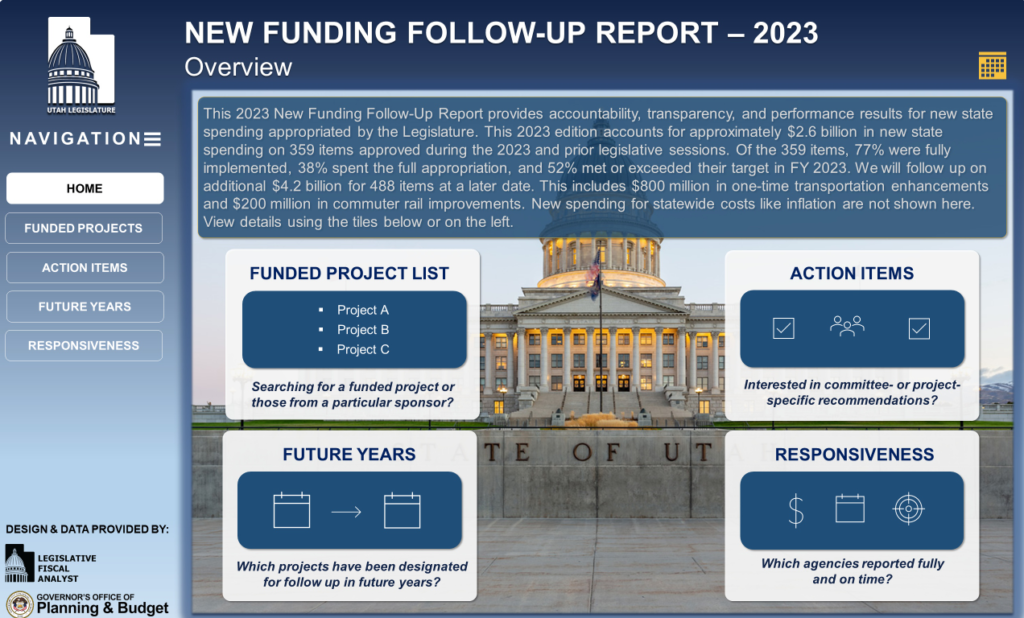
Measuring performance for performance measurement’s sake rarely yields results. Instead, agencies should thoughtfully identify problems, set a strategic vision on how to solve them, and measure progress toward an actionable mission. Policy makers can also play a key role in guiding agencies in their measurement, through the subcommittee budgeting process which establishes performance measures and targets. In this way, the agency, public, and legislators will see a fuller picture of how taxpayer dollars are used to serve the residents of Utah.
Finding Hope: Recent Investments in Behavioral Health Services
Recently, the Utah Legislature has identified the need to invest in mental health interventions and crisis support. S.B. 155, “988 Mental Health Crisis Assistance” (2021 General Session) created the 988 Suicide and Crisis Lifeline line. The 988 Lifeline, which went live July 2022, has provided support, resources, and hope to individuals experiencing mental health emergencies throughout Utah. The service is available 24 hours a day, 7 days a week for calls and text messaging for those experiencing emotional distress, suicidal thoughts, substance use disorders, and the veteran and LGBTQIA+ populations. The 2021 Legislature appropriated $17.8 million ongoing to Statewide Behavioral Health Crisis Response Account in support of the new program.
The 988 Suicide and Crisis Lifeline is a national network comprised of more than 200 crisis centers across the country. Anyone that calls 988 from a Utah area code is directed to the Utah Crisis Line, which is managed and staffed by certified crisis workers at the Huntsman Mental Health Institute.
Key accomplishments by the 988 Suicide and Crisis Lifeline in its inaugural Fiscal Year (FY) include:
- In its first month alone, total call volume to the Utah Crisis Line increased 27% (July 2022 compared to July 2021).
- Nearly 87,000 calls were answered by a certified crisis worker
- 90% of crisis calls in Utah were answered in-state.
- Utah’s Crisis Line workforce increased by 93% year-over-year. (In its second fiscal year, this workforce expanded by another 51% to offer lifesaving services).
- 90% of crisis calls in Utah were resolved over the phone.
The state has also worked with county partners to invest in the development and opening of Receiving Centers and Mobile Crisis Outreach Teams across the state.
Receiving Centers
A Receiving Center is a 24 hours a day, 7 days a week, community facility staffed by therapists, nursing staff, and peer counselors to provide treatment for individuals in mental health or substance use crisis. Individuals are assessed, stabilized, and observed for up to 23 hours.
Most individuals are stabilized within these 23 hours and are connected with a treatment program upon discharge. If an individual needs more than 23 hours to stabilize, there are residential beds nearby for continued care. Caseworkers track all clients for four months, working to engage them in treatment and remove any barriers that prevent participation in recovery programs.
There are currently Receiving Centers open in Weber, Washington, Davis, and Utah counties with others soon to open in Salt Lake, Cache, Carbon Counties. Additional centers have been proposed in Uintah, Sanpete, and Tooele counties.
Mobile Crisis Outreach Teams
Mobile Crisis Outreach Teams (MCOTs) are a community based, mobile crisis service that provides all hours, face-to-face (or virtual) crisis intervention to those experiencing a mental health emergency. These teams provide rapid response assessment wherever the crisis is happening, including at home or a public setting. Teams consist of a licensed mental health professional and a peer support specialist who can provide assessment, support, and de-escalation services, with the goal of resolving the crisis when possible. MCOTs also help connect both individuals and families in crisis to community resources, through referrals, escorting, and coordinating transportation.
Currently Utah has over 21 of 35 recommended MCOTs to provide adequate coverage for the state’s population:
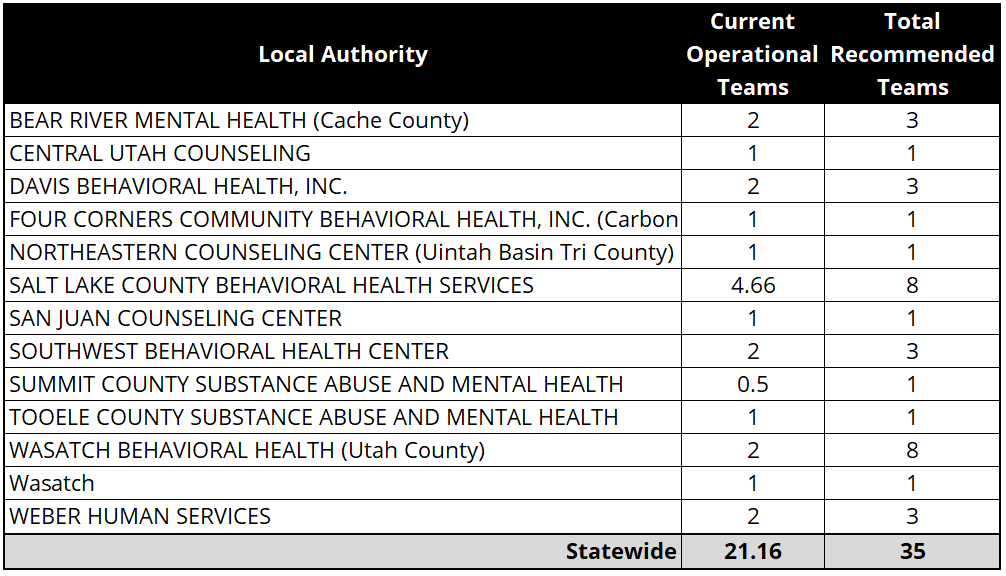
Recent appropriations for both Receiving Centers and MCOTs include:
- 2022 General Session -- ‘Receiving Centers’ provided $1.8 million one-time and $553,300 ongoing for centers in Salt Lake, Washington, and Weber Counties.
- 2023 GS - H.B. 66, "Behavioral Health Crisis Response Commission Amendments" -- $3.2 million ongoing and $1.8 million one-time, both in FY 2024 to support the construction and operations of a new receiving center in Cache Valley;
- 2024 General Session (proposed) - H.B. 71, "Behavioral Health Crisis Response Modifications" -- would appropriate $5,439,200 ongoing and $8,262,400, one-time, both in FY 2025, for the costs related to the development and ongoing operation of four new mobile crisis outreach teams and two new, rural behavioral health receiving centers.
Live On Suicide Prevention License Plate
H.B. 13, "Special License Plate Designation" (2022 General Session) created the “Live On” license plate which would provide $25 per application for the Governor's Suicide Prevention Fund. Money in the fund can be used to improve mental health crisis response, reduce risk factors associated with suicide, and directly enhance known protective factors associated with suicide.

The License plate campaign recently achieved the required 500 applications, meaning the plates will soon be in production.
The Second Act: Subcommittee Priorities Set the Stage for EAC
As week four of the 2024 General Session comes to a close, so too does the work of appropriations subcommittees. Next Monday and Tuesday, the Executive Appropriations Committee (EAC) will hear reports from each of the seven topical budget committees. These reports detail all committee actions including motions, intent language, reallocations, fees, and the coveted priority lists for new funding requests. Requests for new funding come to committees through various means, including the Governor's Budget (agency requests), legislative staff recommendations, and legislator requests for appropriation (RFAs). Subcommittees may choose to not prioritize all items that have been heard, and may recommend that EAC fund items at a different amount than was originally requested.
During the second half of the 45-day session, EAC will work to balance new requests with available revenues. Revenue estimates are updated prior to appropriations bills being drafted, to ensure policymakers adjourn the session with a constitutionally mandated, balanced budget.
Business, Economic Development, and Labor: 2024 Priority Lists
Executive Offices and Criminal Justice: 2024 Priority Lists
Higher Education: 2024 Priority Lists
Infrastructure and General Government: 2024 Priority Lists
Natural Resources, Agriculture and Environmental Quality: 2024 Priority Lists
Public Education: 2024 Priority Lists
Social Services: 2024 Priority Lists
Executive Appropriations: 2024 Funding Item Lists
Next week, you will also be able to see priorities in COBI's issues tab, as shown below:
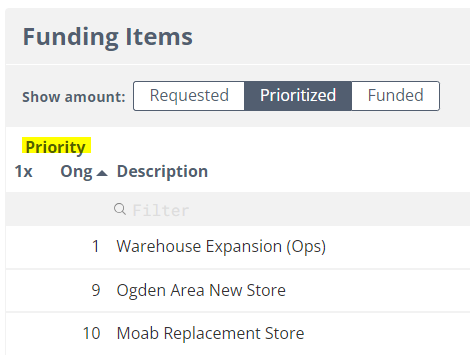
Charting the Course: Navigating Revised Revenue Estimates
On Friday, February 16th, the Legislative Fiscal Analyst along with the Governor's Office announced updated consensus revenue estimates for Fiscal Years (FY) 2024 and 2025. The net impact of these modest changes are positive. While the last few years of astronomical growth may paint available revenue in a lackluster light, in reality these figures demonstrate stable, moderate growth. Changes from December's estimates by fund and revenue type are reflected in the table below, along with the total available revenue:
| One-time | Ongoing | |
| General Fund | $110 million | ($136 million) |
| Income Tax Fund | $104 million | $262 million |
| Subtotal, Additional Available | $214 million | $126 million |
| Available from Dec. Estimate1 | 267 million | $7 million |
| Grand Total | $481 million | $133 million |
The one-time General Fund revenue bump is courtesy of our current fiscal-year-favorite, investment income, while ongoing adjustments reflect moderating trends in sales tax. Forecasts for the Income Tax Fund increased both one-time and ongoing, attributed to variety of factors including: wages, the stock market, and interest rate expectations. Utah's current labor force participation, job growth, and unemployment rates, along with increasing consumer sentiment underscore the soundness of the state's fiscal outlook.
Revenue estimates were released concurrently with the latest revenue collection summary from the Tax Commission and the February Revenue Snapshot, which compares collections to the latest estimates. Collections to both the General and Income Tax Fund remain largely static over this time last year. The Transportation Fund is up 10.4% year-over-year, a growth rate that is largely attributed to the higher gas tax that was implemented in calendar year 2023.
The reports referenced in this post are available at the following links:
February Revenue Snapshot (FY 24)
Tax Commission Revenue Summary (Period 7, FY 2024)
Revenue Publications Archive
The Buck $tops Here: A Budget Summary of the 65th Legislature
The Utah Legislature concluded the 2024 General Session with an operating and capital budget of $29.4 billion for fiscal year 2025. The budget includes $12.9 billion from the sales-taxed backed General Fund and the Income Tax Fund.
Top legislative budget priorities included state fund investments in:
- Tax Relief – $167.7 million ongoing and $37.1 million one-time for an income tax rate cut from 4.65 percent to 4.55 percent, $2.3 million ongoing beginning in 2026 to expand eligibility for the child tax credit from age 3 and under to age 4 and under, $1 million ongoing and $22.0 million one-time to continue rural film incentive credits;
- Transportation -- $330.0 million ongoing and $775.0 million one-time for infrastructure and transportation projects;
- Public Education -- $211.7 million to increase the WPU Value by 5.0% to $4,443 for FY 2025, up from $4,280 in FY 2024. $57.0 million for at-risk students and digital teaching tools, $40.0 million for scholarships, and $440.0 million in one-time projects from the Public Education Economic Stabilization Account;
- Higher Education -- $20.0 million for university performance funding, $7.0 million ongoing and $5.0 million one-time for technical colleges, $160.0 million one-time for new building construction;
- Affordable Housing -- $17.0 million for $300 million in subsidized loans under the Utah Homes Investment Program, $3.0 million for Shared Equity Revolving Loan Program, and $3.0 million for the Law Enforcement First Time Home Buyer Program;
- Homelessness -- $10.0 million ongoing and $11.8 million one-time for Statewide Homeless System Support, $25.0 million one-time for Low-barrier Shelter, $0.5 million ongoing and $2 million one-time for Home Courts, and $2.6 million for mitigation; and
- State Employee Compensation -- $135.0 million ongoing for 3% compensation increases for executive branch and higher education employees, 2% pay for performance increases for executive branch employees, 5% discretionary increases for other branches of government, 0.7% salary enhancement for Tier II employees.
As required by the Utah Constitution, legislators balanced the budget to projections of available revenue.
For significant budget actions according to appropriations subcommittee, please see this budget summary document: Spending Summary.
An index of new funding items and their location in appropriations bills is available here: Index of Budget Adjustments.
There are a number of resources available for the public and legislators to understand more about Fiscal Year 2024 and 2025 funding:
Budget Quick Facts – A pocket-sized guide to the budget.
DataViz – An interactive graphical representation of the budget. View the budget by sources, uses, and new money. Click a bubble to see how that item has changed over time, and in what bills it changed. Search for budget requests and find where it exists in appropriations bills.
Compendium of Budget Information (COBI) – A complete guide to the Utah State budget. Find budget requests on the Issues tab, and Line item/program budgets on the Financials tab.
Good GRAMA: Evaluating the State Records Committee Appeal Process
The Legislative Fiscal Analyst’s Performance and Operations Team recently published two new efficiency evaluations of state agency programs:
- Department of Government Operations - State Records Committee (discussed below)
- Utah Labor Commission - Division of Adjudication
Last December, we highlighted some of the operations methodologies that the team uses for process improvement. In this post, we describe how various methodologies relate to each of the recommendations made to the State Records Committee for their appeal process for Government Records Access and Management Act (GRAMA) requests. Separate from their auditor counterparts in the Office of the Legislative Auditor General, the Performance and Operations team strives to provide consultant-like services to state agencies with the goal of improving outcomes for Utah’s citizens.
State Records Committee
When a GRAMA request is denied, a member of the public can appeal the decision to the State Records Committee (SRC). The committee is made up of seven volunteer members representing the media, private sector, public, and state and local government. The Division of Archives and Records Service, housed within the Department of Government Operations, staffs the SRC.
The SRC works to find a balance between providing the public access to government records while ensuring statutorily protected records maintain their limited distribution. Dealing with hundreds of cases per year, the committee spends many hours understanding both Utah’s record laws and the perspectives of all parties involved.
Recommendations
After reviewing current practices, the team, along with the Governor’s Office of Planning and Budget (GOPB), made three recommendations aimed at boosting efficiency, clarity, and effectiveness of the appeal process:
- Formalize internal procedures for managing received appeals through the entire State Records Committee process. The intent is to develop standards so that staff spend less time on incomplete cases while improving the accuracy of information received.
- Use the role of the ombudsman more effectively and strategically. The ombudsman is a fancy term for someone appointed to investigate and facilitate resolution of complaints. This recommendation centers on using this role proactively to resolve cases before they reach a hearing, and to clarify how the executive secretary and ombudsman work together during the process.
- Standardize the facilitation of State Records Committee appeals. The intent is to determine if the SRC should be a formal body in how they facilitate appeals. Where recommendation one aimed to standardize internal case management, recommendation three looks to clarify the role of the SRC, and the formalized administration of the hearings.
Principles of Process Improvement
The recommendations were based on the following process improvement principles:
- Standardizing work: documenting a process leads to greater consistency. In the case of the SRC, this means using clear terms and definitions that help citizens navigate the appeals process.
- Triaging and batching: by grouping similar types of cases and treating them the same, this should help all customers move more quickly through the appeal, saving time for both agency personnel and citizens.
- Full kit: keys to reducing frustration include: making sure everything the committee needs to process a case is available before starting a review, and ensuring citizens know which documents are needed for a complete application.
- Visualization through process mapping: knowing how a case should proceed through the system helps employees know when a case is on track and provides insights for improvement opportunities.
- Control work-in-progress (WIP): too many overlapping, unfinished cases result in decreased work quality and tends to lead to longer resolution times. WIP can also drain employee morale, as staff are faced with an unmanageable caseload.
- Front loading: address problems at the beginning of the process that are more costly and difficult to solve later. With the ombudsman resolving simple cases before a hearing, the SRC’s workload can decrease, saving time for more difficult and nuanced cases.
- Synchronization of resources: aligning work performed with system priorities can reduce the length of time a case is open, leading to both manageable caseloads for employees and shorter cases for citizens. A win for everyone involved.
- Mistake proofing: incorporating automation within a process can reduce human-caused error. For the SRC, this applies to time limits (automated through use of a mechanized timer) and other hearing specifications.
- Buffer Management: planning strategies to identify extra or needed capacity to handle an increase in work due to a crisis, seasonality, or other factors.
The Performance and Operations Team is currently hard at work (along with GOPB) evaluating efficiencies in the Department of Corrections. Stay tuned for their next report which is expected to be released later this year.
A Hare Above: Spring Revenues Nearly Identical to 2023
Late last week, the Tax Commission released their revenue summary report, detailing collections through eight months of the Fiscal Year (FY). As of March 7th, revenue to all sources grew 0.2%, or $22.8 million, over FY 2023. The March Revenue Snapshot, produced by the Legislative Fiscal Analyst and the Governor's Office of Planning and Budget, shows collections nearly matching projections. Revenue estimates were updated back in February, and provide the basis for the budget passed during the 2024 General Session.
General Fund collections totaled a little over $2.8 billion, representing a year-over-year (YoY) growth rate of 3.6%. While we typically think of General Fund as being supported through sales and use tax, our familiar friend Investment Income is primarily credited with this month's YoY gains. These revenues overshadow other sources, such as Oil and Gas Severance and Mining Severance Taxes, which are down more than 30% when compared to FY 2023.
Income Tax Fund revenues posted (2.0%) YoY, which closely mirrors the projected (2.2%) forecast . Withholding continues it's trajectory of positive returns, indicating a stable, strong labor market. Final payments are down 27.1% over last year; however, as with any tax year, May's revenue reports will be the true indicator of how payments compare.
The Transportation Fund is up 12.2%, consistent with our previous 2024 reports that reflect a higher fuel tax. Motor vehicle registrations are also up 16.8%, perhaps bolstered by both vehicle availability and recently available Historical Society of Utah plates.
The reports referenced in this post are available at the following links:
March Revenue Snapshot (FY 24)
Tax Commission Revenue Summary (Period 8, FY 2024)
Revenue Publications Archive
Of Budgets and Brine Shrimp: Recent Investments in Utah's Water
It's hard to believe that two years ago we were writing about the abnormally dry conditions gripping the state, while last year the legislature considered how to pay for the impending threat of flooding. It's true that every General Session has the common problem of predicting what resources will be needed up to 15 months in the future, but this guessing game is compounded when Utah's budget for water projects is impacted by the hydrologic cycle.
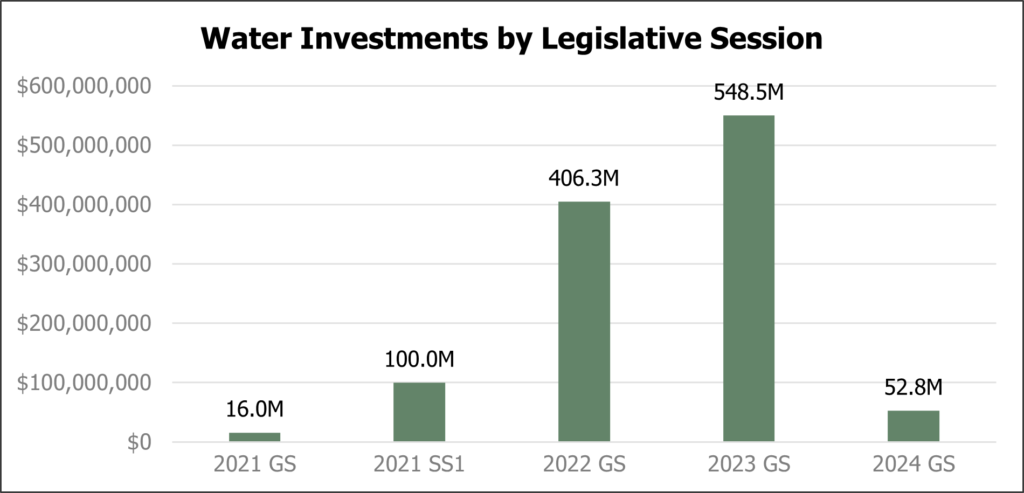
As can be detected in the graph above, the 2021 First Special Session was the state's initial slice of the $1.38B in discretionary funding provided by the American Rescue Plan Act (ARPA). This infusion of cash, combined two years of exorbitant revenue growth, provided policy makers with unprecedented resources to invest in water. The majority of these investments were appropriated to the Department of Natural Resources, and over 40% of these projects were funded through ARPA. Almost all of this funding was appropriated one-time (93%), with policymakers understanding both the limitations of ARPA and holding expectations of stabilized revenue growth.
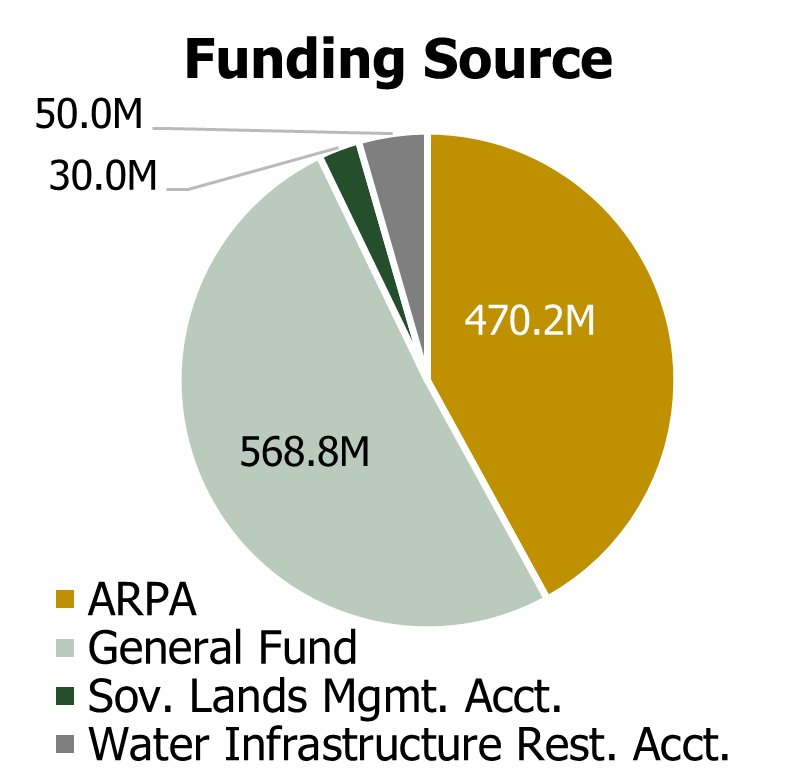
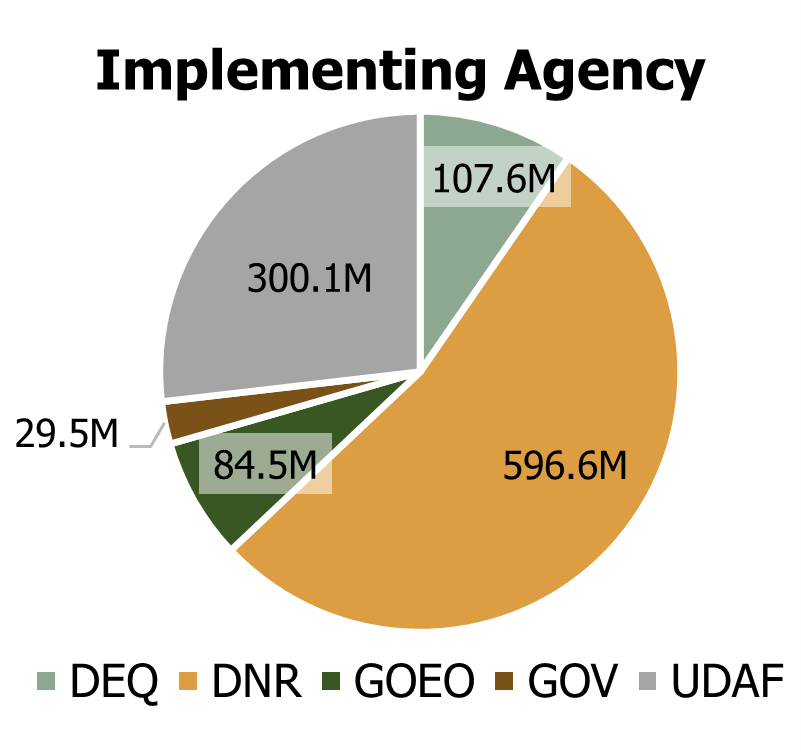
The majority of these projects were funded for residential (municipal) water, for both water delivery and secondary water projects. The second largest investment was in irrigation water efficiency which, in northern Utah, could prove beneficial to the Great Salt Lake. The charts on this page do not reflect direct federal grants, including those provided through the Infrastructure Investment and Jobs Act (IIJA). In the 2022 General Session, Utah maximized its federal grant matching potential with the expectation of receiving over $144 million for Drinking Water and Wastewater (Water Quality) projects through the IIJA.
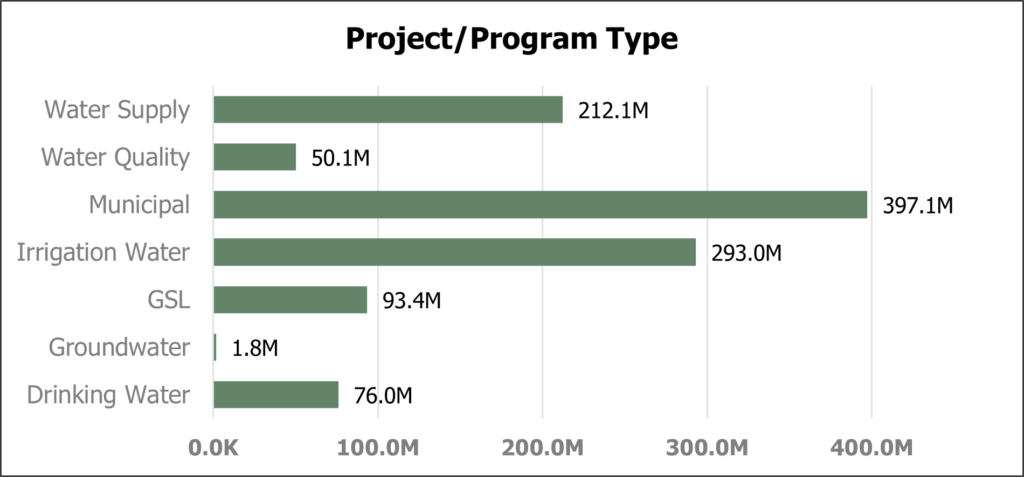
Currently, the state's precipitation level is slightly above the 10-year average, snowpack is ahead of schedule, and most reservoirs (spare Lake Powell) are close to 80 percent full. As the wettest months of the year wrap up, we'll see how these recent investments have made the state more resilient to the full landscape of water scenarios.
A summary brief including funding items through the 2024 General Session is available here: Recent Legislative Investments in Water.
The Filing Finale: State Budget Ready for Tax Season
For the Legislative Fiscal Analyst (LFA), it's almost the happiest time of year. With the General Session in the rearview mirror, economists now watch with anticipation as the state income tax fund should see the largest single bump of the fiscal year. While April 15th has come and gone, revenue reports won't show the outcome of the filing deadline until May.
On Wednesday, April 17th, the Tax Commission published their revenue summary report which details collections through April 7th. In tandem, LFA and the Governor's Office of Planning and Budget published their April Revenue Snapshot showing collections compared to forecasted revenues. The forecasted total collections to all state funds are spot-on with actuals, at 0.1% over Fiscal Year (FY) 2023.
The chart below shows the comparison of General and Income Tax Fund collections for FY 2022, 2023, and 2024 to date. While revenues to all state funds are on par with last year, the graph demonstrates how revenues to each of the two major state funds differ. The Income Tax Fund is slightly lagging compared to last year's collections, due mostly to decreased final payments. As mentioned earlier, next month's report will provide a clearer picture of how the two years compare. The General Fund is performing better than FY 2023, which is no surprise given how much we've discussed our crowd favorite, investment income during FY 2024. Economists also expect sales tax growth rates to pick up steam as the fiscal year comes to a close (based on slow growth in the last part of FY 2023.)
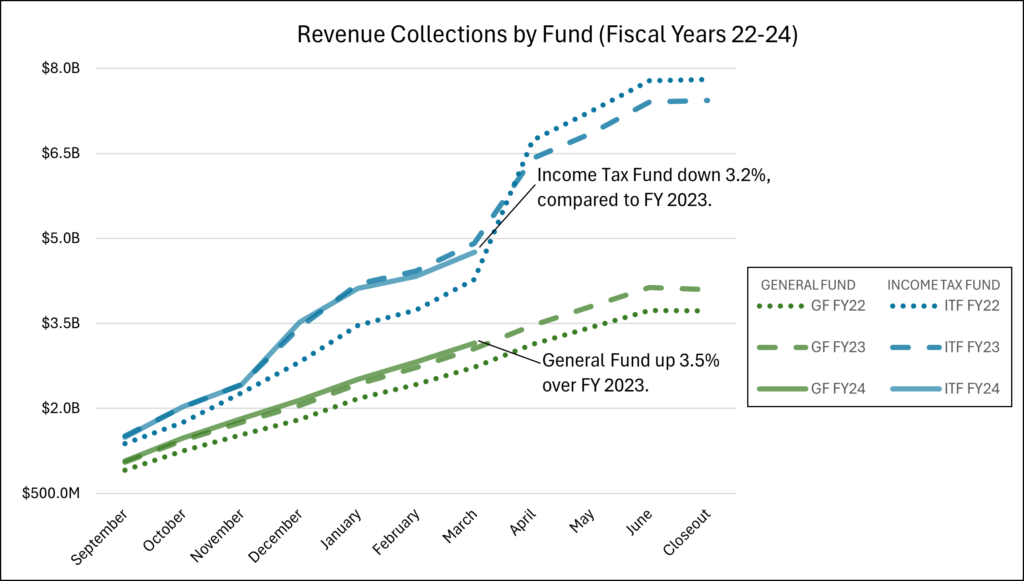
The Transportation Fund (not shown on the graph) continues to perform well, bolstered by changes to the fuel tax. Economists expect this trend to moderate, as the changes in fuel tax implemented during calendar year 2023, become part of the base comparison.
The reports referenced in this post are available at the following links:
April Revenue Snapshot (FY 24)
Tax Commission Revenue Summary (Period 9, FY 2024)
Revenue Publications Archive
Revenue Deja Vu: May Collections Mirror Previous Two Fiscal Years
On Friday, May 17th, the Tax Commission along with the Legislative Fiscal Analyst and Governor's Office of Planning and Budget released the latest revenue monitoring reports, detailing collections through May 9th. Through 10 months of the fiscal year (FY), revenues to all state funds have kept pace with the astronomical collections observed during tax season of FY 2022. While stalled revenue growth can make budgeting a challenge, economists have prepared the policy makers with accurate revenue forecasts, correctly projecting the 0.1% revenue growth to all sources seen through May. The tradeoff of living in a world without pandemic stimulus is that revenue growth is limited, but also far more predictable.
The General Fund posted a 3.7% growth rate year-over-year (YoY) thanks once again to our friend, investment income. While a revenue surplus is off the table for this year, previous General Fund surpluses are providing insulation for current economic conditions through the investment of rainy day funds. Sales Tax is up 1.5% over FY 2023, while Oil and Gas Severance Tax is down (37.4)% YoY.
In the world of Income Taxes, withholding remains positive (underscoring the strength of Utah's labor market) while final payments are down (22.7)% compared to last May. While the Income Tax Fund lags the forecast by .06%, legislative economists know that the only thing reliable about final payments is that they are unreliable. As such, during the 2024 General Session, policymakers treated $150 million as high risk revenue, which was appropriated contingently and can be rescinded in the case of a shortfall. For more information, check out the 2025 Budget Slideshow and Economic Update to EAC from earlier this week.
The reports referenced in this post are available at the following links:
May Revenue Snapshot (FY 24)
Tax Commission Revenue Summary (Period 10, FY 2024)
Revenue Publications Archive
Special Session Spotlight: How Latest Appropriations Compare with June Revenue Collections
2024 Third Special Session Fiscal Impacts
During Wednesday’s Special Session, the legislature considered five bills and two resolutions. Only two of those bills or resolutions had direct, measurable fiscal impacts to the state:
- H.B. 3002 – This bill had a positive, ongoing impact to the General Fund of $157,500 from repealing unused appropriations to the Legislature for federalism efforts. This bill also reallocated $10.1 million from nonlapsing balances of various line items and agencies and placed it into the Federal Overreach Restricted Account (account). From that account, the bill then appropriated $5.3 million to the Department of Natural Resources and the Attorney General for purposes allowable under the account’s authorizing statute. The estimated amount remaining in the account for FY 2025 is just under $4.8 million.
- H.B. 3004 – This bill had a positive ongoing impact to the General Fund of $6,200 due to reducing per diem expenditures from repealing the Project Entity Oversight Committee.
June Revenue Reports
These positive fiscal impacts, however small, were welcomed by the relatively stagnant revenue growth observed in the latest revenue reports. Last week, the Tax Commission published collections through June 7th. The Revenue Summary Report shows Individual Income Tax down $250.3 million or 4.1% less year-over-year (YoY). On the other hand, State Sales and Use Tax is up $89.0 million or 2.2% YoY. Still, as shown in the June Revenue Snapshot, total collections from all sources to the Income Tax and General Funds are within a percentage point of the consensus forecast. As discussed last month, the legislature built into the current budget a $150 million buffer, which is about three times larger than the current deviation between collections and forecasted revenues.
Economists suggest that the final quarterly payment for corporate income tax, currently up 4.4% over FY 2023, could prove to be a source of volatility as the fiscal year comes to a close. On the bright side, vehicle registration fees are continuing their upward trend, contributing an additional $31.2 million to the Transportation Fund when compared to last year at this time.
It’s worth remembering that this month’s report reflect sales and wages that took place in April and were collected in May. As always, July’s report will preview the FY 2024 yearend, while the final report will be published in October after close out.
The reports referenced in this post are available at the following links:
June Revenue Snapshot (FY 24)
Tax Commission Revenue Summary (Period 11, FY 2024)
Revenue Publications Archive
Making Cents of Jail Contracting: Recent Policy and Budget Changes
Local jails play a significant role in Utah’s criminal justice system. Specifically, county jails serve an important function by housing a portion of state inmates and certain probationers (who are sentenced to serve in a county jail as a condition of their probation). The program that pays for state inmates to use local facilities is called ‘Jail Contracting’, while the probationer program is referred to as ‘Jail Reimbursement’. Counties house 25-30% of the state’s prison population, currently funded at up to 1,600 individuals.
During the 2023 and 2024 General Sessions, there have been significant changes in these programs’ policies and processes as well as funding levels. These changes have allowed for improved transparency, predictability, and simplification. Below is a brief description of each program, including funding levels and the key elements of these programs.
Jail Contracting
The Jail Contracting program pays counties to house a portion of state inmates that would otherwise be located at one of the two state prison facilities (in either Salt Lake or Gunnison.) Typically, if offenders are sentenced to incarceration over 365 days, they are sent to a state prison whereas sentences less than 365 days are sent to a local, county jail. This program is mutually beneficial. For the state, this program allows more flexibility in managing inmates as the population changes and reduces the need to construct additional or larger state correctional facilities. Local jails benefit by having some of their variable and fixed facility costs offset by housing state inmates. The state pays counties per day for each prisoner housed within a county jail. Below are General Fund appropriations for the Jail Contracting program over time. The green highlights indicate the impact of S.B. 114 "County Correctional Facility Contracting Amendments" (2023 General Session).
| Funding Item | FY 2023 | FY 2024 | FY 2025 |
| Jail Contracting | $34,141,500 | $40,988,100 | $48,763,800 |
| Reserve | - | $2,000,000 | $2,000,000 |
Key elements of Jail Contracting program changes:
- The state pays at least 70% of incarceration costs, eliminating the discretion of the Legislature to set the daily rate, instead using a daily incarceration cost formula, increasing the overall amount paid to counties.
- The rate formula is based on average costs of the last five fiscal years as opposed to the last three fiscal years.
- The Department of Corrections is required to forecast contracting needs, which is factored into program costs.
- Provides a one-time reserve of $2.0 million, should the population exceed estimates.
Jail Reimbursement
The Jail Reimbursement program compensates county jails for probationers that a judge orders to be housed in a local jail as a condition of their probation (up to 365 days). This program operates on the concept of shared responsibility between the state and counties for incarcerating this specific population. This is reflected in a reduced daily rate when compared to Jail Contracting. Below are General Fund appropriations for the Jail Reimbursement program over time. The highlighted column indicates the impact of S.B. 48 "County Correctional Facility Reimbursement Amendments" (2024 General Session).
| Funding Item | FY 2023 | FY 2024 | FY 2025 |
| Jail Reimbursement | $12,725,100 | $12,725,100 | $11,779,100 |
| Reserve | $1,000,000 |
Features of the updated Jail Reimbursement include:
- The Jail Reimbursement rate paid to counties is based on the state’s costs (i.e., the state daily incarceration rate as opposed to county costs).
- The state pays 50% of the state daily incarceration rate for probationers sent to county jails, increased from 47.89%.
- Provides a one-time reserve of $1.0 million in cases where the probation population exceeds estimates.
The policy and funding changes made in the 2023 and 2024 general sessions for these programs has allowed for increased transparency, predictability, and improved rates paid to counties. The legislative changes have also provided increased insulation to the state’s budget, allowing for fiscal flexibility as these populations change.
Settlement Savvy: How Utah is Using Opioid Settlement Funds
In February 2022, the first of several large settlements was finalized in the nationwide, multi-district litigation against opioid manufacturers and distributors. These settlements, worth an estimated $26 billion, were with Janssen (J&J) and the “Big 3 Distributors” (Cardinal, McKesson, and Amerisource Bergen). Additional settlement agreements have been reached with McKinsey and Company (a consulting firm involved with marketing to physicians), Walgreens, CVS, Teva, Walmart, and Allergan.
As a result of being a participant in the litigation, Utah will receive nearly $495 million from opioid settlements over 17 years. Of that amount, $248.7 million will go to the state government, while counties will receive $242.3 million. The most recent settlement agreement was with Mallinckrodt, where Utah has already received the full payment of $3.8 million (see the last row in the table below).
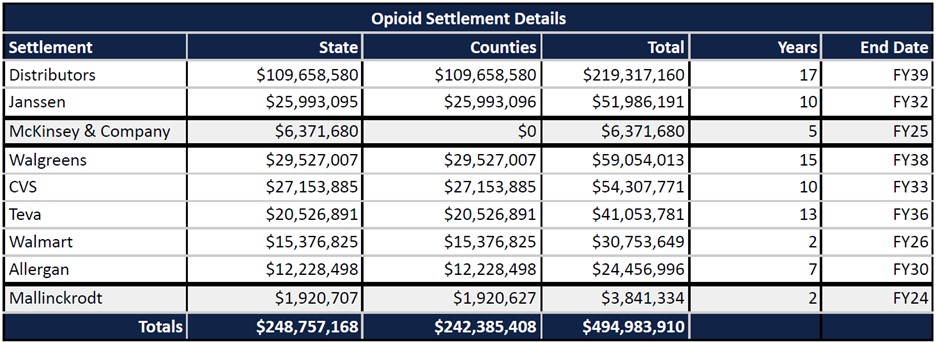
There are limitations on how settlement funds can be spent; approved categories include supporting addiction treatment, addiction prevention activities, and recovery. Over the past three General Sessions, the Utah Legislature has worked with the Attorney General’s Office, the Department of Health and Human Services, and the Governor’s Office of Planning and Budget to review funding proposals and appropriate settlement proceeds for a variety of programs that support opioid-impacted individuals in Utah.
The Legislature and partner agencies review settlement agreements and receipts continually throughout the year to determine the appropriate amount of funding available each Session for appropriation. This review focuses on funds deposited, settlement distribution tables, prior appropriations, and the results of ongoing litigation. The table below includes current appropriations that have been made using settlement proceeds, according to the session the funding was appropriated. The funding item titles are linked to their descriptions in COBI:
| Funding Item | General Session | Ongoing | One-Time |
| USARA Recovery Community Centers | 2024 | $500,000 | |
| PROUD: Pathway to Recovery from Opiate Use Disorder | 2024 | $351,200 | |
| Expanding Care for Pregnant Patients with Substance Use Disorder | 2024 | $200,000 | |
| Substance Use Disorder Recovery and Animal Companions | 2024 | $225,000 | |
| Spy Hop Youth Prevention Services | 2024 | $200,000 | |
| Matching Funds for Counties Using Opioid Funds in County Jails or Receiving Centers | 2023 | $1,000,000 | |
| Emergency Department/Urgent Care induction to Medications for Opioid Use Disorder | 2023 | $1,200,000 | |
| OUD Treatment Expansion in Rural Communities | 2023 | $1,300,000 | |
| State Opioid Settlement Appropriation - Shifting Efforts Upstream | 2023 | $2,184,300 | |
| Primary Prevention | 2023 | $443,400 | |
| Behavioral Health Prescription Digital Therapeutic Pilot | 2023 | $300,000 | |
| Support for Pregnant Moms with Substance Use Disorder | 2022 | $2,800,000 | |
| Total: | $7,603,900 | $3,100,000 |
The Legislature has included intent language for each of these appropriations requiring a report within three years that details:
- outcomes achieved,
- advisability of continuing funding, and
- challenges faced in reaching desired outcomes.
This follow up provides the legislature with the information necessary to decide whether to continue appropriations or redirect funds to new programs, with the goal of achieving the highest benefit from settlement proceeds.
The Scoop on Salaries: Recent Legislative Investments in Teacher Pay
Salaries have long been a focal point in discussions about education funding. Teachers are fundamental to our educational system, and debates about their compensation have focused on adequacy, fairness, and impact on recruitment and retention. In Utah, salaries for public educators are comprised of state, local, and federal funds. Ultimately, the total amount a teacher is paid is decided by individual school boards (Local Education Agencies, or LEAs). This post covers recent legislative actions affecting the state’s pay of Utah’s public school educators.
Salaries by the Numbers
During the 2023 General Session, the Legislature passed H.B. 215, “Funding for Teacher Salaries and Optional Education Opportunities,” which provided a $196.9 million ongoing for increases in teacher pay starting in FY 2024. In the same session, the Legislature passed S.B. 183, “Educator Salary Amendments” which included provisions for annual compensation adjustments. These adjustments aim to provide additional funding each year based on inflation and increases in the WPU value, ensuring that the value of direct state funding for teacher salaries is maintained over time.
According to the Utah Superintendent Association, starting salaries for new teachers have increased to nearly $60,000 for Fiscal Year (FY) 2024, marking a 35.1% increase over the past five fiscal years. The estimated statewide average teacher salary for FY 2024 was a little over $67,600, representing a 23.6% increase in pay since FY 2020. According to a December 2023 report by the Kem C. Gardner Policy Institute, Utah’s teacher starting salary is the second highest in the nation, while the average salary ranks 26th. The report also concludes that pay increases are the largest factor in teacher retention.
The table and graph below have detailed information on salaries by fiscal year for public schools (including district and charter schools).
| FY 2020 | FY 2021 | FY 2022 | FY 2023 | FY 2024 (Estimated)* | |
| Starting Salaries (New Teachers) | $44,374 | $47,072 | $49,263 | $55,984 | $59,954 |
| Statewide Average Salaries | $54,676 | $57,221 | $59,671 | $63,481 | $67,581 |
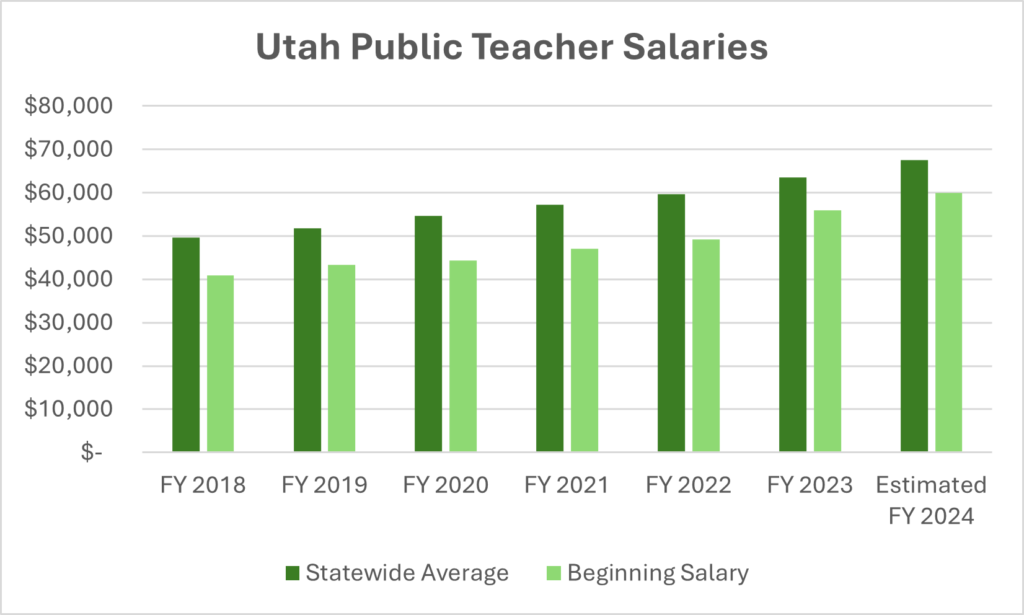
The Office of the State Auditor in Utah provides an interactive dashboard for viewing trends in teacher wages and benefits within the state. It allows users to filter data by school year, pay type, full-time equivalent (FTE) status, and more. The dashboard also provides summary information categorized by teachers' degree levels and years of experience. This data can be viewed according to LEA and by individual schools.
Recent Legislation
While compensation for public educators is decided on a local level, these recent efforts by the state are designed to promote recruitment and retention of Utah’s teachers, with the goal of improving outcomes for Utah’s students.
H.B. 215 (2023) - Funding for Teacher Salaries and Optional Education Opportunities
One of the most significant changes in state funding for salaries, this legislation doubled the state teacher salary supplement from $4,200 to $8,400.The bill also provides scholarships for educational choices for families.
S.B. 183 (2023) - Educator Salary Amendments
This legislation provides salary adjustments matching the increase in the Weighted Pupil Unit (WPU) value from the previous fiscal year. This ensures that teacher salary adjustments reflect the same percentage increase as the WPU, so that compensation enhancements are designed to keep pace with inflation. The bill resulted in an expected increase for the state portion of $8,900 for FY 2025.
S.B. 2 (2024) - Educator Professional Time
This bill provides $74 million one-time for up to 32 hours of paid professional time for every educator.
S.B. 173 (2024) - Excellence in Education and Leadership
$150 million one-time to create and enhance teacher salary supplement opportunities.
H.B. 431 (2024) - Teacher Retention
While indirectly tied to compensation, the focus of this legislation is training and developing teacher-leaders. The grant funds a district may receive can be used to fund time for educators to perform teacher-leader work, extend contracts (resulting in more pay) for teacher leader work, or expand teacher leadership tracks.
Optimized Occupancy: Highlighting the Master Plan for State Facilities
The Statewide Master Plan guides investments in existing state office space and supports the new construction of carefully planned rural centers. The first master plan for state buildings was completed in January 2021 by the Division of Facilities Construction and Management (DFCM). The plan evaluated 215 state-owned and state-leased office spaces and laid out multiple consolidation scenarios that would allow the state to exit 91 locations. The plan estimates $569 million saved in operational costs and eliminates an $429 million in new building expenses over 50 years.
Salt Lake County projects focus on renovating state-owned office buildings to better support modern business operations, including remote work. Outside the Wasatch Front, DFCM identified a need to renovate four existing regional centers and construct seven new regional centers. These investments allow state agencies to provide services to residents in centralized locations, while increasing support for state employees in rural areas through local drop-in workspaces with amenities such as high-speed internet and conferencing areas.
Creating the Plan
In January of 2018, as directed by the Infrastructure and General Government Appropriations Subcommittee, DFCM kicked off a utilization study of 23 existing state-owned buildings across Salt Lake County. The study intended to provide a backdrop for DFCM to address several state facility concerns, such as the aging inventory, increased space needs, and the rising cost of construction. The study found that the buildings were inefficient and were not designed for the current programmatic needs nor to assist agencies with attracting and retaining workers. The study also uncovered opportunities for consolidation and savings. While state agencies have updated spaces over time, they don’t have reliable, adequate funding for remodels, leading to small projects with no emphasis on efficient space usage or big picture planning.
During the 2019 General Session, the Legislature appropriated funding for a Statewide Master Plan. The project was broken into two phases: Phase I to study the agencies in Salt Lake County (including the Capitol complex), and Phase II to look at rural Utah and the balance of the state. DFCM completed Phase I in January 2020, later updating it to capture the pandemic-related increase in teleworking (which increased the number of employees per desk). DFCM completed Phase II of the master plan in late 2020.
Prioritizing Projects
Prior to the passage of S.B. 82, “State Facilities Management Amendments” (2022 General Session), the State Building Board was tasked with ensuring the State’s capital facility programs were efficiently managed. The Building Board met with state agencies and higher education institutions to evaluate project requests and recommend a “Five-Year Book” that accurately reflects present State building needs and those within a 5-year time horizon. Beginning in Fiscal Year 2024, DFCM assumed the duties previously assigned to the Building Board, to compile capital development requests from agencies and institutions of higher education that compete for state funding. DFCM publishes these requests, ranking each project based on the current statewide need and publishes it into the Five-Year Building Book. The cost to implement the Statewide Master Plan, also called the 'Renovation Fund', was included as the top priority in the FY 2024 and FY 2025 Five-Year Building Books.
Funding the Plan
During the 2023 General Session, the Legislature appropriated $125.0 million in high-risk revenue to the State Agency Capital Development Fund for the Statewide Master Plan (S.B. 3, Item 565). The appropriation, which was contingent on FY 2023 revenue collections and FY 2024 revenue projections, was later rescinded due to insufficient revenue collections. An additional $35.0 million was appropriated to the State Agency Capital Development Fund for the Richfield and Farmington Regional Centers (S.B. 3, Item 564).
During the 2024 General Session, the Legislature prioritized specific state agency and higher education project requests, and appropriated $100.0 million in high-risk revenue for the Statewide Master Plan. Like FY 2023, this appropriation is contingent on FY 2024 revenue collections and FY 2025 revenue projections.
DFCM and the Legislature continue to work together on how to best provide long term, sustainable funding for state buildings which will save money and improve services for Utah's taxpayers.
Getting Your Money's Worth: Exploring the Latest Taxpayer Receipt
During the 2013 General Session, the Legislature passed H.B. 129, “Amendments to Powers, Functions, and Duties of Office of Legislative Fiscal Analyst,” which required the Office to develop and publish a taxpayer receipt. The receipt is intended to answer the question of how an individual’s tax dollars are expended for government purposes. The receipt does this by using a few pieces of information to estimate how much an individual pays in the major tax types: income, sales, property, and fuel. Those estimates are then divided into various spending categories based on the most recent state budget.
Conceptually, the calculations are simple: to find an estimate of Income Tax paid, the statutory rate is applied to the income reported by the user. However, this approach will overestimate payments since it does not account for any of the deductions, exemptions, or credits that taxpayers may claim. As such, the receipt uses ‘effective tax rates’ which are based on actual taxes paid (relative to income), to estimate typical tax liability for a given income bracket and household size.
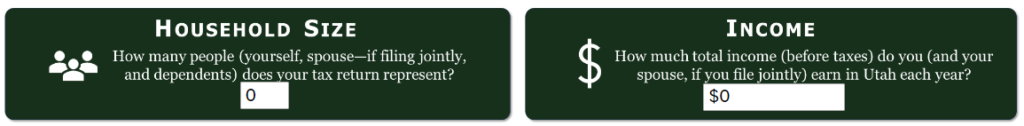
For Sales Tax, the receipt makes similar assumptions. For example, not all sales are treated equally, since food products are taxed at a lower rate than other goods. Additionally, consumption behavior changes with household income. To address these limitations, economists utilize information reported in the Bureau of Labor Statistics’ Consumer Expenditure Survey which tracks consumption patterns according to demographic information. Using the survey data, the receipt assumes the ‘typical’ percentage of salary that goes towards food and taxable goods according to the user’s reported income. From there, the statutory rates are applied to estimate sales tax liability.
The taxpayer receipt is updated annually to ensure the most accurate estimates based on current tax law and the most recent state budget. This year, the fuel tax calculation was enhanced to include more specific estimates of fuel consumption (and fuel taxes paid) based on vehicle type and age.
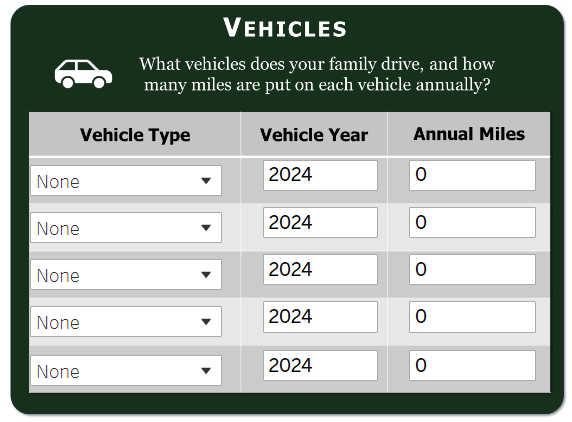
Additionally, this year’s version of the receipt includes estimates of vehicle registration fees. While all vehicles pay a registration fee, some are more expensive to register than others. Electric and hybrid vehicles pay a higher base registration fee than combustion vehicles, to offset the fact that alternative fuel vehicles pay less or no fuel tax. Some registration fees are also geographically based. For instance, vehicles registered in Salt Lake County pay an air pollution control fee (APC) which goes towards pollution mitigation efforts.
After a user has input their data into the taxpayer receipt, the estimated total tax burden is broken down into expenditure categories. By clicking on a public purchase estimate (such as Infrastructure in the image below), users are taken to the appropriate page into the Compendium of Budget Information, which offers detailed budget information according to fiscal year.
As the state tallies the final collections for Fiscal Year 2024, it's valuable to understand how those tax dollars are put to use. Legislative staff look forward to improving the taxpayer receipt in future iterations, with the continued goal of bringing transparency to Utah's tax dollars.
The receipt is available at the following link: Taxpayer Receipt
For the preliminary yearend revenue reports, see the links below:
July Revenue Snapshot (FY 24)
Tax Commission Revenue Summary (Period 12, FY 2024)
Revenue Publications Archive
The Reality of Realty: How the State is Investing in Affordable Housing
According to the Kem C. Gardner Policy Institute, average rental prices along the Wasatch Front climbed more than 20% from 2020 to 2021. While the State of Utah's Housing Market Report (report) does note contraction in the housing market in 2023, the implications of interest rates and the pandemic on Utah's housing market are enduring: from 2021 to 2023, the income required to finance the median priced home in Utah increased by 52.1%.
Aware of the challenges facing both Utah's prospective homebuyers and renters, Legislators have invested more than $350 million in various projects aimed at affordable housing during the last five General Sessions. As discussed in this post from 2022, affordable housing relates to homelessness but is focused on helping a different set of constituents.
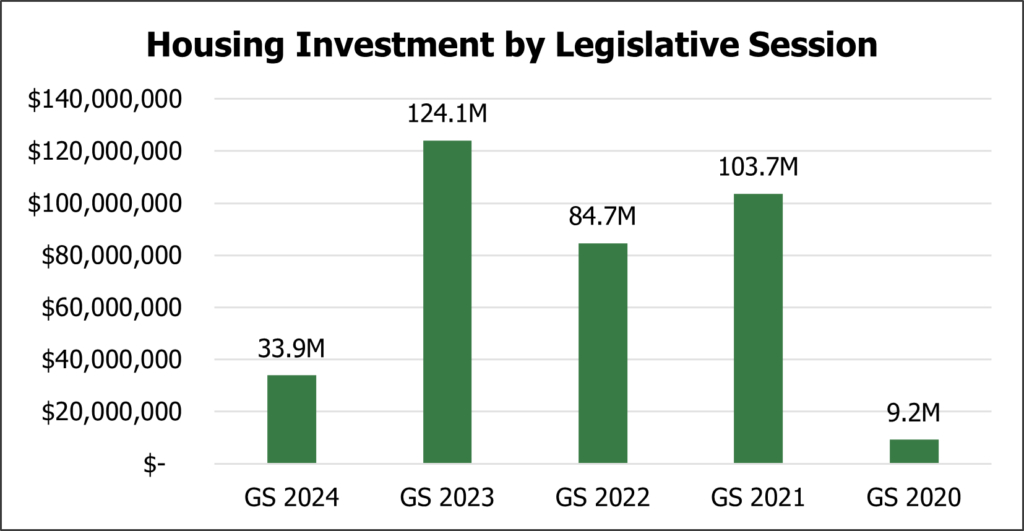
In the 2021 General Session, policymakers were inundated with resources provided by a revenue surplus and also pandemic aid from the federal government. This trend persisted through the 2023 General Session, as can be seen in the graph above. Due in part to above trend revenues (growth that was not likely to persist) and the fixed nature of federal stimulus dollars, most of the housing investments were focused on one-time projects.
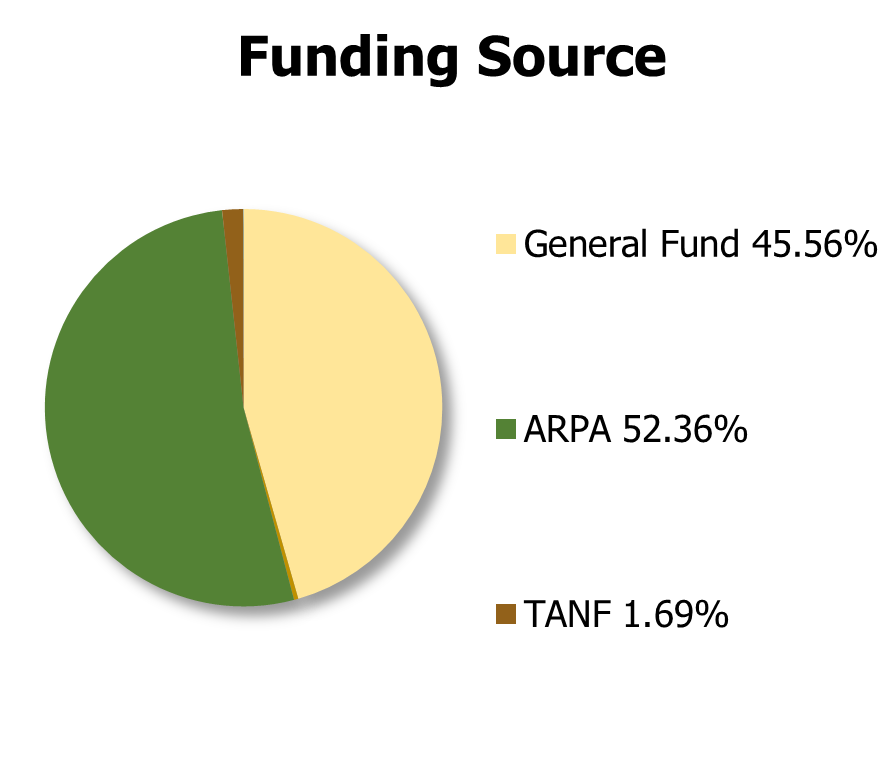
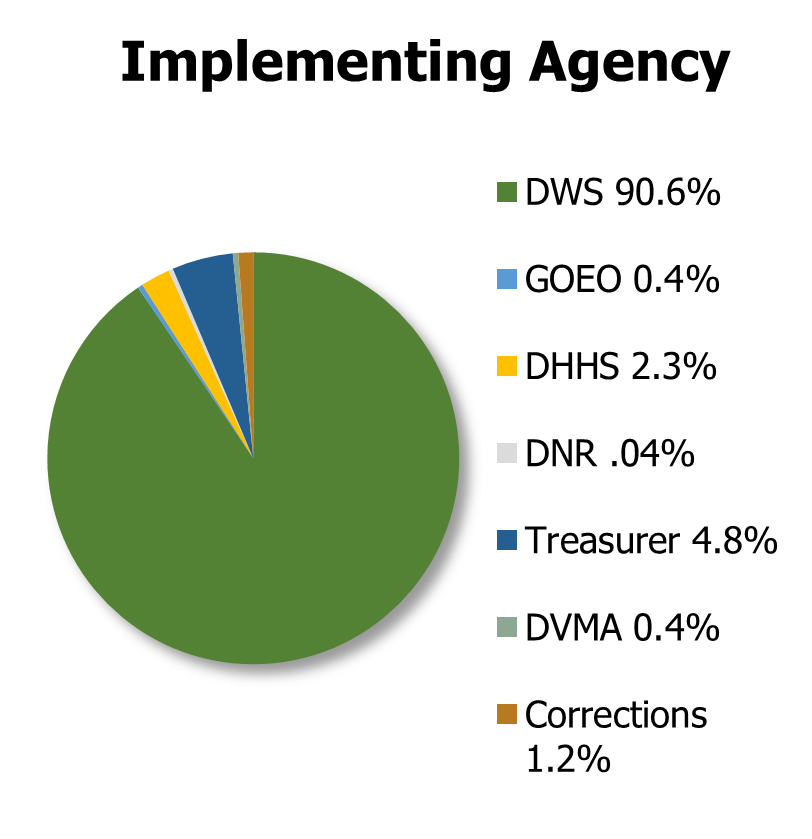
It should be noted however, that the $72.8 million in one-time funding put towards loan programs is designed to boost the state's housing in perpetuity. The largest investment area has been housing preservation, in which various tools are employed ensure that rental properties that are currently considered affordable continue to be a financially viable option. Housing preservation reduces displacement, maintains land use patterns, and is generally cheaper than building new infrastructure.
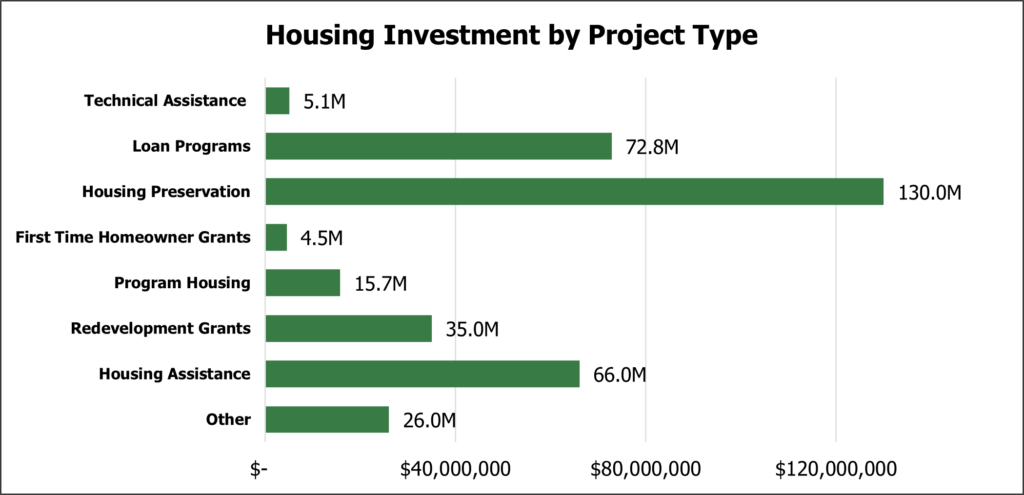
At the time of publication, the report forecasted an increase in Utah's housing shortage for 2024. While housing affordability remains a challenge, the investments made over the last five years aim to tip the momentum in favor of Utah's taxpayers.
A summary brief including funding items through the 2024 General Session is available here: Recent Legislative Investments in Housing.
From Tariffs to Taps: Recent Updates from the Dept. of Alcoholic Beverage Services
In June, the Department of Alcoholic Beverage Services (DABS) opened the doors on its latest store, an upgrade for the Salt Lake City Downtown location which was considered out of date and undersized. This first ever two-story location featuring nearly 40 doors of refrigerated products is perhaps the latest example of the shift initiated by the passage of S.B. 176, “Alcoholic Beverage Control Act Amendments” (2022 General Session) which replaced the word “Control” in the agency’s title with “Services.”
DABS is funded through the Liquor Control Fund, an enterprise fund which receives a portion of the profits from alcohol sales. Revenues not used to support the department benefit the state’s budget in other ways. In FY 2023, DABS generated $236.1 million for the state’s budget, to be used to support the General Fund, Uniform School Fund (for school lunches), public safety, and programs to prevent underage drinking. DABS estimates that this latest downtown store will generate about $13.0 million in FY 2025, of which roughly $6 would go towards these other statewide programs.
DABS Operates 52 state stores (and licenses over 100 package agencies). The total number of state stores that the Alcoholic Beverage Services Commission can authorize is capped at a rate of one store per 48,000 residents (about 72 stores currently). New and replacement facilities may be financed through revenue bonds or by appropriations from the State Store Land Acquisition and Building Construction Fund.
During the last six General Session, the Legislature has made several notable changes to the DABS construction budget:
- 2023 - DABS Warehouse and Store Construction
$140.0 million one-time from the General Fund for construction of DABS warehouse expansion and club store, Moab replacement store, Ogden additional store, and Roy replacement store. - 2022 – “Revenue Bond and Capital Facilities Amendments” (H.B. 191)
$43.1 million one-time for new stores in Park City, St. George, and replacement stores in Salt Lake City Downtown and Salt Lake City Foothill locations. - 2021 – “Revenue Bond and Capital Facilities Amendments” (S.B. 143)
$17.2 million one-time for construction for new stores in Sugarhouse (Salt Lake City) and east Sandy. - 2020 – “Revenue Bond and Capital Facilities Amendments” (H.B. 9)
$2.1 million one-time for expansion of the Salt Lake City Foothill store. - 2019 – “Revenue Bonds and Capital Facilities Authorizations” (S.B. 9)
$24.1 million one-time for relocation of the Salt Lake City Downtown store and construction of new stores in Taylorsville and West Valley City.
Another key responsibility of DABS is to license alcohol production and retail establishments (retail locations being primarily bars and restaurants). During the 2024 General Session, the Legislature passed House Bill 548, “Alcohol Amendments” which made a wide variety of policy and budget changes. The key items impacting the budget include:
- An estimated 312 additional Full-Service Restaurant Licenses by FY 2031 (based on population);
- An estimated 136 additional Bar Licenses by FY 2031 (based on population);
- 0.5% increase on the markup on liquor, wine, and flavored malt beverages to support substance use disorder treatment services;
- A gradual increase in the per-barrel beer/heavy beer tax from $13.10 to $14.10 by FY 2027 to provide for three new alcohol law enforcement officers within the Department of Public Safety; and
- Establishes a “round-up” program, which allows state liquor store customers to round up the customer's purchase to the nearest dollar for deposit into the Pamela Atkinson Homeless Account.
As discussed in our post from last September, the Legislative Fiscal Analyst and Governor’s Office completed an efficiency evaluation of the DABS inventory management system during the 2023 interim. The Department reports they have either completed or are in the process of implementing the following recommendations:
- Adopt industry best practices for inventory;
- Create a structured listing and delisting process to ensure data-driven decision making; and
- Evaluate performance and life cycle of listed products to be more agile in addressing need and demand.
DABS is uniquely charged with not promoting the consumption of alcohol while recognizing that their net revenues support government services. As the state populations grows, and Utah looks forward to hosting the 2034 winter Olympics, the Legislature will continue to evaluate the best path forward for the state’s liquor control budget.
Belt-Tightening in Comfort: How the 2024 General Session Prepared Utah for a Deficit
In July we covered the Statewide Master Plan, a guide for state office space planning and investments. In that post, it was discussed how both the 2023 and 2024 General Sessions contingently put money towards the Plan, if certain revenue collections materialized. The shortfall in FY 2023 resulted in a rescinded $125.0 million appropriation. During the 2024 General Session, $100.0 million was appropriated for the plan, similarly contingent on the outcome of FY 2024.
The July Revenue Snapshot shows the preliminary FY 2024 yearend collections compared to forecasted revenues (which is what legislators use to budget). Based on current revenues to the General and Income Tax Funds, collections are $39.2 million below the forecast. When including the Transportation Fund, this deficit increases to $61.2 million. As indicated in the report title, these numbers are preliminary and will change when outstanding transfers are made between now and the final report in October. For instance, the current report includes an estimate for liquor store profits (which impact the General Fund), however the actual yearend closeout may differ. While October’s numbers may be adjusted up or down, the general direction of collections can be understood. Thankfully Legislators have padded the current budget with a cushion capable of absorbing the final impact.
Tight budget years underscore the importance of interim review by Appropriations Subcommittees. Each year, every subcommittee examines 20% of their budgets in the Accountable Budget Process (ABP), allowing a 5-year cycle to analyze the entire state budget. While many budget adjustments are made during the General Session, 45 days rarely provides enough time to do the deep dives necessary to ensure efficient use of taxpayer dollars. The ABP provides an extended timeframe to tackle difficult questions about ongoing funding included in agency base budgets, performance measures, fee revenues and more.
Generally speaking, a deficit in the current budget year amounts to a lower base and adjusts the starting point for the new fiscal year. However, revenue projections will be updated in the regular consensus process this fall and adopted in December by the Executive Appropriations Committee ahead of the General Session. Also in December, Legislative Economists will publish their Long Term Budget report, one of the products in a triennial cycle that works to improve the long term fiscal health of the state. While the Legislature can’t control the economy, they can utilize budget strategies to make the state resilient to a suite of economic scenarios.
Refined Revenues: How Economists are Improving Collections Tracking
When conjuring a picture of the state’s budget, appropriations (authorized spending) and expenditures (actual spending) jump to the front of mind. However, both appropriations and expenditures hinge on revenues, both forecasted and collected. This flip side of the budget coin provides a unique challenge for policy makers, since revenues in the short term are largely a function of the broader economy and are not controlled by an appropriations bill.
Unfortunately, the Legislature can’t explicitly set a specific level of sales tax dollars collected each year, (that would be great though). Instead, legislative economists rely on signals from both recent collections and economic data to predict the state’s spending capacity for up to 18 months into the future. These signals, called economic indicators, include things like real estate permits, population, commodity prices and more. This practice of evaluating data and forecasting available revenue is what comprises the consensus revenue process. The semi-annual activity includes economists from the Tax Commission, Governor’s Office of Planning and Budget (GOPB), and the Office of the Legislative Fiscal Analyst (LFA). Revenue figures for the current and upcoming fiscal years are approved in December before the General Session, and updated in February ahead of final budget decisions. In the spring and fall, the range of expected revenues is again updated based on the latest available information.
Down to the Day
Outside of these forecasting windows the primary focus is tracking and monitoring revenues rather than predicting them. The key question the LFA seeks to answer during this time is "are current collections in line with the latest expectations?"
This monitoring role has typically been addressed via the monthly TC-23 report from the Tax Commission along with a companion report, the Revenue Snapshot, produced jointly with GOPB. The snapshot, which adds on major non-tax revenue sources in addition to those found in the TC-23, focuses on providing commentary and additional context to the collections data. In pursuit of helping decision makers evaluate current collections, LFA has been developing new analytical tools to improve monitoring up-to-date revenue collections.
While monthly data is certainly more timely than annual data, the economy is in a continuous state of flux; even monthly reporting of that process loses much of the resolution and nuances necessary to contextualize collections as they flow in. Identifying trends -- and more importantly, deviations from trends -- as they happen, is vitally important to evaluating collections against year-end revenue targets.
Getting a Clearer Picture
To better accomplish this task, LFA has begun utilizing daily data via the state accounting system database. By charting each day, economists can see state revenue collections in new ways, and more clearly than before. An example of this increased granularity, featuring total unrestricted General Fund revenue for fiscal year 2024, can be seen below:
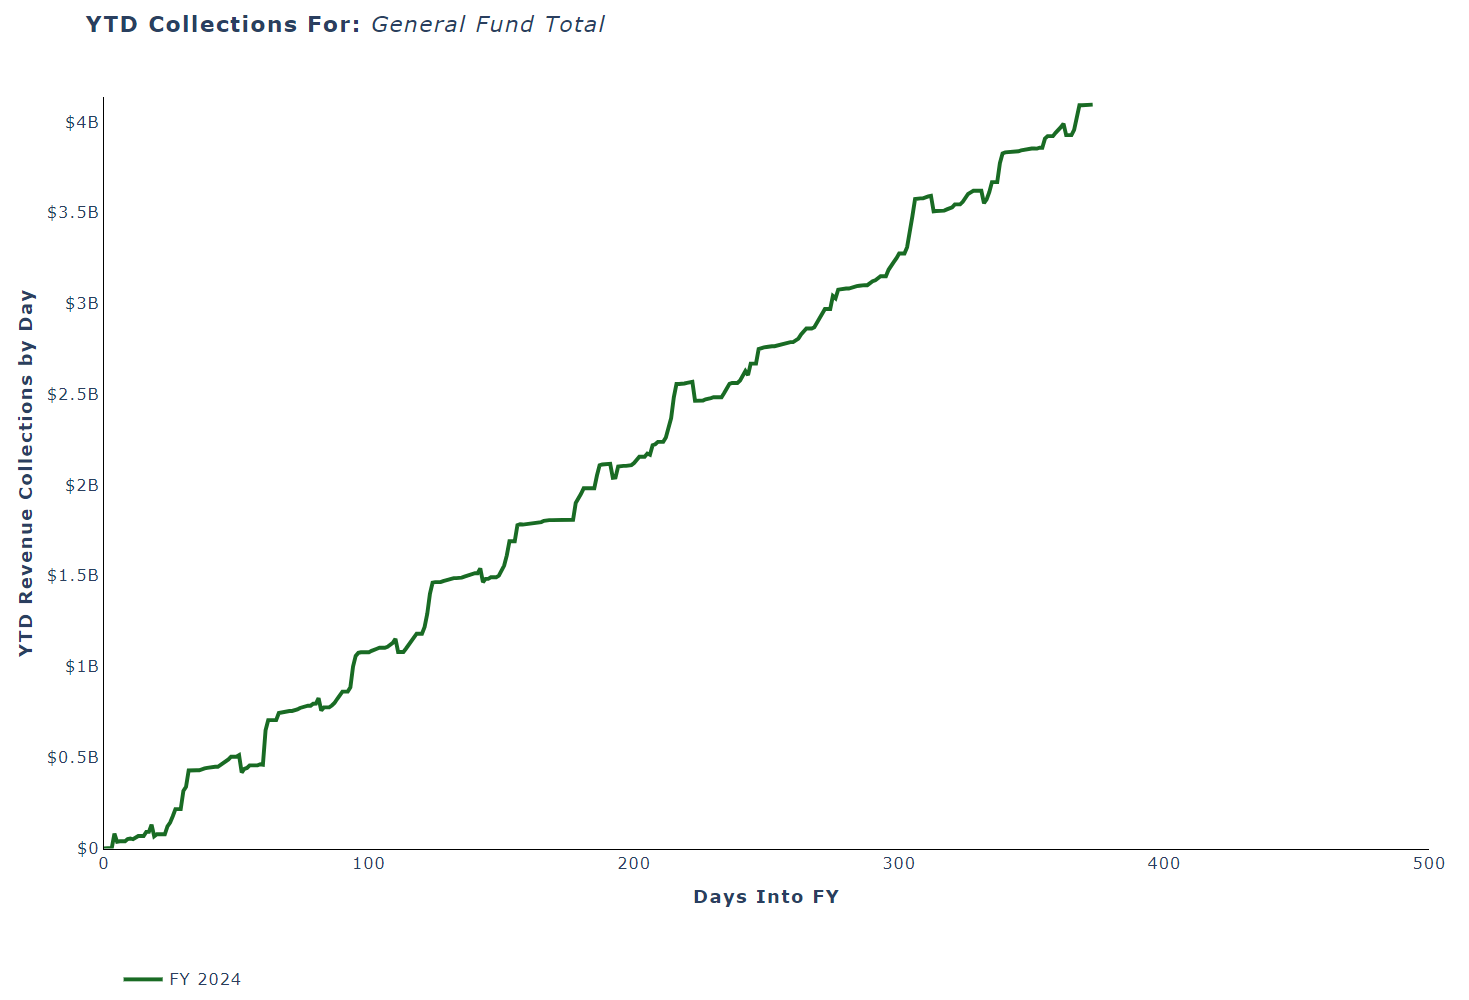
Starting from “Day 0” for any given fiscal year (July 1st), total year-to-date collections for the state’s major revenue sources can be tracked in near real-time as the year progresses. Because many revenue sources are subject to year-end transfers and accounting close-out activities, these charts extend beyond 365 days to fully capture the entire fiscal year’s data.
For better context around the current year collections, previous data is compared. This is shown below, for total General Fund collections in the past 10 years:

It’s clear that the amount of revenue collections has grown over the last decade, particularly since FY 2020: federal pandemic aid along with a shift in consumer spending towards goods (away from services) served to boost sales tax collections, which make up the majority of General Fund revenue.
You may also notice that throughout any single year there are fairly consistent, repeating patterns that appear as the periodic “bumps”, in this case with monthly frequency. These are primarily the result of the monthly remittance of sales tax to the state. However, as can be seen below in Corporate Income Tax, revenue sources behave differently:
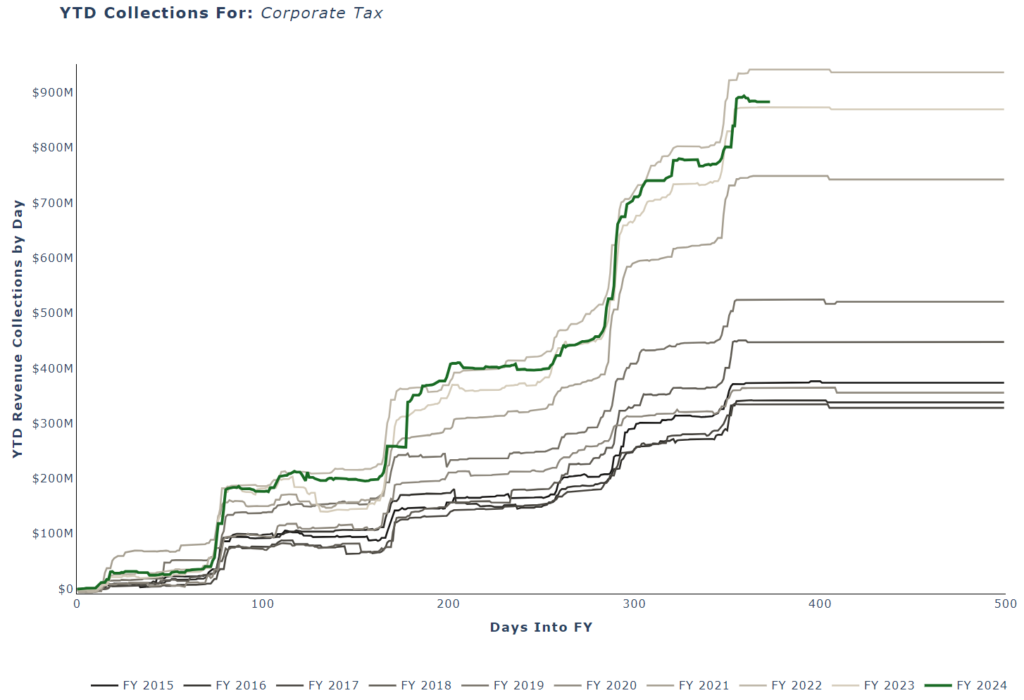
Corporate Income Tax is subject to quarterly estimated payments, hence jumps occurring roughly every 90 days rather than monthly with sales tax. These differing paths for each individual revenue source throughout the year are not just conceptually informative-– economists can utilize these patterns to bridge the gap between existing yearend revenue targets and the current year-to-date actual collections to derive an estimate of where collections “should be” at any point of the fiscal year. To illustrate, the graph below features Motor Fuel Tax collections:
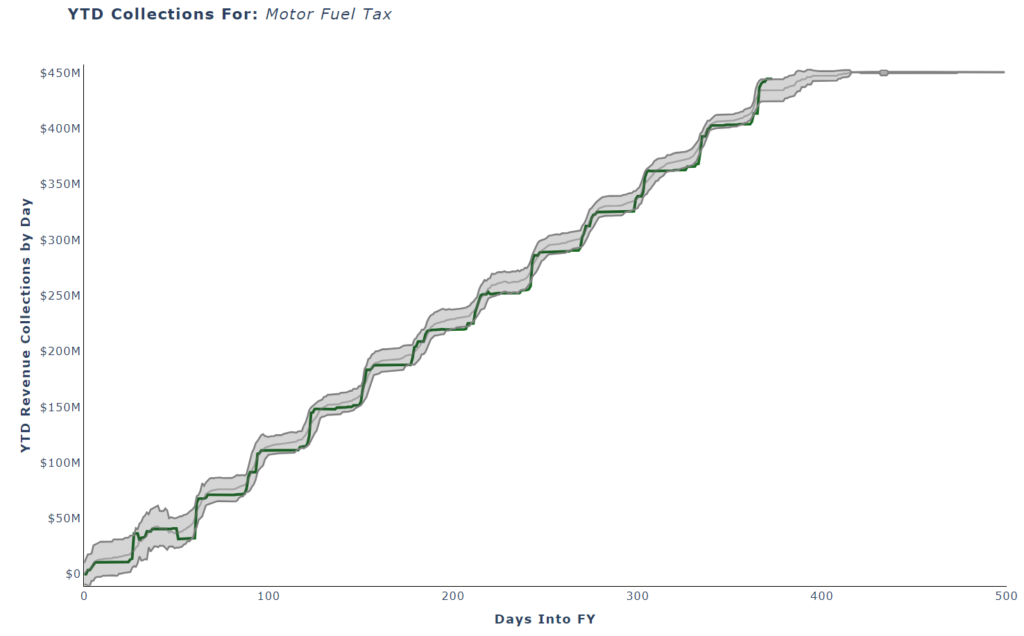
By comparing where collections “should be” and actuals, economists are improving their interpretations of the state’s fiscal situation. In the graph above, the middle grey line is the average “path” collections would be expected to follow based on historical data, if the yearend consensus target is to be realized. Each revenue source has an accepted degree of variability in its collection path. From this, economists derive a reasonable range of estimates above and below a daily mean, which is reflected as the shaded grey area in the graph.
With these tools in hand, the state’s ability to monitor and evaluate revenue collections as they happen is significantly improved. While these analyses still cannot explain why a particular revenue source may be higher or lower than expected, they can help identify deviations earlier in the budget cycle, providing a clearer signal for where collections are likely heading. In concert with actively monitoring economic indicators, this daily system for tracking revenue collections provides Legislators with a more timely and complete picture for the most mysterious part of the budget equation.
Budgeting for the Backcountry: Utah's Trailblazing Investments in Outdoor Recreation
In the 2021 General Session, the Legislature separated the Divisions of State Parks and Outdoor Recreation which were previously a single line item housed in the Department of Natural Resources. The following year, the Office of Outdoor Recreation in the Governor’s Office of Economic Opportunity was combined with the new division to complete a single piece in the budget for all things related to recreating in the great outdoors. The purpose of this post is to highlight the significant investments and focus the Legislature has made for Outdoor Recreation in recent years.
The graph below shows the budgets for the two divisions before and after the separation of the State Parks program from Outdoor Recreation:
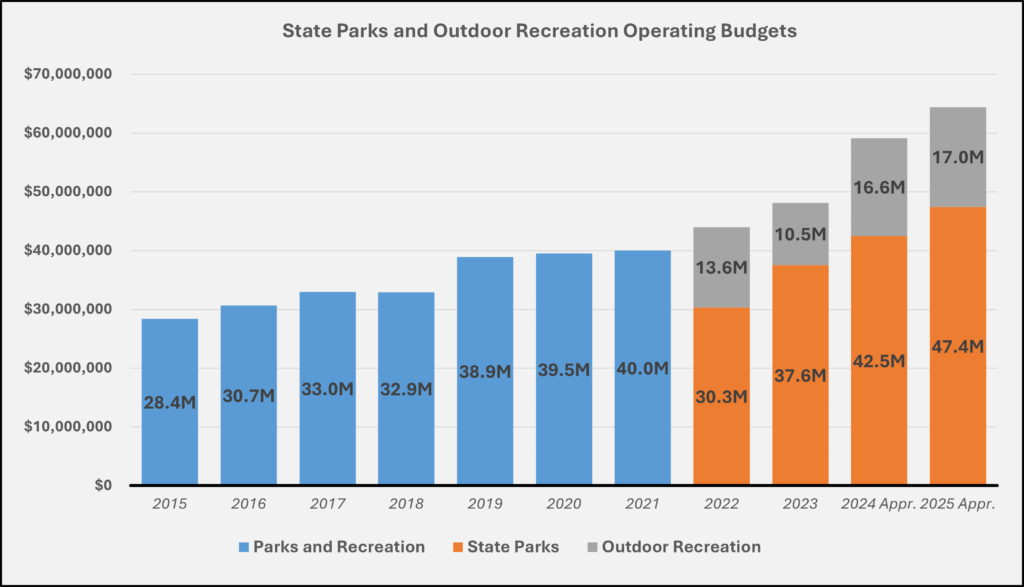
As can be detected in the chart, starting in FY 2022, a significant effort was made by the Legislature to expand financial resources for both State Parks and Outdoor Recreation. While State Parks have the benefit of a single point of entry which is used to collect user fees, the broad scope of outdoor recreation provides a unique financial challenge for improving trails and other types of costly infrastructure.
The Division of Outdoor Recreation’s (DOR) budget includes two line items:
- Operations: $17.0 million (80% restricted funds)
- Capital: $60.0 million (70% restricted funds)
DOR is tasked with the providing, maintaining, and coordinating motorized and nonmotorized recreation, and is charged as being the recreation authority of the state. Specifically, the division regulates Off-highway Vehicles (UCA 41-22) and enforces the State Boating Act (UCA 73-18). Another key responsibility of DOR is to plan and develop a recreational trail system throughout the state.
The division also administers several different grant programs, funded by both state and federal sources. Detailed information about each these grants is available in this summary table: DOR Grant List.
State funded grants along with the FY 2025 appropriations include:
- Utah Outdoor Recreation Grant (UORG) -- $10.2 million
- Recreation Restoration Infrastructure Grant (RRI) -- $1.5 million
- Outdoor Recreation Initiative (Recreation Coordinated Investment Initiative) -- $33.6 million
- OHV Recreation Grant (OHVR) -- $3.7 million
- Utah Boating Grant -- $0 (new program in FY 2024, see grant list)
Funding for the division’s operations, capital projects, and grants comes from a variety of sources including Sales Tax, General Fund, and user fees. The division currently uses revenue from the following major accounts:
- Outdoor Adventure Infrastructure Restricted Account (UCA 51-9-902): collects 1% of state sales tax;
- Outdoor Recreation Infrastructure Account (UCA 79-8-106): collects transient room tax;
- Boating Account (UCA 73-18-22): collects registration and license fees, fines, motor fuel tax from fueling boats; and
- Off-highway Vehicle Account (UCA 41-22-19): receives registration fees, out of state user fees, special license plate contributions, and .5% of motor fuel tax.
Investment in Outdoor Recreation has many benefits for Utahn’s quality of life and helps in the preservation of the state’s natural resources. As described in this post, the budget for DOR is balanced between a general tax base and user groups who benefit from the state’s investments and regulation of specific activities. Another function of the Division is law enforcement, which helps ensure that tourists and residents are safe while enjoying the diverse landscapes that can only be experienced in Utah.
A Higher Standard: How the 2024 New Funding Follow-Up Report Helps Improve Outcomes
When the Legislature appropriates new funding for a project, it’s kind of like your family setting out on a road trip to your favorite theme park—if the journey is successful, you’ll make it to the place where all your dreams come true. Appropriating the funding is like getting on the freeway, it's a starting point but it’s not the intended destination. Along the way, you’re constantly tracking indicators of your road trip “performance” much like those in the New Funding Follow-up Report (Follow-up Report):
- Schedule: Are you on schedule to arrive before it gets dark or before your kids start going stir-crazy in the backseat?
- Spending: Are you staying within your budget for your favorite gas station snacks?
- Performance: Are you on the right route, or have you veered off course due to a wrong turn or a missed exit?
For each newly funded item, the Follow-up Report tracks key indicators about a project’s progress on its journey to the ultimate destination: benefitting Utahns. The report tells users if a project is on schedule, within budget, and for projects over $500,000, whether it’s meeting customized performance measures that represent positive, intended outcomes for taxpayers.
Based on information reported from the agency administering the project, Legislative Fiscal Analyst (LFA) staff make targeted recommendations for the legislature to “course correct” as needed on funded projects. This year’s report compiles data on 544 funded projects, representing $5.3 billion in new funding and over 100 recommendations for appropriations subcommittees to consider.
Tailored Recommendations
Based on the information reported back from each agency, analysts can make a variety of different “course-correction” recommendations back to legislators. Examples include:
- Re-allocation or Reduction of Funding: Sometimes a project doesn't require the full funding amount to be successfully implemented, so remaining funding may be better spent elsewhere. Analysts might recommend one-time or ongoing reductions in funding in these cases.
- “Menus” of Solutions: Other times, agencies or analysts may identify an issue that could be solved in multiple ways. For example, if it’s discovered that the actual costs of a program will exceed the initial appropriation, the recommendation might come in the form of a “menu” of options for resolving the shortfall that a subcommittee can choose from.
- Repeat Reporting: Finally, some projects may need to be revisited in future fiscal years for repeat reporting. This might be recommended when a project’s implementation was delayed or when agencies need more time to accurately measure the outcomes of a project.
Improvements for 2024
Just like the auto makers that are continually improving the dashboard displays in new cars, LFA and Governor’s Office of Planning and Budget (GOPB) set out to make this year’s online reporting dashboard more interactive. Additional functionalities include the ability to see project details from the “Action Items” and “Responsiveness” pages, as well as a filter on the “Future Years” page to find when a funded project will be reported on. The back-end functionality has also been improved through upgrading to PowerBI to improve the speed, quality, and customization of the underlying data analysis.
Using the Follow-Up Dashboard
For a tutorial on the updated dashboard, check out the LFA Performance Team's presentation to the Executive Appropriations Committee earlier this week. The tutorial covers what information lives on each view of the dashboard and how to search and filter for the data you need.
Looking Forward to 2025
LFA and GOPB are already planning improvements for the 2025 report, and are happy to share a sneak peek of upcoming changes:
- Integration with ongoing line item measures; and
- Process improvements for setting measures that adhere to legislative intent and capture real impacts on Utahns rather than just inputs or activities.
The Follow-up Report is designed to provide transparency and accountability in how taxpayer dollars are used, and also provide legislators with decision making criteria, based on objective information. Staff welcome feedback for how to improve the tool in future years for the benefit of legislators and constituents.
Au Courant on Appropriations: Changes to Subcommittees and State Grant Processes
This fall, the leaves won’t be the only thing changing around the Capitol. During the 2024 General Session, the Legislature passed both a resolution and a bill that impact the appropriations process. This post summarizes how H.J.R. 23 and H.B. 335 will impact the budget even before the 2025 General Session gets underway.
H.J.R. 23 “Legislative Process Amendments”
This resolution added an eighth topical appropriations subcommittee and retitled two existing committees.* Starting in November, the following structure for appropriations subcommittees will be in place:

The renamed General Government committee will acquire regulatory entities from the subcommittee formerly known as Business, Economic Development and Labor (BEDL). These agencies include the Labor Commission, Financial Institutions, Tax Commission, Public Service Commission, Commerce, and Insurance. The plan is also for this committee to acquire the Executive Offices from the current EOCJ committee, including the budgets for the Governor’s Office and State Auditor.
This change allows the new BEDL to focus on Economic and Community Development. In that spirit, the committee will now include the Department of Workforce Services (reallocated from Social Services). As noted in the graphic above, two committees (Social Services and Natural Resources, Agriculture, and Environmental Quality) will see slight adjustments to their respective budgets though no new titles were warranted.
In addition to being more narrowly focused on health and human services, the Social Services committee will go from two meetings to one each interim or session meeting day. This change aligns Social Services with the other appropriations subcommittee schedules, and accommodates the additional committee being added to the mix.
The new Transportation and Infrastructure committee will acquire pieces from the former “IGG” committee, such as (you guessed it) Transportation, Capital Budget, Utah Education and Telehealth Network, and Debt Service. To compliment this bond-loving-budget, the committee will also oversee the Treasurer’s Office. Membership for each of the committees will be determined by presiding officers, after Legislative leadership elections this fall.
The last and maybe most exciting change induced by H.J.R. 23 is that the fiscal note threshold for bills that do not need to be prioritized was increased from $15,000 to $20,000.
H.B. 335 “State Grant Process Amendments”
This legislation aims to improve the efficiency and accountability of state grant programs. The bill provides a ‘default’ for all grant appropriations being a “Competitive Grant”, which requires contractual agreement to performance measures, deliverables, and audit procedures. The process also outlines that each grant must determine a payment schedule and tie deliverables to each installment, only making final payment upon receipt of agreed upon work products.
UCA 63G-6b does not apply to grants that are specifically authorized in statute, but the processes are considered best practices for awarding state funds to pass-through entities. Legislators can request that the Executive Appropriations Committee authorize a “Direct Award Grant” which allows a recipient or class of recipients to be identified in intent language each fiscal year. The Request for Appropriations (RFA) process will offer legislators the option to request a Direct Award Grant on the application form.
*The Executive Office and Criminal Justice appropriations subcommittee was not renamed by this resolution, however a Technical Correction is expected during the 2025 General Session which would make this third retitled committee simply “Criminal Justice.”
Q&A with LFA: the Top 5 Questions Answered by the Fiscal Health Dashboard
The Fiscal Health Dashboard is a one-stop shop for legislators and constituents to answer questions about Utah’s current and long-term financial position. The Legislative Fiscal Analyst developed the dashboard in compliance with both UCA 36-12-13(2)(h) and J.R. 3-2-402. Though the statutory and rule requirements are to prepare the legislature for an upcoming General Session, the revenue and expenditure portions of the dashboard are updated monthly. The Fiscal Health Dashboard is organized into four sections: Obligations, Reserves, Expenditures, and Revenues.

Using the Dashboard
The data includes for each category, 10-year history, current growth rate, and a visual gauge which compares the item’s status to the historical average. The gauges represent trends, where a centered gauge is on trend with the historical average, and the red and green sections are two standard deviations from the mean. As you might expect, higher obligations and expenditures would fall to the red side of the gauge, whereas increases in reserves or expenditures would push the gauge needle towards the green area.

For more information on any category, you can hover over the title of the item and a tooltip will appear that explains what’s included in that area of the budget.

Without further ado, we give you the top five questions answered by the Fiscal Health Dashboard:
1. How close is the state to its constitutional debt limit?
Look no further than the General Obligation Bond Debt graph on the Obligations tab. The state is at about 14% of the constitutional debt limit, as of FY 2023 (FY 2024 is still in closeout and will be updated later this month).

2. What’s the balance of the Permanent State School Fund (Trust Fund)?
Scrolling to the bottom of the Reserves tab, you’ll find information on the Permanent State School Fund, which is sitting squarely in the green section of the fiscal health gauge. As of FY 2023 close out, the fund balance was almost $3.1 billion.

3. Did the General Fund have a surplus in 2024?
The first item on the Revenues tab shows the most recent information for FY 2024, which indicates that the General Fund collections were slightly ahead of revenues, by roughly $30 million. Revenues for FY 2024 are still preliminary, and will change after the final yearend calculations made by the Division of Finance.

4. Are we spending more on Higher Education than ever before?
On the Expenditures tab, you’ll find information for a variety of major state expenditures, including Higher Education. In FY 2024, state expenditures on Higher Education were 27% lower than the previous fiscal year.

5. How much does the state have in our Rainy Day fund?
That depends on which Rainy Day fund you’re interested in. The Reserves tab includes both traditional and working rainy day funds. Working Rainy Day funds include things like cash-funded buildings and roads, which could be replaced by borrowing if the state required additional revenue in the event of an economic downturn (in which case, you’d see the impact on the Obligations tab).
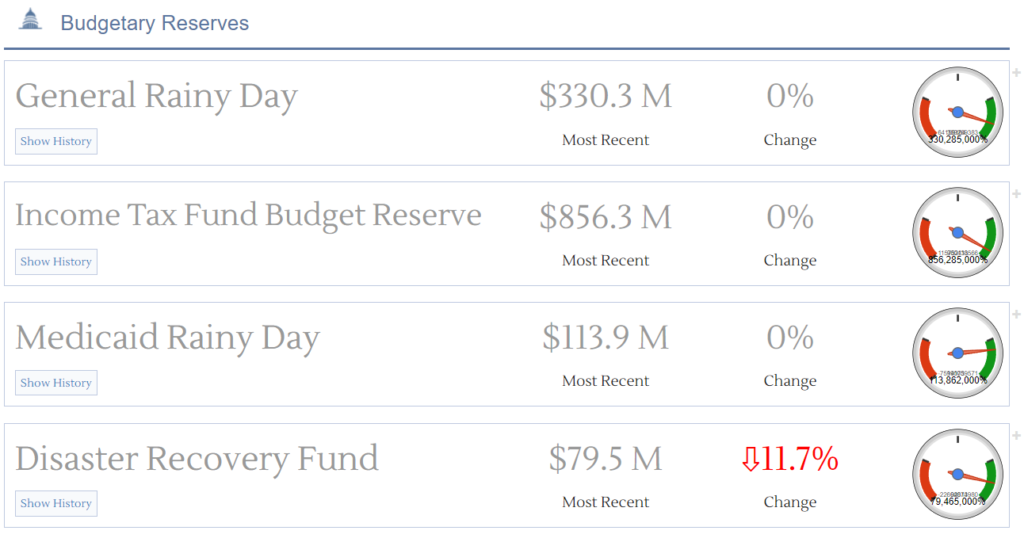
The Fiscal Health Dashboard is one product on budget.utah.gov that aims to answer questions about the state's budget before they are asked. For more information on any of the metrics presented, reach out to your friendly Legislative Fiscal Analyst.
The Story on Scholarships: Utah's Tuition Assistance for Higher Education
Within the Utah System of Higher Education (USHE), the Legislature actively funds 13 scholarship programs centrally located and overseen by the Utah Board of Higher Education (UBHE) and the Office of the Commissioner of Higher Education. Each of these programs was created statutorily, and are budgeted under the USBE Student Assistance line item.
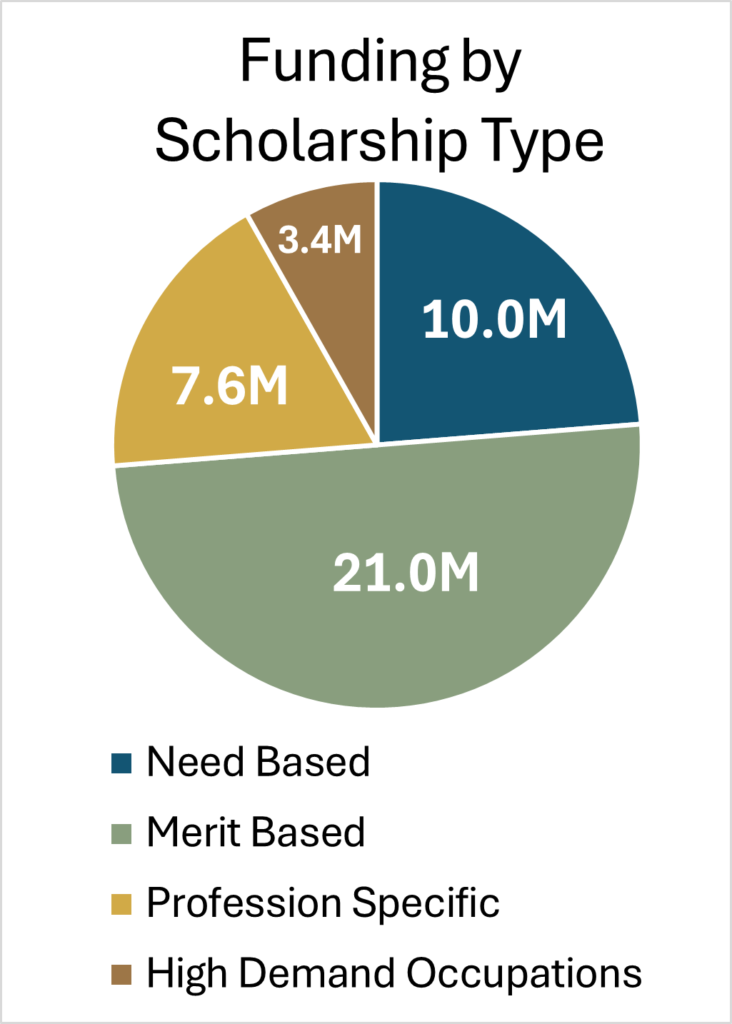
Each of these different categories of scholarship programs has a different number of awards with unique funding levels. All of the funding is ongoing, with the exception of the "Profession Specific" bucket, which is comprised of 65% one-time funds. The largest single scholarship is the 'Opportunity Scholarship' which is Merit Based. At $18 million annually, the Opportunity Scholarship is more than three times the size of the second largest scholarship, the 'Utah Promise Program' ($5.6 million annually).
The table below lists each of the scholarship programs along with the number of recipients in the 2023-2024 school year (FY 2024) and the average amount awarded. (Mobile users may view this table better in landscape orientation.)
| Program | Number of Awards (2023-2024) | Average Award ($) |
| Adult Learners Grant Program | 683 | 1,464 |
| Student Financial Aid | * | * |
| Utah Promise Program | 3,126 | 1,791 |
| Veterans Tuition Gap Program | 23 | 5,435 |
| Opportunity Scholarship | 4,310 | 4,176 |
| Prime Pilot Program Amendments | * | * |
| First Responder Mental Health | 8 | 56,250 |
| Karen Mayne Public Safety Officer Scholarship Program | 9 | ** |
| Public Safety Officer Career Advancement Grant | 18 | 8,056 |
| T.H. Bell Education Scholarship Program | 615 | 3,252 |
| CTE Scholarships | 739 | 1,488 |
| Talent Development Grant Program | 683 | 2,196 |
| Western Interstate Commission for Higher Education | 31 | 26,968 |
| Statewide Total | 10,245 | $42.0 million |
| *Awarded to institutions, not individuals | ||
| **One-time funding |
A description of each scholarship program including budget and code reference is included below:
General, Needs-Based Scholarships (Four Programs)
- The Adult Learners Grant Program is a $1 million ongoing program that provides financial assistance to students who are at least 26 years old and are pursuing an online degree or certificate in a field with industry need. UBHE prioritizes students from rural areas, minority students, low-income students, and first-generation students. The governing statute for the Adult Learners Grant Program is UCA 53B-13c.
- The Student Financial Aid Program is a $3.25 million ongoing program that fulfills the State’s required match of 2 federal financial aid programs: the Federal Supplemental Opportunity Grants (FSEOG) and the Federal Work-Study Program (FWS). FSEOG is a purely needs-based program, and FWS is supplemental funding for students who work part-time for the institution or community service. The governing statute for the Student Financial Aid Program is UCA 53B-18-204.
- The Utah Promise Program is a $5.6 million ongoing program that targets needs-based undergraduate students in Utah and is available for up to four years. Students must complete a Free Application for Federal Student Aid (FAFSA) and demonstrate financial need to qualify. The governing statute for the Utah Promise Program is UA 53B-13a.
- The Veterans Tuition Gap Program is a $125,000 ongoing program designed to help veterans complete a bachelor’s degree after all other forms of aid to veterans have been exhausted. The governing statute is UCA 53B-13a.
General, Merit-Based Scholarships (Two Programs)
- The Opportunity Scholarship is an $18 million ongoing program available to all Utah High School Students. Students must complete certain advanced courses while in high school and graduate with a certain grade point average to qualify. The Legislature created this program as a combination of the old Regents Scholarship and New Century Scholarship when the technical education and higher education system were combined in 2021. The governing statute is UCA 53B-8-201.
- The Prime Program is a $3 million ongoing program that awards scholarships to students who completed at least five concurrent enrollment courses and at least six career and technical education courses from a technical college while still in high school. The governing statute is UCA 53E-10-309.
Profession-Specific Scholarships (Four Programs)
- The First Responder Mental Health Program is a $450,000 ongoing program that provides grants to first responders to enable them to seek additional degrees and certifications in mental health therapy. The governing statute is UCA 53B-8-117.
- The Karen Mayne Public Safety Officer Scholarship Program is a $5 million one-time program that provides scholarships to recent high school graduates who want to pursue a career in public safety. Recipients of this scholarship may not receive the Public Safety Officer Career Advancement Grant. The governing statute is UCA 53B-8-112.5.
- The Public Safety Officer Career Advancement Grant is a $145,000 ongoing grant program that provides grants to public safety officers who are seeking a degree in a criminal justice related field. Recipients of this grant may not receive the Karen Mayne Public Safety Officer Scholarship. The governing statute is UCA 53B-8-112.
- The T.H. Bell Education Scholarship Program is a $2 million program that provides scholarships to those interested in pursuing a career in education or speech pathology in the State of Utah. Recipients must commit to teaching in Utah after graduation. The governing statute is UCA 53B-8-116.
High-Demand Program Scholarships (Three Programs)
- The Career and Technical Education (CTE) Scholarship Program is a $1.1 million ongoing program to help students pursue certification at one of the State’s technical colleges. Awards target high demand fields as determined by the Department of Workforce Service, and these dollars are the primary form of financial assistance for the State’s CTE students. The governing statute is UCA 53B-8-115.
- The Talent Development Grant Program is a $1.5 million ongoing program that provides scholarships to those seeking a certificate or degree in a high-demand field as determined by the Governor’s Office of Economic Opportunity. The governing statute is UCA 53B-10-2.
- The Western Interstate Commission for Higher Education (WICHE) is an $836,000 ongoing program that pays dues to WICHE and provides scholarships for students participating in WICHE. WICHE allows students in western states to travel to different states to pursue post-graduate education in a field that is not taught in the student’s home state. The student pays a reduced tuition rate compared to other out-of-state students as part of this agreement. The governing statute is UCA 53B-4.
This interim, the Higher Education Appropriations Subcommittee has included statewide scholarships in their Accountable Budget Process. Next Tuesday, the committee will consider how best to implement performance measures for each scholarship to ensure that state funds are making an impact for their intended demographic.
Stay tuned for next week when we recap the outcomes of the Accountable Budget Process for each appropriations subcommittee.
Trust the Process: Prepping Budgets for the General Session
During the Legislative "off season," appropriations subcommittees are hard at work diving into the nitty-gritty, budgetary details that no General Session allows enough time to explore. These deep dives are organized under the Accountable Budget Process, a statutory requirement set in motion by H.J.R. 18 from the 2019 General Session. This process allows subcommittees to consider every program in the state budget over a five-year cycle.
Outcomes of the Accountable Budget Process may include budget adjustments, program eliminations, reporting requirements, improved performance measures, fee changes, or recommendations for statute amendments1. By undertaking the process during the interim, appropriations subcommittees can be better prepared for changes that are needed during the General Session.
Starting in the 2021 interim, Public Education was excused from the Accountable Budget Process for the purpose of evaluating the funding structure for public education, with specific study requirements outlined in statute. This alternate review was repealed January 1st, 2024. Because the five year cycle for the Accountable Budget Process will restart in the 2025 interim, the Executive Appropriations Committee approved an additional year of focused study for the Public Education Appropriations Subcommittee.
2024 Accountable Budget Process Outcomes
The table below lists actions taken by each appropriations subcommittee. (Mobile users may view this table better in landscape orientation.)
| Appropriations Subcommittee | Agencies Reviewed | Recommendations | Committee Actions |
|---|---|---|---|
| Business, Economic Development, and Labor | Labor Commission, and Tax Commission | Recommendations Sheet | Approved all motions except 5 and 6. |
| Executive Offices and Criminal Justice | Non-Criminal Justice Programs | Recommendations Sheet | Approved all motions except 14 and 24. |
| Higher Education | Utah Board of Higher Education | Voting Outcomes Summary | Actions reflected in the linked document. |
| Infrastructure and General Government | TIF Capacity Program, and Internal Service Funds | Voting Outcomes Summary | Actions reflected in the linked document. |
| Natural Resources, Agriculture, and Environmental Quality | State Parks, Outdoor Recreation, Public Lands Policy Coordinating Office, School and Institutional Trust Lands Administration | Voting Outcomes Summary | Actions reflected in the linked document. |
| Public Education | State and Local Public Education Budget Process, and Property Tax Equalization | Recommendations Sheet | Approved all motions. |
| Social Services | Medicaid Services, Welfare Assistance, Primary and Family Care | Voting Outcomes Summary | Actions reflected in the linked document. |
Just as no two budgets are the same, every accountable budget process is unique. Outcomes reflect coordinated work by agencies, legislative staff, and subcommittee members to ensure that public resources are being used prudently and follow legislative intent.
TIF Talk: Understanding the Lingo of Transportation Funding
The Transportation Investment Fund of 2005 (or TIF for short) is one of the largest accounts in the state budget, with revenues of over $3.2 billion in FY 2025. While appropriations for transportation projects represent a significant part of the state's budget, the funding sources for these projects can be a bit confusing. In committees, you may hear references to "the TIF", in which presenters could be referring to the TIF of 2005. However, there are actually many TIFs in the state budget. The figure below describes how the various Transportation Investment Funds (TIFs) are related:
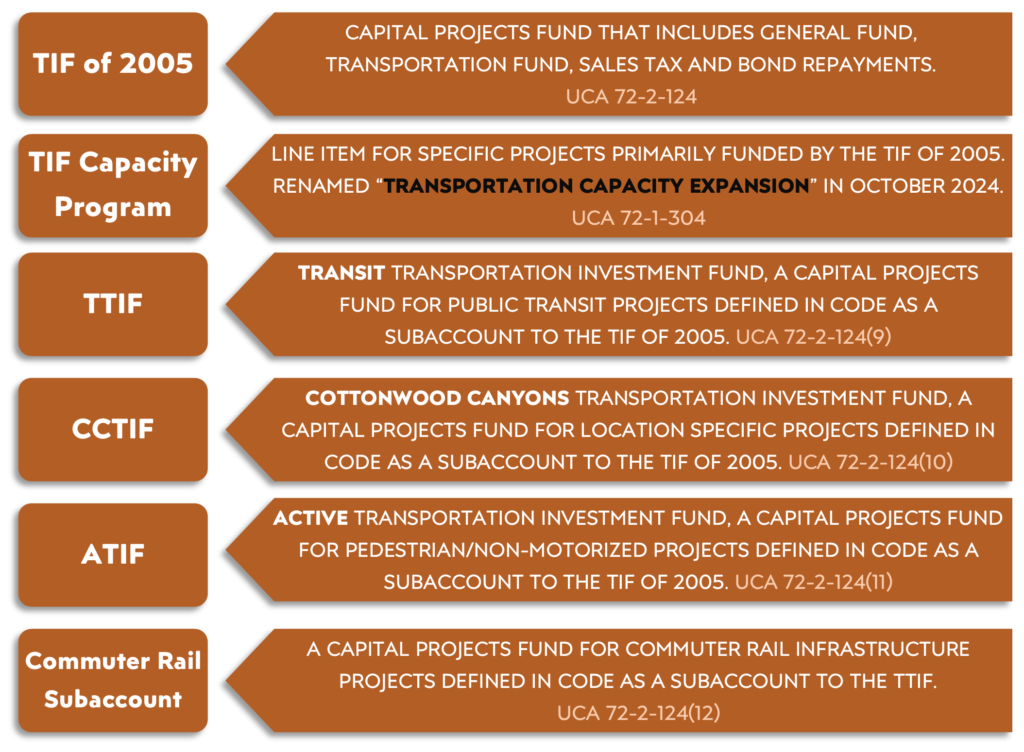
The TIF of 2005 is a Capital Projects Fund that reflects all state highway projects funded by bond, state fund appropriations, interest earnings, or sales tax earmarks. Capital projects funds do not appear in UDOT’s operating and capital budget. Since Fiscal Year (FY) 2022, the Legislature has appropriated roughly $3.1 billion one-time from the General Fund to the Transportation Investment Fund (TIF) of 2005 for transportation projects. In FY 2025, the Legislature appropriated an additional $330.0 million ongoing to the TIF of 2005, which is considered a working rainy day fund. As noted in the chart above, the TIF of 2005 is the foundational account for the state's transportation infrastructure funding.
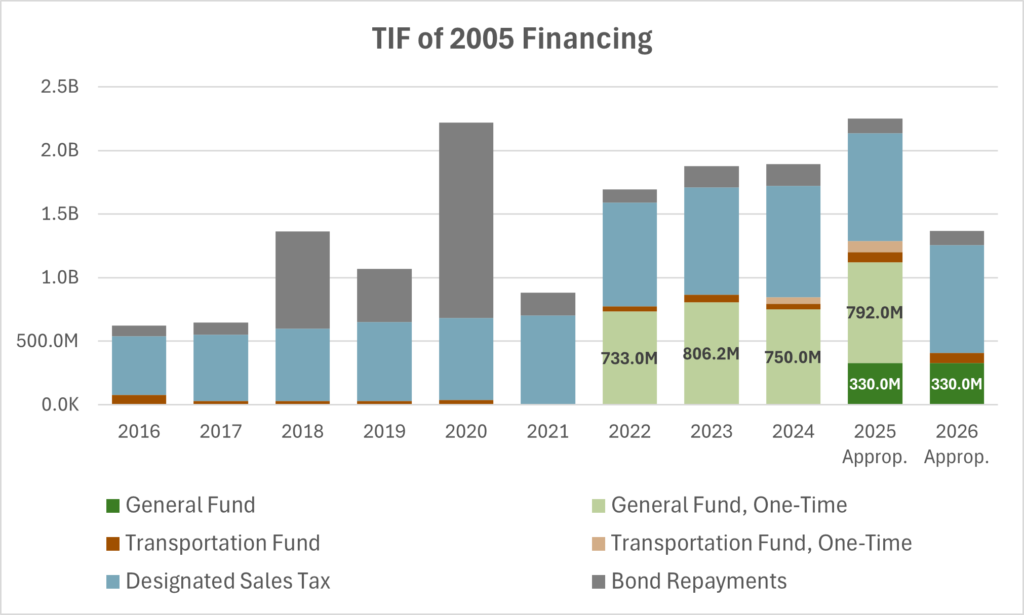
TIF Capacity Program is a line item that accounts for Utah’s highway expansion projects, primarily funded by the TIF of 2005. For increased clarity, the Infrastructure and General Government Appropriations Subcommittee renamed this line item “Transportation Capacity Expansion” during their October 2024 interim meeting. The committee also approved the creation of separate line items for the ATIF, CCTIF, and Commuter Rail (subaccount of TTIF), which will appear in the UDOT operating and capital budget.
Recent Investments in Transportation
The Legislature is authorized make one-time General Fund appropriations to fund ‘Phase 1’ projects included in Utah’s Unified Transportation Plan that have not been funded through the Transportation Commission's written prioritization process. The lists below include additional information about individual funded projects according to session, appropriated to both capital projects funds as well as the UDOT operating and capital budget.
2024 General Session ($1.33 billion General Fund - FY 2025)
The Legislature appropriated $775.0 million one-time from the General Fund and $330.0 million ongoing to the TIF of 2005 to expedite the following state highway transportation projects:
- I-84/US-89 Interchange Reconstruction;
- Bangerter Interchanges; 4100 S to California Ave;
- Lehi 2100 North Freeway; and
- I-15 Widening from Exit 6 - Exit 8.
In addition to this funding through the TIF of 2005, the Legislature provided appropriations to local projects via the UDOT Pass-through line item:
- $5.0 million one-time from the General Fund for a Bus Storage & Maintenance Facility for Cache Valley Transit District;
- $5.0 million one-time from the General Fund to assist in the expansion of the Provo Airport Terminal Building;
- $15 million one-time from the General Fund to build a Regional Airport Control Tower at the St. George Airport; and
- $200,000 one-time from the General Fund for the Central Wasatch Mountains Project to help improve recreation experience, mobility challenges, and environmental impacts/awareness of the Central Wasatch.
2023 General Session ($1.16 billion General Fund - FY 2024)
- $3.0 million one-time from the General Fund to Transportation Pass Through to supplement Federal and local funding to expand the Provo Airport Terminal;
- $2.5 million one-time from the General Fund to Transportation Pass Through to complete an interchange in Washington City; and
- $10.0 million one-time from the General Fund to Transportation Pass Through to expand the St. George Airport.
In addition to road, plane, and rail transportation investments, during the 2023 General Session the Legislature also invested a total of $345.0 million to the ATIF, CCTIF, and TTIF:
- $45.0 million one-time to the Active Transportation Investment Fund (ATIF) to build and maintain a network of paved trail projects throughout the state. The Legislature also directed the Tax Commission to reduce the Sales and Use Tax deposit to the TIF of 2005 and redirect that revenue to the ATIF.
- $100.0 million one-time from the General Fund to the Cottonwood Canyon TIF (CCTIF) to provide enhanced bus service, tolling, a mobility hub, and resort bus stops for Big and Little Cottonwood Canyons.
- $200.0 million one-time from the General Fund to build a new FrontRunner Station at the Point of the Mountain and double-track necessary sections of the FrontRunner commuter rail system.
Aside from pass-through investments, during the 2023 General Session the Legislature appropriated $800.0 million one-time from the General Fund for UDOT to:
- Make Transportation Investment Fund bond principal and interest payments for FY 2024, FY 2025, and FY 2026;
- Pass through to build a new roadway in Herriman that runs southeasterly and connects from 12600 South to 6400 West at approximately 13000 S;
- Program an interchange upgrade that has an environmental analysis complete and has a substantial right-of-way donation, and complete an environmental analysis on West Davis Corridor at 5500 S and 1800 N;
- Conduct an environmental analysis for an interchange on I-15 at Santaquin Main Street;
- Accelerate projects.
2022 General Session (1.25 billion General Fund - FY 2023)
- $2.0 million one-time from the Transportation Fund to replace the Kearns 4015 West Bridge Structure Replacement on 4000 West;
The Legislature also appropriated:
- $232.0 million one-time from the General Fund to replace and supplement $200.0 million in bonding authority for the FrontRunner double-tracking project.
- $1.0 billion one-time from the General Fund for:
- $75.0 million to the TTIF for the FrontRunner project;
- $75.0 million to the TTIF for Point of the Mountain transit project;
- $30.0 million to the TIF of 2005 for non-motorized trails;
- $35.0 million to the TIF of 2005 for Mountainland Association of Governments to repay locals for past road investments;
- $10 million to the TTIF for the extension of 9000 S in Salt Lake County at the Mountain View Corridor;
- $5 million to the TIF of 2005 for an environmental analysis for an interchange at US-6 and Spanish Fork Center Street;
- $5 million to the TIF of 2005 for an environmental analysis and preliminary engineering for an interchange on I-84 in Mountain Green;
- All remaining funding accelerates projects ranked by the Transportation Commission.
2021 General Session ($889.6 million General Fund - FY 2022)
- $6.0 million one-time to the Ogden Airport to restore funding rescinded in the 2020 5th Special Session for improvements to utilities, roadways and access, and direct flight support.
- $5.0 million one-time for the ASPIRE Center at Utah State University to demonstrate charging systems with 5G communications, plug-in, static and dynamic wireless charging and begin to lay the groundwork for electrified transportation to help improve air quality and enable sustainable growth throughout Utah.
- $44.0 million one-time to UDOT to support enhanced trails, open space, and outdoor recreation throughout the state.
The Legislature appropriated $733.0 million one-time from the General Fund to the TIF of 2005 to expedite the following state highway transportation projects:
- $705 million for 13 different state highway projects outlined in H.B. 433; and
- $28.0 million for local pass-through projects:
- $5 million for Payson Main Street repair and replacement;
- $8 million for a rail bypass on 14600 South in Bluffdale;
- $5 million for improvements to 4700 South in Taylorsville; and
- $10 million for U.S. 40 Frontage Road improvements near Mayflower.
The Legislature also authorized $101.6 million one-time from the General Fund for the TTIF:
- $100.0 million for double tracking certain areas of the Front Runner system;
- $1.6 million for a rail station in Vineyard.
At Your Service: Statewide Internal Service Funds
You may recall last August when we discussed Internal Service Funds (ISFs) as they relate to the Attorney General’s Office. Today, we take a step back and review how Internal Service Funds play a role in the state’s budget.
Function and Purpose of ISFs
The purpose of an ISF is for an agency to provide specialized goods or services to other state agencies. The desired result is a cost-effective delivery of goods or services, as agencies don’t have to invest in training or staff for a necessary function. Client agencies are billed by the Internal Service Funds for the services they receive. Examples in Utah include human resources, purchasing vehicles, technology services, risk management, and procurement. The most recently authorized ISF was in 2018 for legal services provided by the Attorney General’s Office. Outside of the Attorney General, the Department of Government Operations manages 20 different ISFs housed under seven divisions.

Though part of state government, Internal Service Funds differ from typical agencies and line items. While a part of the budgeting process, appropriations to ISFs are non-binding; they are allowed to spend up to the amount they collect. ISFs are also unique in that UCA 63J-1-410 allows carrying negative working capital and taking on long-term debt—up to 90% of a capital assets' value—with repayment made over an asset's useful life.
Unlike traditional state agencies, statute does not require expenses to match revenues for ISFs, they are also permitted to retain earnings and carry them between fiscal years without specific intent language. Federal rules cap retained earnings for internal service funds at 30 to 60 days of operational costs depending on the ISF. Amounts in excess of these caps may be subject to federal reimbursement, as agencies paying into an ISF are supported by Federal Funds. The Legislature periodically redirects excess earnings to the General Fund or lowers rates to limit earnings.
Within the Department of Government Operations, a rate committee approves pricing for the various services available to agencies through ISF. Rates are designed to cover the actual costs of the service without running a profit. After committee approval, rates are approved by the Governor’s Office of Planning and Budget, the relevant Legislative Appropriations Subcommittee, and finally by the entire Legislature in the annual “ISF rate authorization” bill (H.B. 8 in the 2024 General Session). This legislation limits the number of permanent full time staff, fees and rates, and capital asset acquisitions.
Unlike the ISFs in the Department of Government Operations, the Attorney General Internal Service Fund is not included in the annual rate authorization bill. The ISF budget is included with the rest of their Agency budget in the Executive Offices and Criminal Justice Subcommittee (H.B. 6 in the 2024 General Session).
Reviewing ISFs in the Accountable Budget Process
During the 2024 Interim, the Infrastructure and General Government Appropriations Subcommittee reviewed the Department of Government Operations ISFs as part of the Accountable Budget Process (ABP). The Legislative Fiscal Analyst also surveyed customer agencies to evaluate their experience with the services provided, the results of that survey are available here: Internal Service Fund Customer Satisfaction Survey.
Recommendations from the subcommittee include:
- addressing surplus earnings in the 2025 General Session,
- allowing customer agencies to review bills before they are paid,
- updating statutory requirements to allow ISFs to receive compensation adjustments at the same time as other state agencies,
- giving ISFs flexibility to charge lower rates,
- adding appropriation units for transparency,
- replacing General Fund appropriations with Dedicated Credits, and
- reviewing staff reporting requirements.
The Executive Offices and Criminal Justice Appropriations Subcommittee evaluated the Attorney General ISF as part of their ABP for the 2024 interim. The committee approved the recommendation for the Attorney General to coordinate and report on a reconciliation between appropriations for the ISF and the amount budgeted to each client agency, including adjustments made during the 2025 General Session. This recommendation would position the Attorney General ISF to follow suit with the other statewide Internal Service Funds in being included in the annual ISF rate authorization bill.
Both of these appropriations subcommittees are slated to change in the 2025 General Session, but the internal service funds will remain in their rebranded committees.
The Severance Reference: Mapping Oil, Gas, and Mining Taxes in the Budget
The tax generated by the sale of oil and natural gas, and the mining of various compounds is a complicated, and widely discussed piece of the state budget. Severance tax applies to the “upstream” activity within the extractive industries, where the resource is severed from the land. Any oil, gas, or mining production in the state is subject to the severance tax at the point the resource is sold, transported, or delivered (with certain exceptions). The diagram below shows how tax revenue flows through the state budget after collection. Readers will note that there are different paths for revenues depending on how much tax has been collected for a particular year.
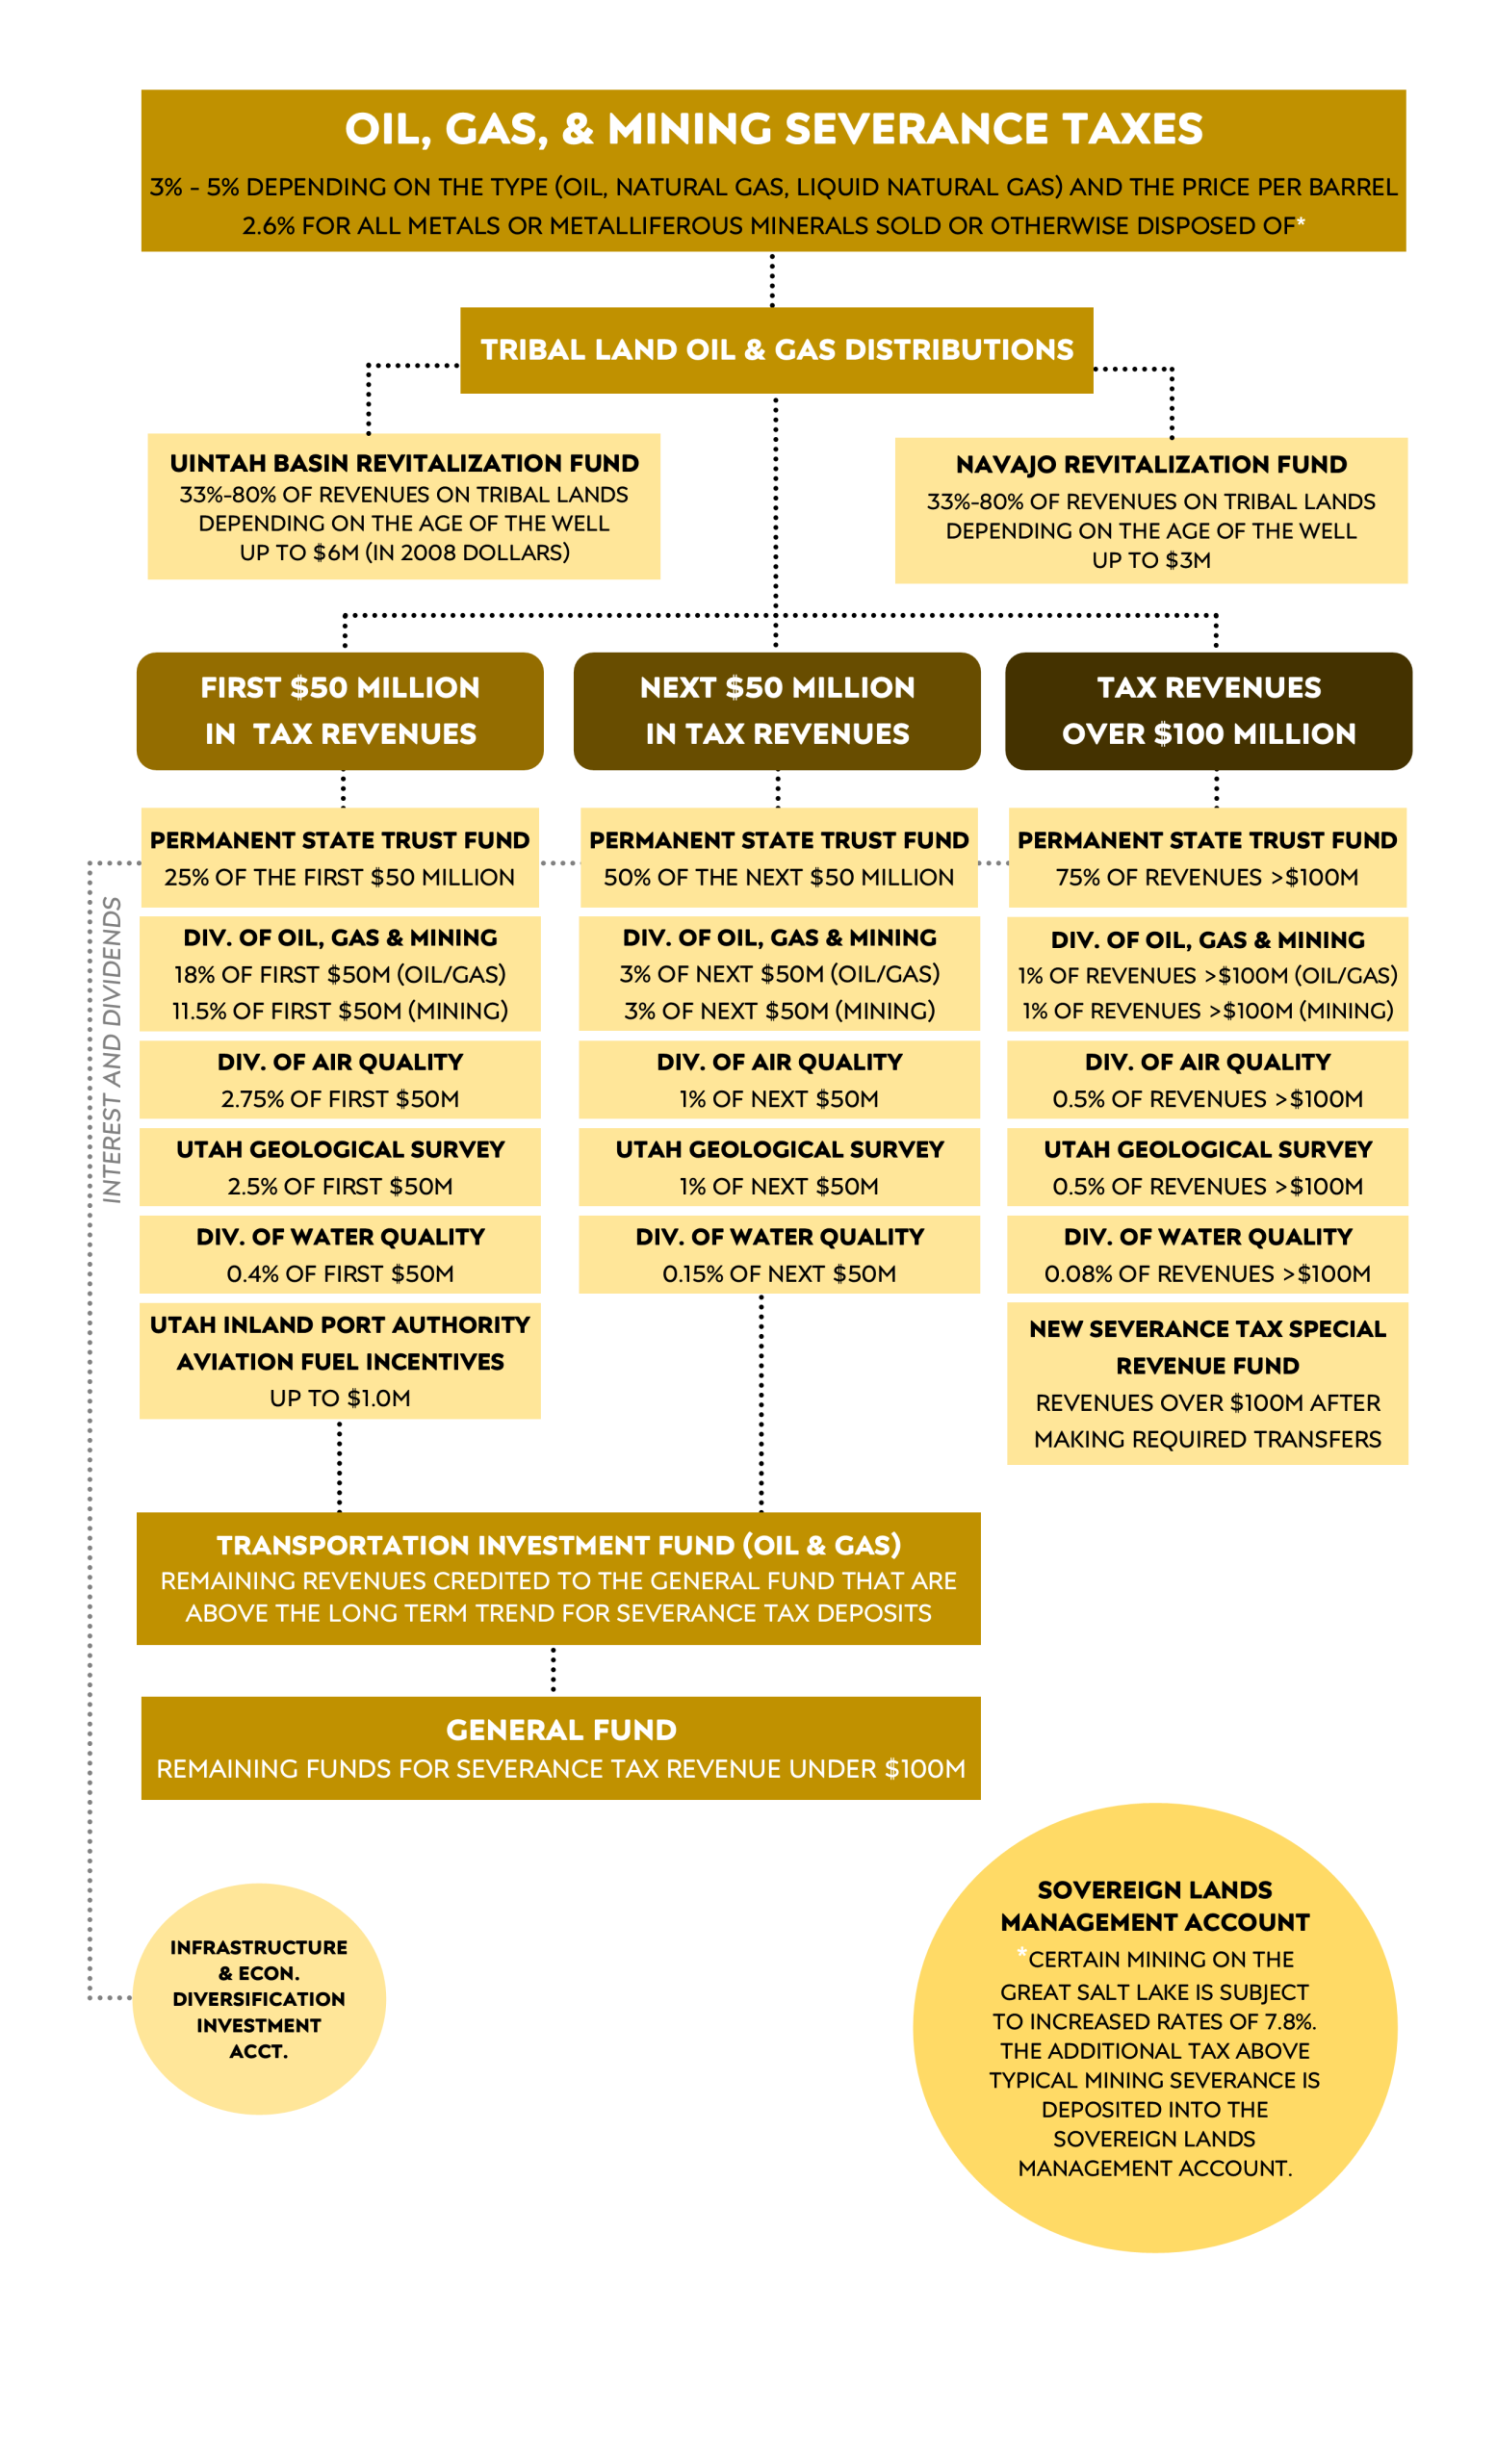
A few items of note:
- Severance tax collected for oil and gas is applied to price per barrel, while natural gas is based on cubic thousand feet (MCF). In both cases, the tax is applied to the sales price net of transportation costs and royalty share.
- The cap for transfers into the Uintah Basin Revitalization Account is annually inflated (or deflated) based on the consumer price index, with a base year of 2008.
For revenues under $100 million, the final earmark before depositing revenues into the General Fund is to the Transportation Investment Fund of 2005 (TIF). This transfer, which captures above trend revenues, is capped at $20.0 million in any particular year and at $88.5 million in total. In 2024, the first year that this earmark was implemented, $1.1 million was transferred to the TIF.
Over the last 20 years, earmarks on severance tax (set asides for a specified, limited use) have dramatically increased. In the early 2000s, it was expected that over 90% of total severance tax collections would be deposited as unrestricted revenue to the General Fund. In FY 2024, only 46% of Severance Tax was retained as available revenue to the General Fund.
Code references for the various allocations in the graphic above are included below (mobile users may view this table better in landscape orientation):
| # | Description | Code Reference(s) |
|---|---|---|
| 1 | Tribal Land Oil and Gas Distributions | UCA 59-5-116 UCA 59-5-119 |
| 2 | Permanent State Trust (State Endowment Fund) | Utah Constitution, Article XIII, Sec. 5 UCA 51-9-305 |
| 3 | Infrastructure & Economic Diversification Investment Account | UCA 51-9-303 |
| 4 | Regulatory Agency Distributions | UCA 51-9-306 |
| 5 | Utah Inland Port Authority Aviation Fuel Incentives Account | UCA 59-5-121 UCA 11-58-208 |
| 6 | New Severance Tax Special Revenue Fund | UCA 51-9-307 |
| 7 | Transportation Investment Fund | UCA 59-5-115 |
| 8 | General Fund | UCA 59-5-115 |
| 9 | Sovereign Lands Management Account | UCA 59-5-202 |
Late Autumn Revenues Fall Short of Projections
On Wednesday, November 20th, legislative and executive branch economists released the revenue update for November, detailing collections for the first four months of Fiscal Year (FY) 2025. The Revenue Summary (TC-23) published by the Tax Commission tallies funds collected by the state, while the impact of those collections is interpreted in the Revenue Snapshot co-produced by the Legislative Fiscal Analyst and Governor’s Office of Planning and Budget.
While revenue collections to the coveted General and Income Tax Funds grew robustly in the first quarter of the fiscal year, October revealed a marked change. State sales tax, which drives the General Fund, grew at 1.3% year-over-year, short of the projected growth rate of 1.5%. In contrast to the projected growth rate of 2.0%, income tax collections declined by 1.6% when compared to this point last year. Several factors are cited for this dip in income tax, including multiple corporations filing for large refunds in the month of October (the six-month deadline for tax year 2023 extensions). Additionally, and perhaps more interestingly, the usually reliable income tax withholding collections were static (withholding being considered a pulse on wages in the labor market). Lastly, the national election may influence the timing of when businesses and individuals choose to claim income, as taxpayers anticipate future tax policy changes.
While there are still several months left in the fiscal year during which collections could rebound, the impending budget season means that trends will be monitored closely. As always, state economists will update their FY 2025 forecast and release a new FY 2026 projection with the Governor’s budget recommendations in early December.
The reports referenced in this post are available at the following links:
November Revenue Snapshot (FY 25)
Tax Commission Revenue Summary (Period 4, FY 2025)
Revenue Publications Archive
LFA Publishes Summary of Governor's Budget Recommendations for the 2025 General Session
On Thursday, December 5th, Governor Spencer Cox released his Fiscal Year 2026 Budget Recommendations, and in doing so formally kicked off the budget season. In the state government rendition of letters sent to Santa, the Governor's Office of Planning and Budget submits the statutorily required list of recommended investments to the Legislative Fiscal Analyst (LFA) no later than 30 days before the General Session begins. And much like kids on Christmas, LFA awaits the announcement of the Governor's Budget to assist in their preparations for the upcoming legislative session.
In fulfilling the requirements of UCA 36-12-13 and 63J-1-201, LFA prepares an annual summary of the budget recommendations document according to appropriations subcommittee and also tallies statewide impacts (such as compensation). The summary highlights the amounts and purpose of major investments and when necessary, points out items not included in the final recommendations. The theme of this year's 200 page document is "Where we’ve been and where we’re going," and groups investments into the categories of People, Place, and Prosperity.
2024 LFA Summary of the Governor's Budget Recommendations (FY 2026)
On Monday, December 9th, the Executive Appropriations Committee will meet to adopt revenue estimates which will be used in formulating budgets for the upcoming General Session.
Drowning in Fiscal Notes? Try FiNs!
During the 2024 interim, the Legislative staff have been hard at work designing and testing a new fiscal note system, intended to improve the user experience for policymakers, staff, and state agencies. The updated system, dubbed "FiNS" (Fiscal Note System), is in the final stages of deployment in preparation for the 2025 General Session.
The Fiscal Impact of Legislation
Under UCA 36-12-13, the Office of the Legislative Fiscal Analyst (LFA) prepares a fiscal estimate (aka “fiscal note”) for all proposed bills. The estimates must include:
- Potential state government revenue impacts;
- Anticipated state government expenditure changes;
- Anticipated expenditure changes for county, municipal, special district or special service district governments; and
- Anticipated direct expenditure by Utah residents and businesses.
LFA is also required to indicate whether each proposed bill will change the regulatory burden for Utah residents or businesses.
JR 4-2-403 stipulates that when LFA receives a piece of approved legislation, they have three business days to provide the bill sponsor with a fiscal note. When LFA is notified of a bill, they review it and allow impacted agencies 24 hours to respond with their estimated impacts. On day two, the assigned fiscal analyst reviews the agency responses, requests clarification as needed, and drafts the fiscal note. On the third day, the fiscal note is reviewed twice internally by LFA leadership before it is sent to the sponsor for their review.
This statute also clarifies that when a bill sponsor receives a note, they have 24 hours to release it (make it public), hold it (keep it confidential), or contact LFA in the case that the sponsor disagrees with the fiscal note. The bill sponsor may provide evidence, data, or other information to support a revised fiscal note. If no action is taken by the sponsor, the bill is automatically released after 24 hours. Additionally, if a fiscal note has no impact, the note is immediately released after the sponsor receives a copy.
Rules Impacted by Fiscal Notes
If a fiscal note has a net impact to the General Fund, Income Tax Fund, Uniform School Fund of more than $20,000, it is considered a “fiscal note bill” (JR4-4-101). These bills are held until the 43rd day of the General Session when they are prioritized and approved to pass based on being included in the final budget.
Fiscal notes impact the progress of bills differently in each chamber. House Rule 3-2-402 requires that all bills must have an approved (not held) fiscal note to be heard in a house standing committee. In the Senate, bills are allowed to pass through committees, but must remain circled on the third reading calendar until a fiscal note is received (S.R. 4-3-101).
Improvements to the Legislator Experience
Previously, there was no easy way for Legislators or their interns to see where a fiscal note was at in the drafting or approval process. When a note was approved by the LFA Director, an email notification was sent to the Legislator who would need to contact the LFA Office Manager to release the note. Documentation of that approval was manually attached to the fiscal note in the system. For a legislator with multiple bills in process at the same time, who already receives dozens if not hundreds of emails from constituents every day, keeping track of these notification emails can prove to be challenging.
Beginning in the 2025 General Session, legislators will have a new, streamlined resource to view, release, or hold fiscal notes, as well as contact LFA with questions regarding fiscal impact. As part of the overhaul of the entire fiscal note system, an app will be available on the secure site for Legislators to check on the status of all their notes at once:
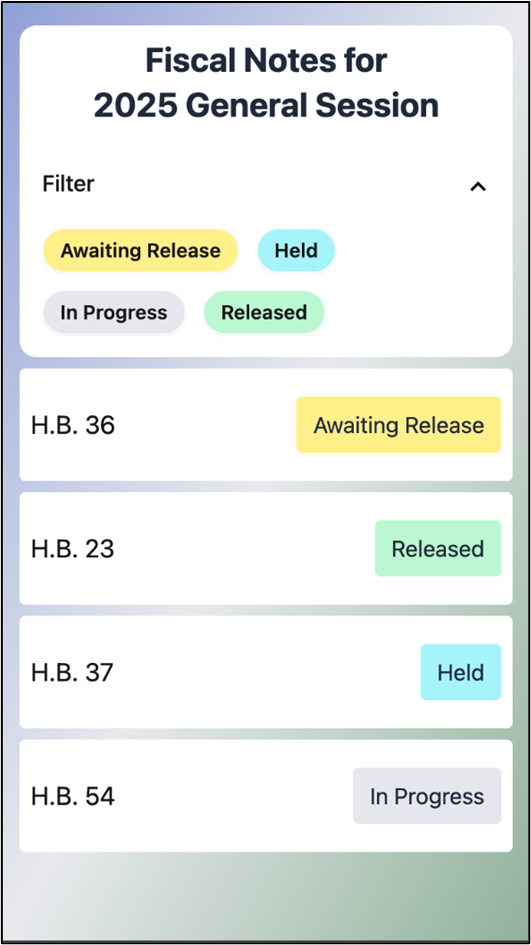
Legislators will still receive an email notification when a note is complete that includes a link to this app. However, at any point in the session, policymakers can now view where their bills are in the fiscal note process. Additionally, the app provides the opportunity for legislators (and interns with proper credentials) to act on a completed note:
This change is designed to assist legislators in their duties and provide an automated, secure record of approval or other actions. Legislators and their interns will recognize FiNS by the logo, featuring none other than a shark fin.
On Solid Ground: How the Public Education Budget Framework Provides Stability
During the 2020 General Session, the Legislature passed H.B. 357, “Public Education Funding Stabilization.” The bill, which was contingent on the passage of Constitutional Amendment G, laid the foundation for the annual adjustments of the Public Education budget framework. The framework includes mechanisms to address three areas of volatility in the public education budget: enrollment growth, inflationary adjustments, and long-term stabilization. Each December, the Executive Appropriations Committee is required to consider recommendations from the Legislative Fiscal Analyst on the public education funding framework and include approved recommendations in the public education base budget (UCA 53F-2-208 and 53F-9-204). The recommended increases to the Public Education framework total $251.5 ongoing and $3.5 one-time.
1. Enrollment Growth
For Fiscal Year (FY) 2026, the recommended ongoing cost adjustment for enrollment growth is $21.4 million, supplemented by a one-time adjustment of $3.5 million for the Educator Salary Adjustment Program. This figure is the net impact of savings from reduced enrollment and increases associated statutory requirements.
In FY 2024, Utah’s public schools enrolled 668,817 students, which was below the consensus projection. For FY 2025, a larger decline in total enrollment is expected. Through 2032, it’s expected that the school age population in Utah will decline by almost 62,000 (or 9%). The number of enrollments changes the number of Weighted Pupil Units (WPUs) in the state's cost formula calculations.
While total enrollments drop, several statutory requirements are causing the enrollment growth adjustment to remain positive. As can be detected in the graph below, there has been an uptick in charter school enrollments since the pandemic. Because charter school enrollments cost the state more than district enrollments, this increase impacts the state’s budget.
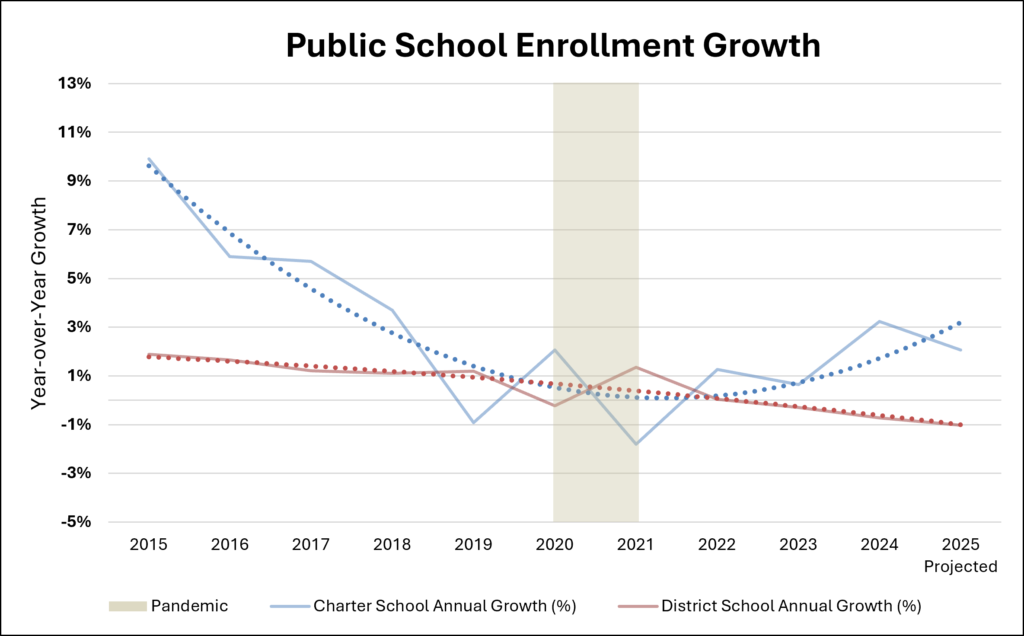
Other statutory costs that are increasing the enrollment growth cost estimate include educator salary adjustments, scholarships, the statewide online education program, and concurrent enrollment (college courses offered in secondary schools).
The Utah Fits All Scholarship currently provides a budget for about 10,000 students. Scholarship recipients are not included in enrollment counts. Scholarship recipients who were already enrolled in private schools or were being homeschooled will not impact enrollment growth figures. The initial report on the scholarship program is due September 1st, 2025 which will detail any impacts to public school enrollment.
2. Inflationary Adjustment
The WPU serves as a standardized measure to calculate program costs and distribute funding to public schools. Twelve legislative programs rely on the WPU in their cost and distribution formulas, which are grouped under the Basic School Program, (a key component of the Minimum School Program). The cost of these programs is determined by multiplying the number of WPUs by the WPU Value. While the number of WPUs is determined by the number and composition of students enrolled, the Legislature sets the WPU Value each year.
The Inflationary adjustment to the WPU is based on a rolling five-year average of the Core Consumer Price Index (which does not include food or energy in its inflation measure). From 2020 to 2024, the inflation averaged 4.0% resulting in a recommended $178.7 million ongoing adjustment in the public education base budget. The recommended increase would increase the FY 2026 WPU Value to $4,674.
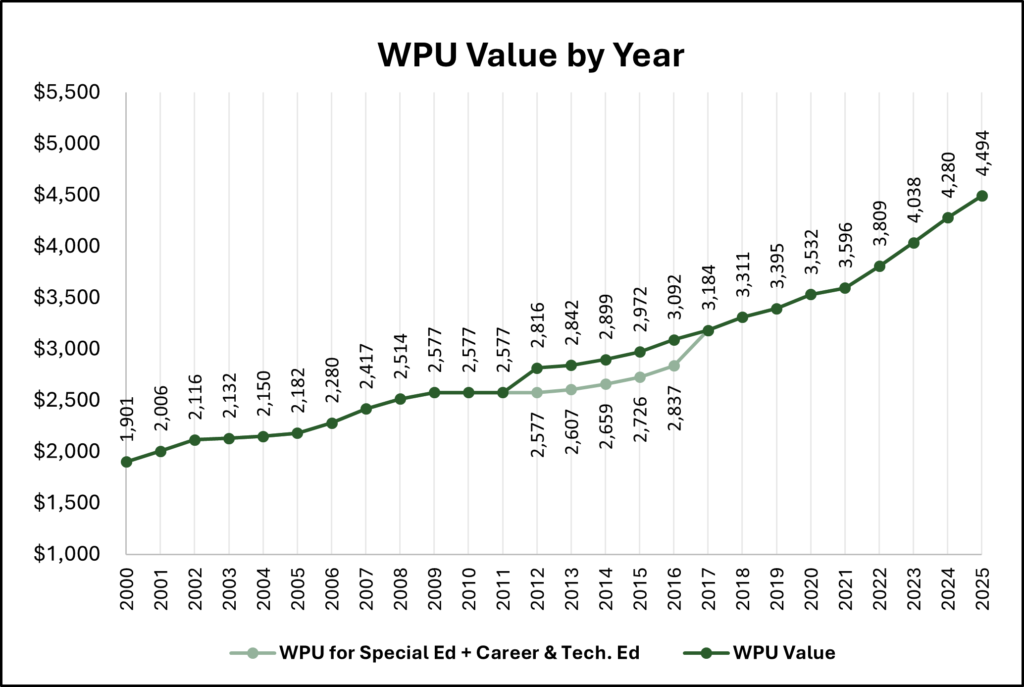
3. Long-term Stabilization
The Public Education Economic Stabilization Restricted Account (account) captures ongoing appropriations from revenue growth as projected in the consensus revenue estimate. UCA 59F-9-204 directs 15% of income tax revenue growth to be deposited into the account, until it reaches a balance equal to 11% of appropriations from the Uniform School Fund. With the recommended deposit into the account of $51.4 million, the Public Education Economic Stabilization Restricted Account balance would total roughly $492 million. This is well under the FY 2026 estimated cap of $532.0 million based on Uniform School Fund appropriations. The account serves as a source for one-time appropriations to the Public Education system, and also provides a contingency plan for the Minimum School Program in the case that the Income Tax Fund and Uniform School Fund were insufficient sources to fund enrollment growth, inflation adjustments, or other ongoing costs related to Public Education.
While the annual adjustments provided in the Public Education Funding Framework comprise only a small piece of the state's budget for public schools, these annual analyses are designed to provide adaptability and resilience in for Utah's public education budget. As we discussed in a previous blog post, funding public education is partnership between the state and local entities. The Minimum School Program, which is impacted by this framework, is designed to provide all children of the state "reasonably equal educational opportunities regardless of their place of residence in the state and of the economic situation of their respective school districts." You can learn more about the Minimum School Program budget on COBI.
Resolution for Results: LFA Operations and Performance Team Annual Recap
2024 marked the third year for the Legislative Fiscal Analyst’s Operations and Performance Team (Ops. Team). In addition to completing three efficiency evaluations for the Departments of Corrections, Health and Human Services, and Agriculture and Food, the team also worked to further improve budgetary performance measurement and idea sharing through cross-pollination with other states.
Improving Agency Operations
Each year, the Ops. Team partners with the Results Management team from the Governor’s Office of Planning and Budget (GOPB) and various state agencies to conduct efficiency evaluations on key processes and make recommendations for improvement.
This year, the Department of Corrections asked for assistance optimizing inmate transfers throughout the state. Depending on where inmates have been transferred, it can be difficult to complete treatment programs required by the Board of Pardons and Parole before their original release dates. As a result, some inmates —at no fault of their own—were not able to take full advantage of mandatory earned time reductions, both delaying their release and impacting total prison capacity.
The Ops. Team analyzed throughput times, identified constraints like medical needs and security levels, and made recommendations to improve inmate placement decisions. Some examples of our recommendations include the following:
- Formalize the inmate placement decision-making process and establish a clear hierarchy of decision criteria
- Prioritize placements based on key constraints, such as inmates’ medical needs and security level (e.g., place inmates with lower medical needs in county jails rather than resource-intensive treatment facilities)
- Build buffer time into the system by basing inmates’ treatment program enrollment dates on their earliest likely day of release
The final report can be found here. Helping agencies identify and work with constraints in a system is a key tenet of the process improvement tools we apply.
Additionally, this week the team released their second efficiency evaluation report of the year, which looked at the intake process for reports of child abuse and neglect made to Child Protective Services within the Division of Child and Family Services. The recommendations for that system focused on standardizing intake protocols and providing alternative tools and resources that would allow workers to more efficiently process referrals.
Early next year, our final efficiency evaluation report for 2024 will be released, which focuses on optimizing the work of food and dairy safety inspectors at the Department of Agriculture and Food. Recommendations from that report zero in on methods to save travel time and improve the timeliness of inspections, having a large impact on the lives of Utah citizens who enjoy locally produced foods.
Measuring Budgetary Performance
This year, the Ops. Team worked on an internal project to realize process efficiencies related to the presentation, adoption, and reporting of line item performance measures, as well as laying groundwork for future performance dashboard enhancements. The Legislative Fiscal Analyst performs the role of identifying key insights from past and current funding that assist legislators with budgeting priorities. The goal of this project was to free up analysts’ time to make budgetary recommendations. Instead of spending valuable resources on ‘busy work’ to ensure the right measures made it into appropriations bills. Improvements will also help the budget team in the interim by improving the software used to track the outcomes from past state investments.
Historically, a mostly manual process shepherded subcommittee-approved measures into intent language, and upon passage by the Legislature, measures were then reported in the Budget of the State of Utah (BOTSU). Partnering with our office’s lead technologist and an IT analyst from the Division of Technology Services, a process to track the status of line item measures throughout their lifecycle was developed.
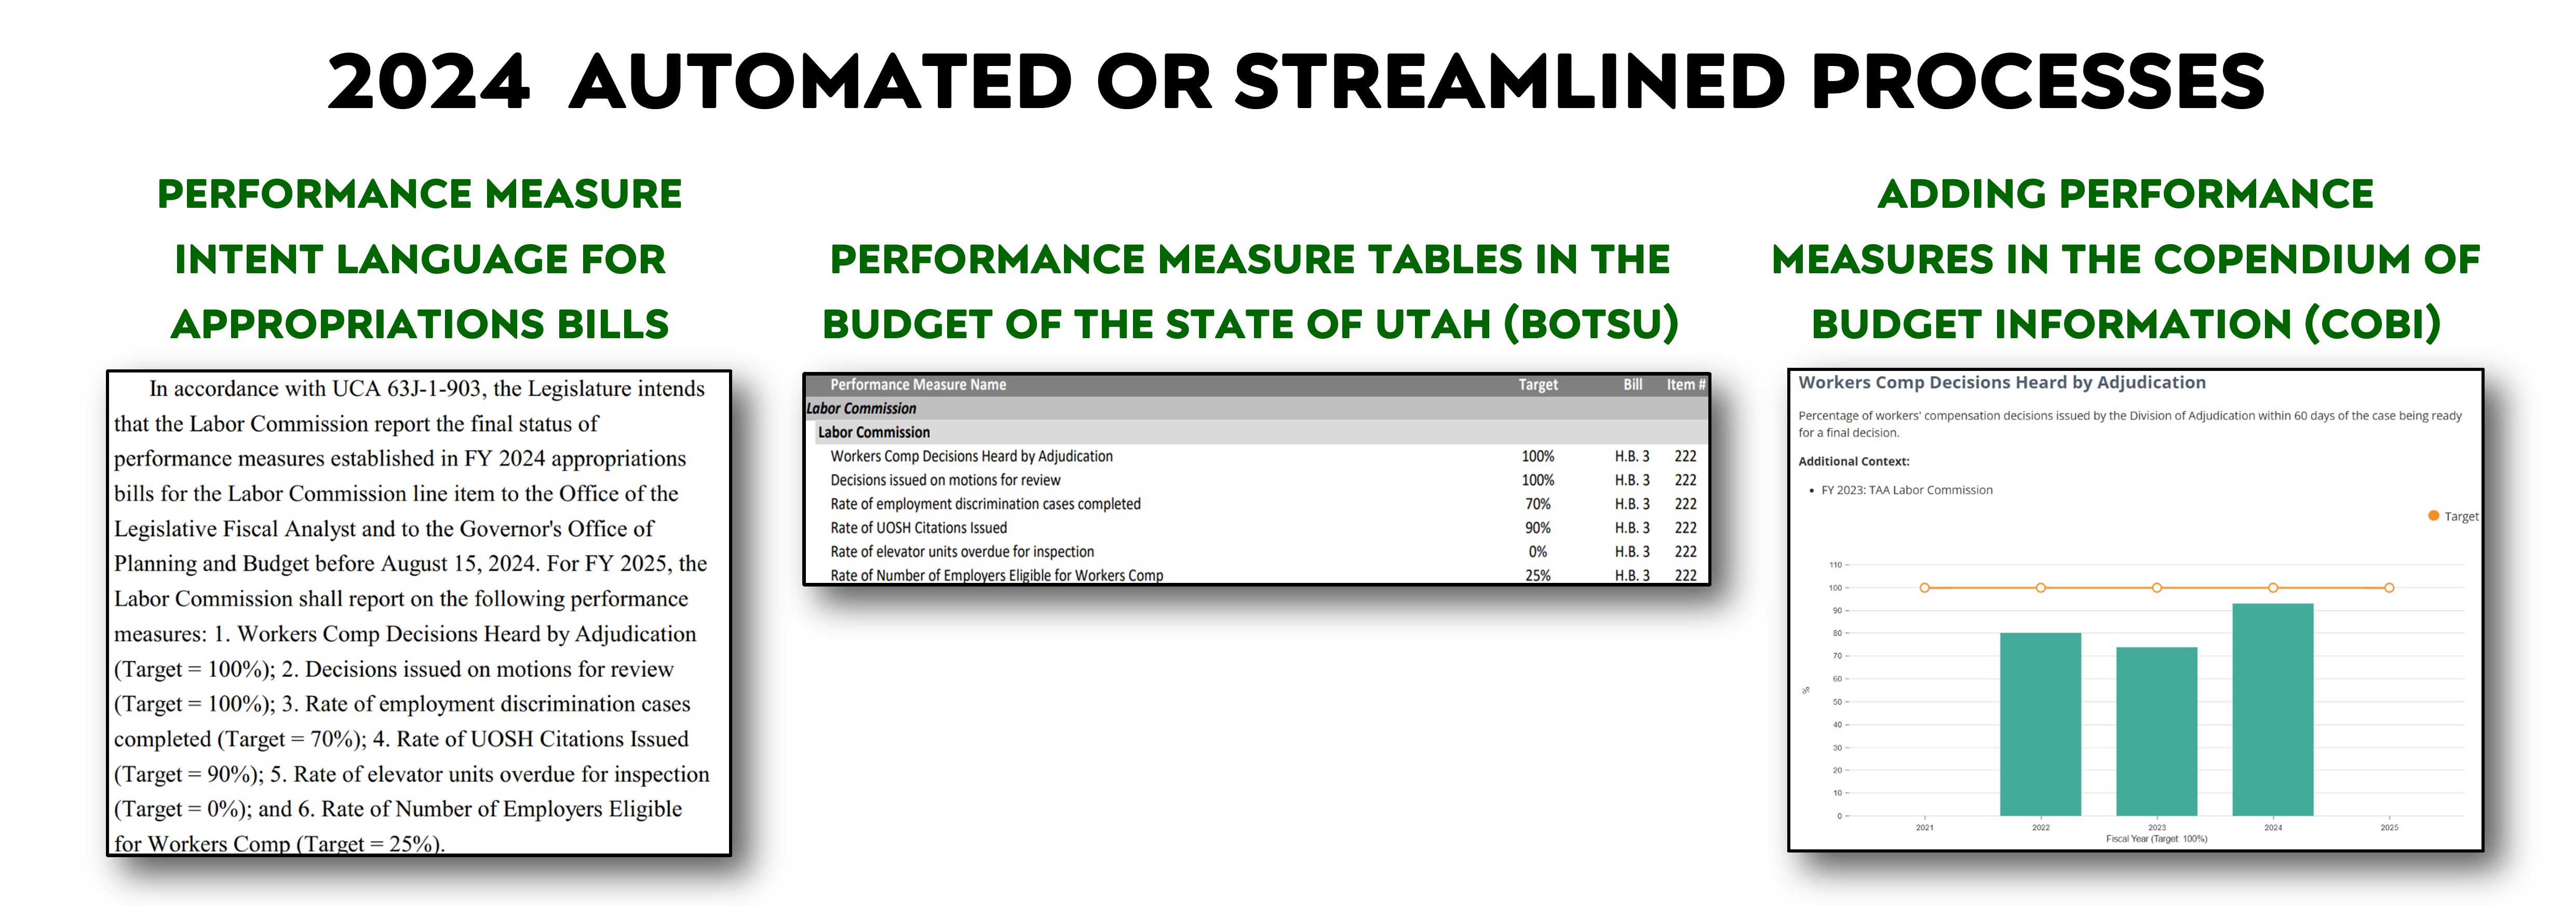
Flagging measures which were authorized by appropriations subcommittees for inclusion in appropriations bills and automating the generation of intent language were high priority changes to free up additional analyst time for insightful budget analysis.
Looking to the future, the Ops. Team is focusing on improving processes that facilitate reporting on measures for new funding items and line item performance trends. These improvements focused on funding items which need repeat reporting (due to requiring additional time for implementation). The team is also developing models that supply performance measure data into dashboards, another way that the Ops. Team is streamlining the processes for the legislative staff in order to free up capacity for future priorities.
Best Practices Across the Nation
In addition to internal improvements, the team engages in continual learning and often meets with other states and national organizations to share best practices. A few of the opportunities the team participated in this year include:
- Montana State Legislature’s Legislative Finance Committee: Montana is implementing a new performance system and reached out to a number of states for best practices to inform their new process. The Ops. Team joined the National Conference of State Legislatures (NCSL) and Tennessee’s Office of Evidence and Impact in presenting the Utah approach to visualizing performance and measuring both new and base funding.
- Governing for Results Network (NCSL): The Governing for Results Network has been a key driver in collaboration with other states. This year the team presented their new dashboard visualization and explained cross-branch collaboration processes. The conference and presentation resulted in several meetings with new state partners.
- National Directors Meeting: Directors from across the country have a quarterly virtual meeting, and while most represent the Executive branch, the Ops. Team has been able to bring the Legislative perspective to discussions on how states can improve performance and learned valuable insights from other state governments.
- The Colorado Lab: The mission of the lab is to guide action using data, and they work with the State of Colorado to bridge the gap in policy, budget and results. This new partnership promises to be one of the drivers that will improve Utah’s cross-branch collaboration and evidence based decision making in 2025.
- Utah Taxpayers Association: The Ops. Team was asked to present how they used visualization to make performance metrics more accessible to legislators and more transparent to taxpayers. An accomplishment that will be further expanded in the new year.
You can access the Ops. Team’s 2024 annual update to the Legislative Management Council as well as this year’s efficiency evaluations at budget.utah.gov.
Fiscal Notes 101
Loyal readers of budget.utah.gov may recall this post from last month, summarizing the latest technology upgrades for the Fiscal Note system (FiNS). As a reminder, FiNS is the vehicle for drafting the very popular financial impact analyses that are attached to every piece of proposed legislation. In preparation for for the upcoming General Session, the Legislative Fiscal Analyst (LFA) would like to review the components of each note.
Fiscal Notes can be found under the "Related Documents" on the right panel of a bill's page on the Legislature's website:
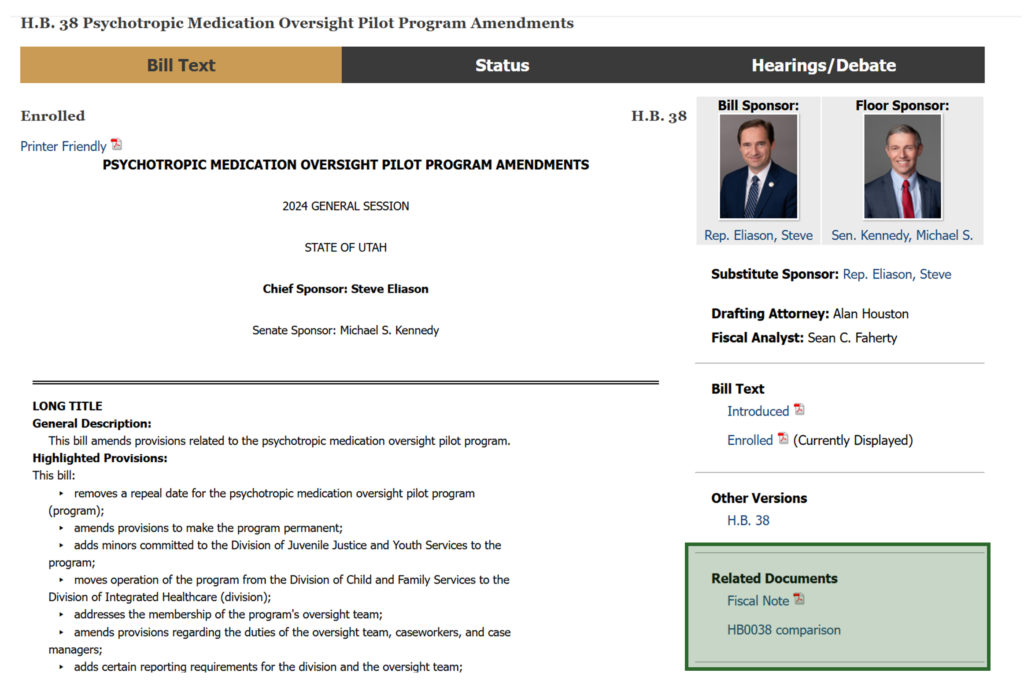
A Fiscal Note contains 10 basic elements which are highlighted in the graphic and summarized in the list below:
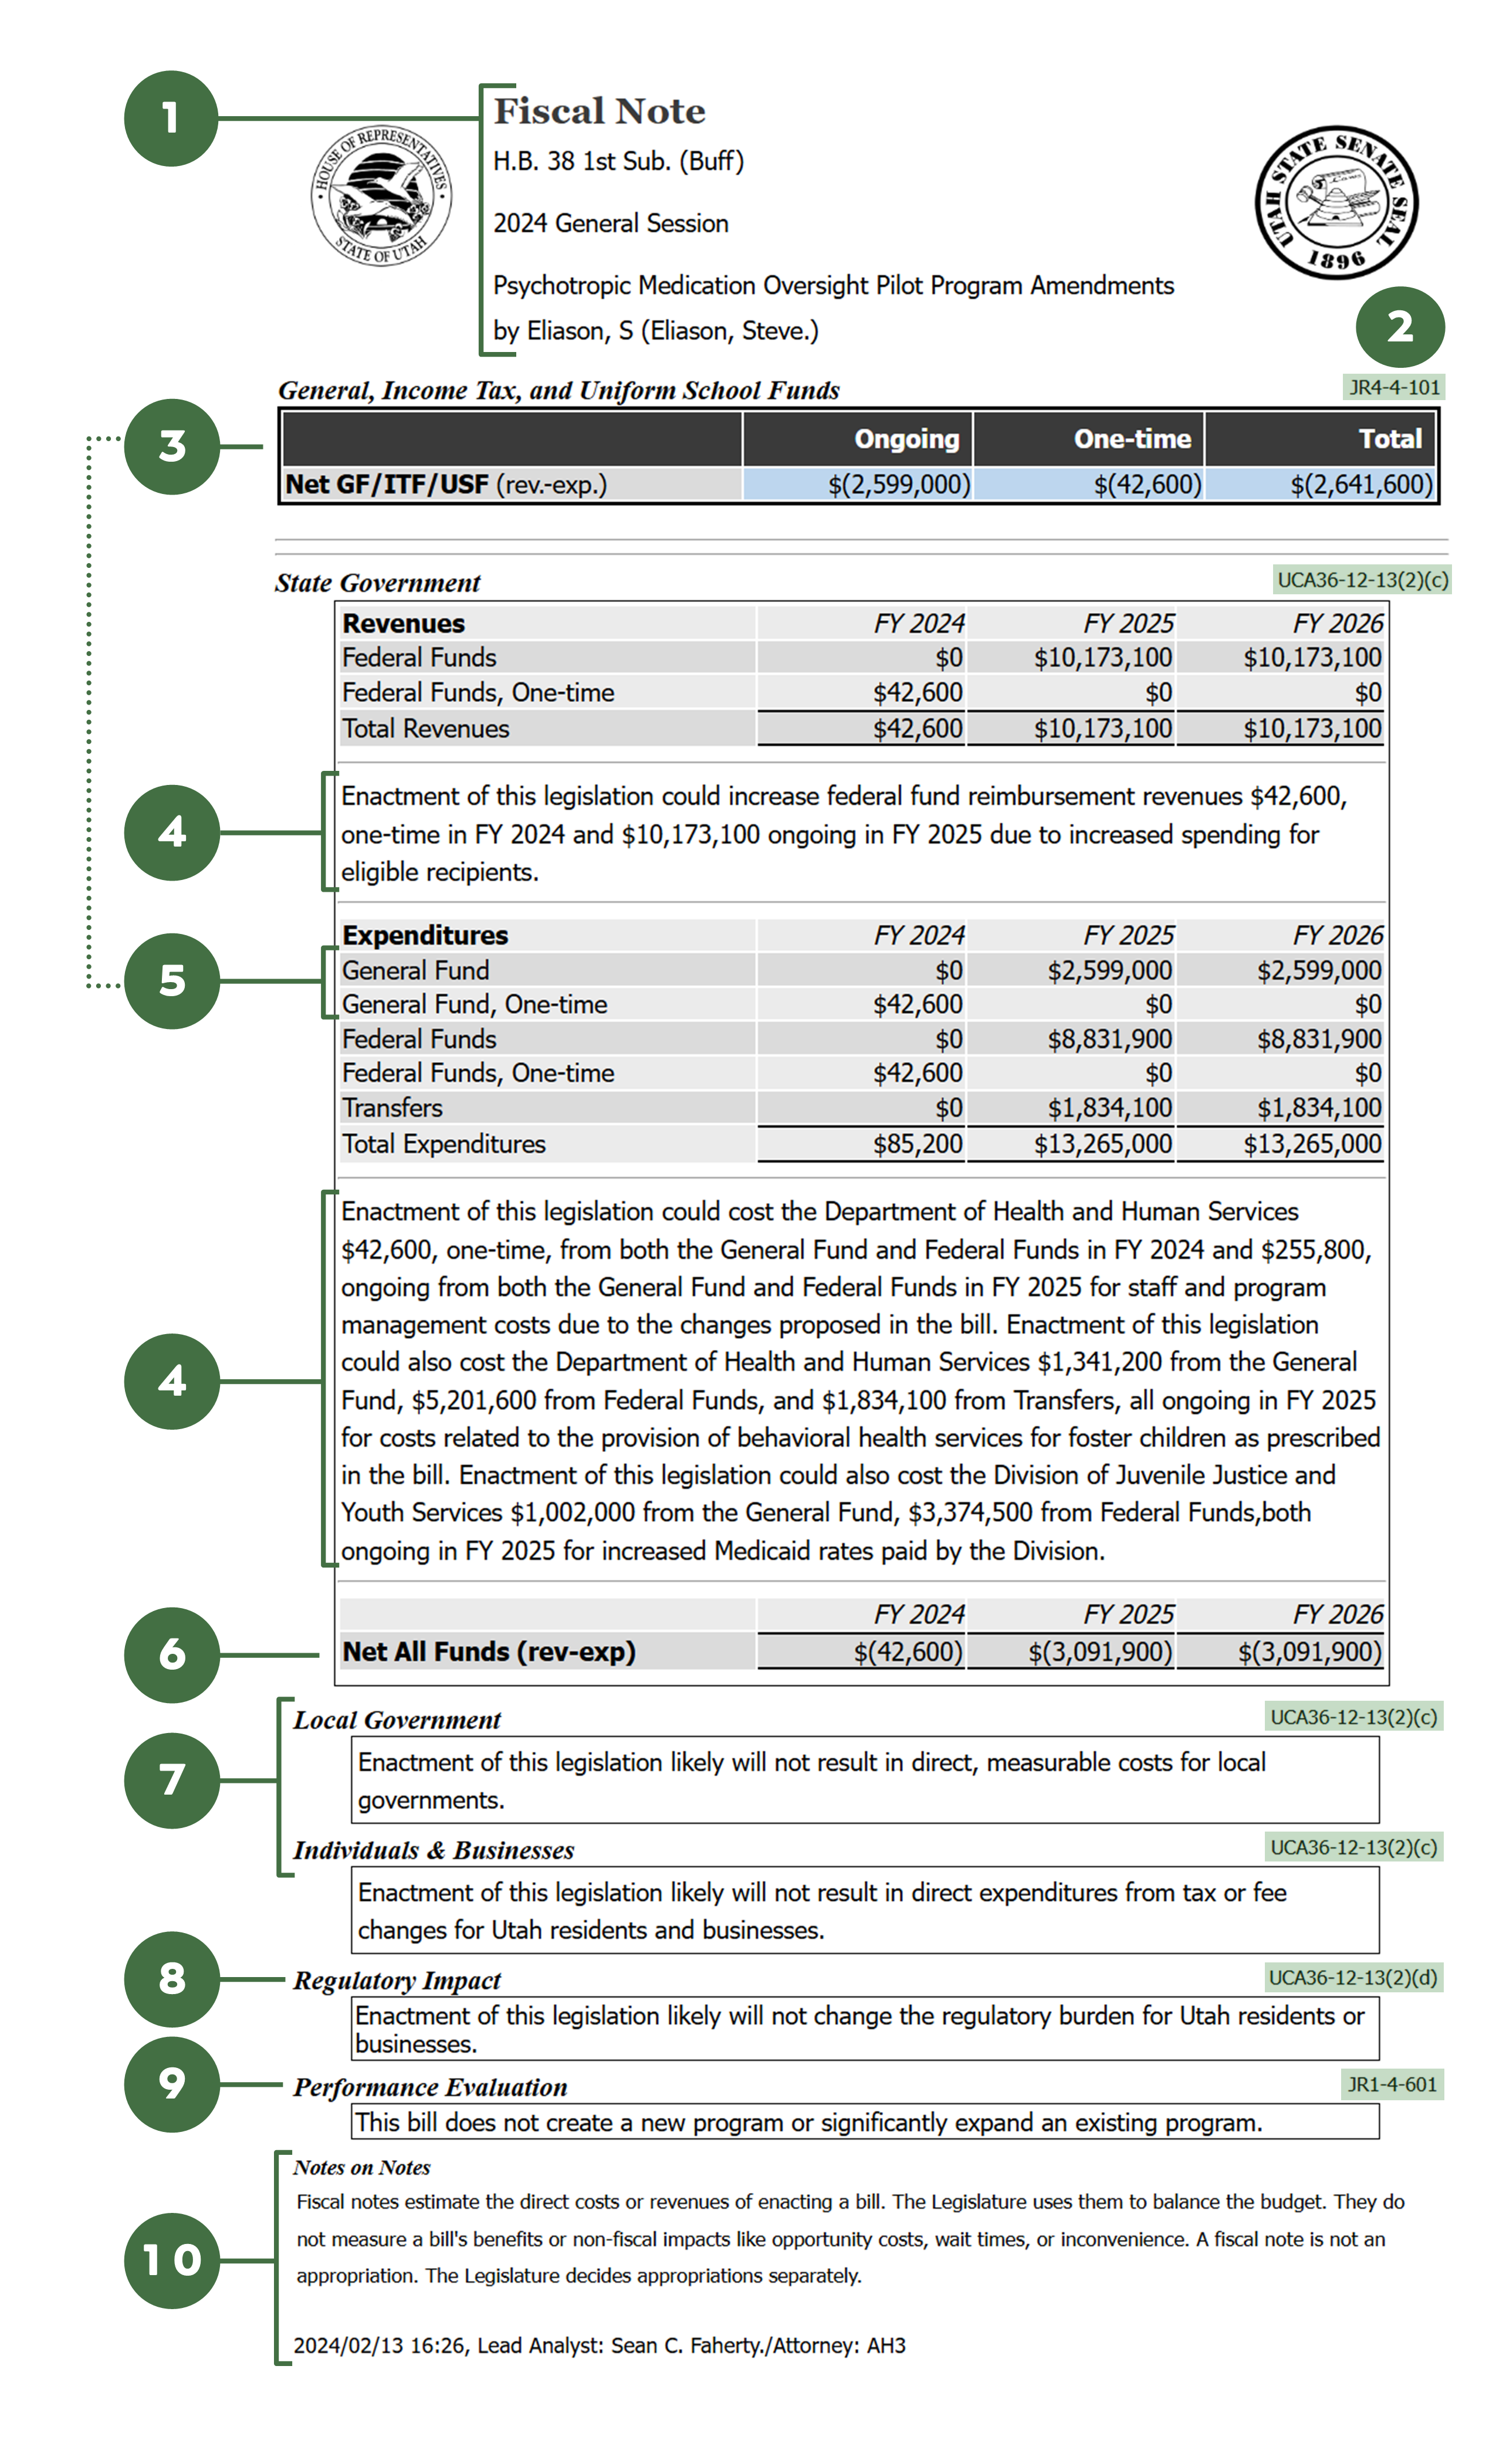
- Bill number, legislative session, short title, and sponsor
- Statute and rule references that require each of the elements in a note.
- The net impact to state funds (aka General, Income Tax, and Uniform School Funds). This section is what determines a "fiscal note bill." While all proposed legislation will receive a Fiscal Note, bills with impacts to over $20,000 receive special treatment under JR4-4-101:
- The house shall refer any Senate Bill with a fiscal note of $20,000 or more to the House Rules Committee before giving that bill a third reading.
- The Senate shall table on third reading each House bill with a fiscal note of $20,000 or more.
- Before adjourning on the 43rd day of the annual general session, each legislator shall prioritize fiscal note bills and identify other projects or programs for new or one-time funding per the process established by leadership.
- Before adjourning on the 44th day of the annual general session, the Legislature shall either pass or defeat each bill with a fiscal note of $20,000 or more except constitutional amendment resolutions.
- Explanations of expected revenues and expenditures as a result of the policy change, including the agency and accounts that would be impacted and what the state can expect to receive for the investment.
- State Fund impacts within the table. This element will not be present in all fiscal notes, but it may help readers to see where this piece is used to inform element #3 but how it differs from element #6.
- Tabulation of the total impact to the state budget from all revenue sources.
- Impacts to Local Governments and Individuals and Businesses. These sections do not reflect changes in potential revenues or avoided costs. They are a summary of direct expenditures that will result if the policy is implemented.
- The Regulatory Impact is summarized into 'High', 'Medium' or 'Low', and may include things like new or eliminated requirements for licensing, inspections, fees, or providing information.
- For Legislation that creates a new program or significantly expands an existing program, a performance measure will be assigned to the agency implementing the program to help improve accountability of the state's investment. Additionally, the Office of Legislative Auditor General consults with those executing the new or expanded programs on governance best practices.
- The fine print. This section explains the limitations of Fiscal Notes, including that they are not used to measure things like opportunity cost. The function of a note is to preserve fiscal stability by providing consistent informed analysis about the direct expenditures and revenues that could result if a bill were to pass. Readers can also see the financial analyst's name, drafting attorney's initials and the date the note was made public.
It's important to remember that a fiscal note is not an appropriation; the Executive Appropriations Committee can choose how much money to attach to a particular piece of legislation based on available revenue and other factors. Additionally, every effort is made to apply consistent methodology to notes across substitutes and across years, however, as new information is made available fiscal impact estimates may change.
Now You See Me: The Illusion of Revenue Timing
A quick glance at the December Revenue Snapshot shows a relatively bleak picture of year-to-date (YTD) state revenue collections, particularly for Income Tax Fund (ITF) collections which indicated a -4.3% year over year (YoY) growth rate as of the date of the report. With what may appear to be a sleight of hand, a second look at the January Revenue Snapshot paints a far rosier image of state collections, now showing total ITF revenue growth up by 3.1% YoY.
Is this magic? Economist wizardry? Peering behind the proverbial curtain, we can see in clear view the mechanics driving this apparent flip flop. What we see in collections over the past two months’ reports has been the result of several timing variations from FY 2024 compared to FY 2025. The nuances of these temporal illusions are easy to miss in the singular, point-in-time totals presented each month in our reports; but this trick is easily revealed in the daily collections data as shown in the chart below:
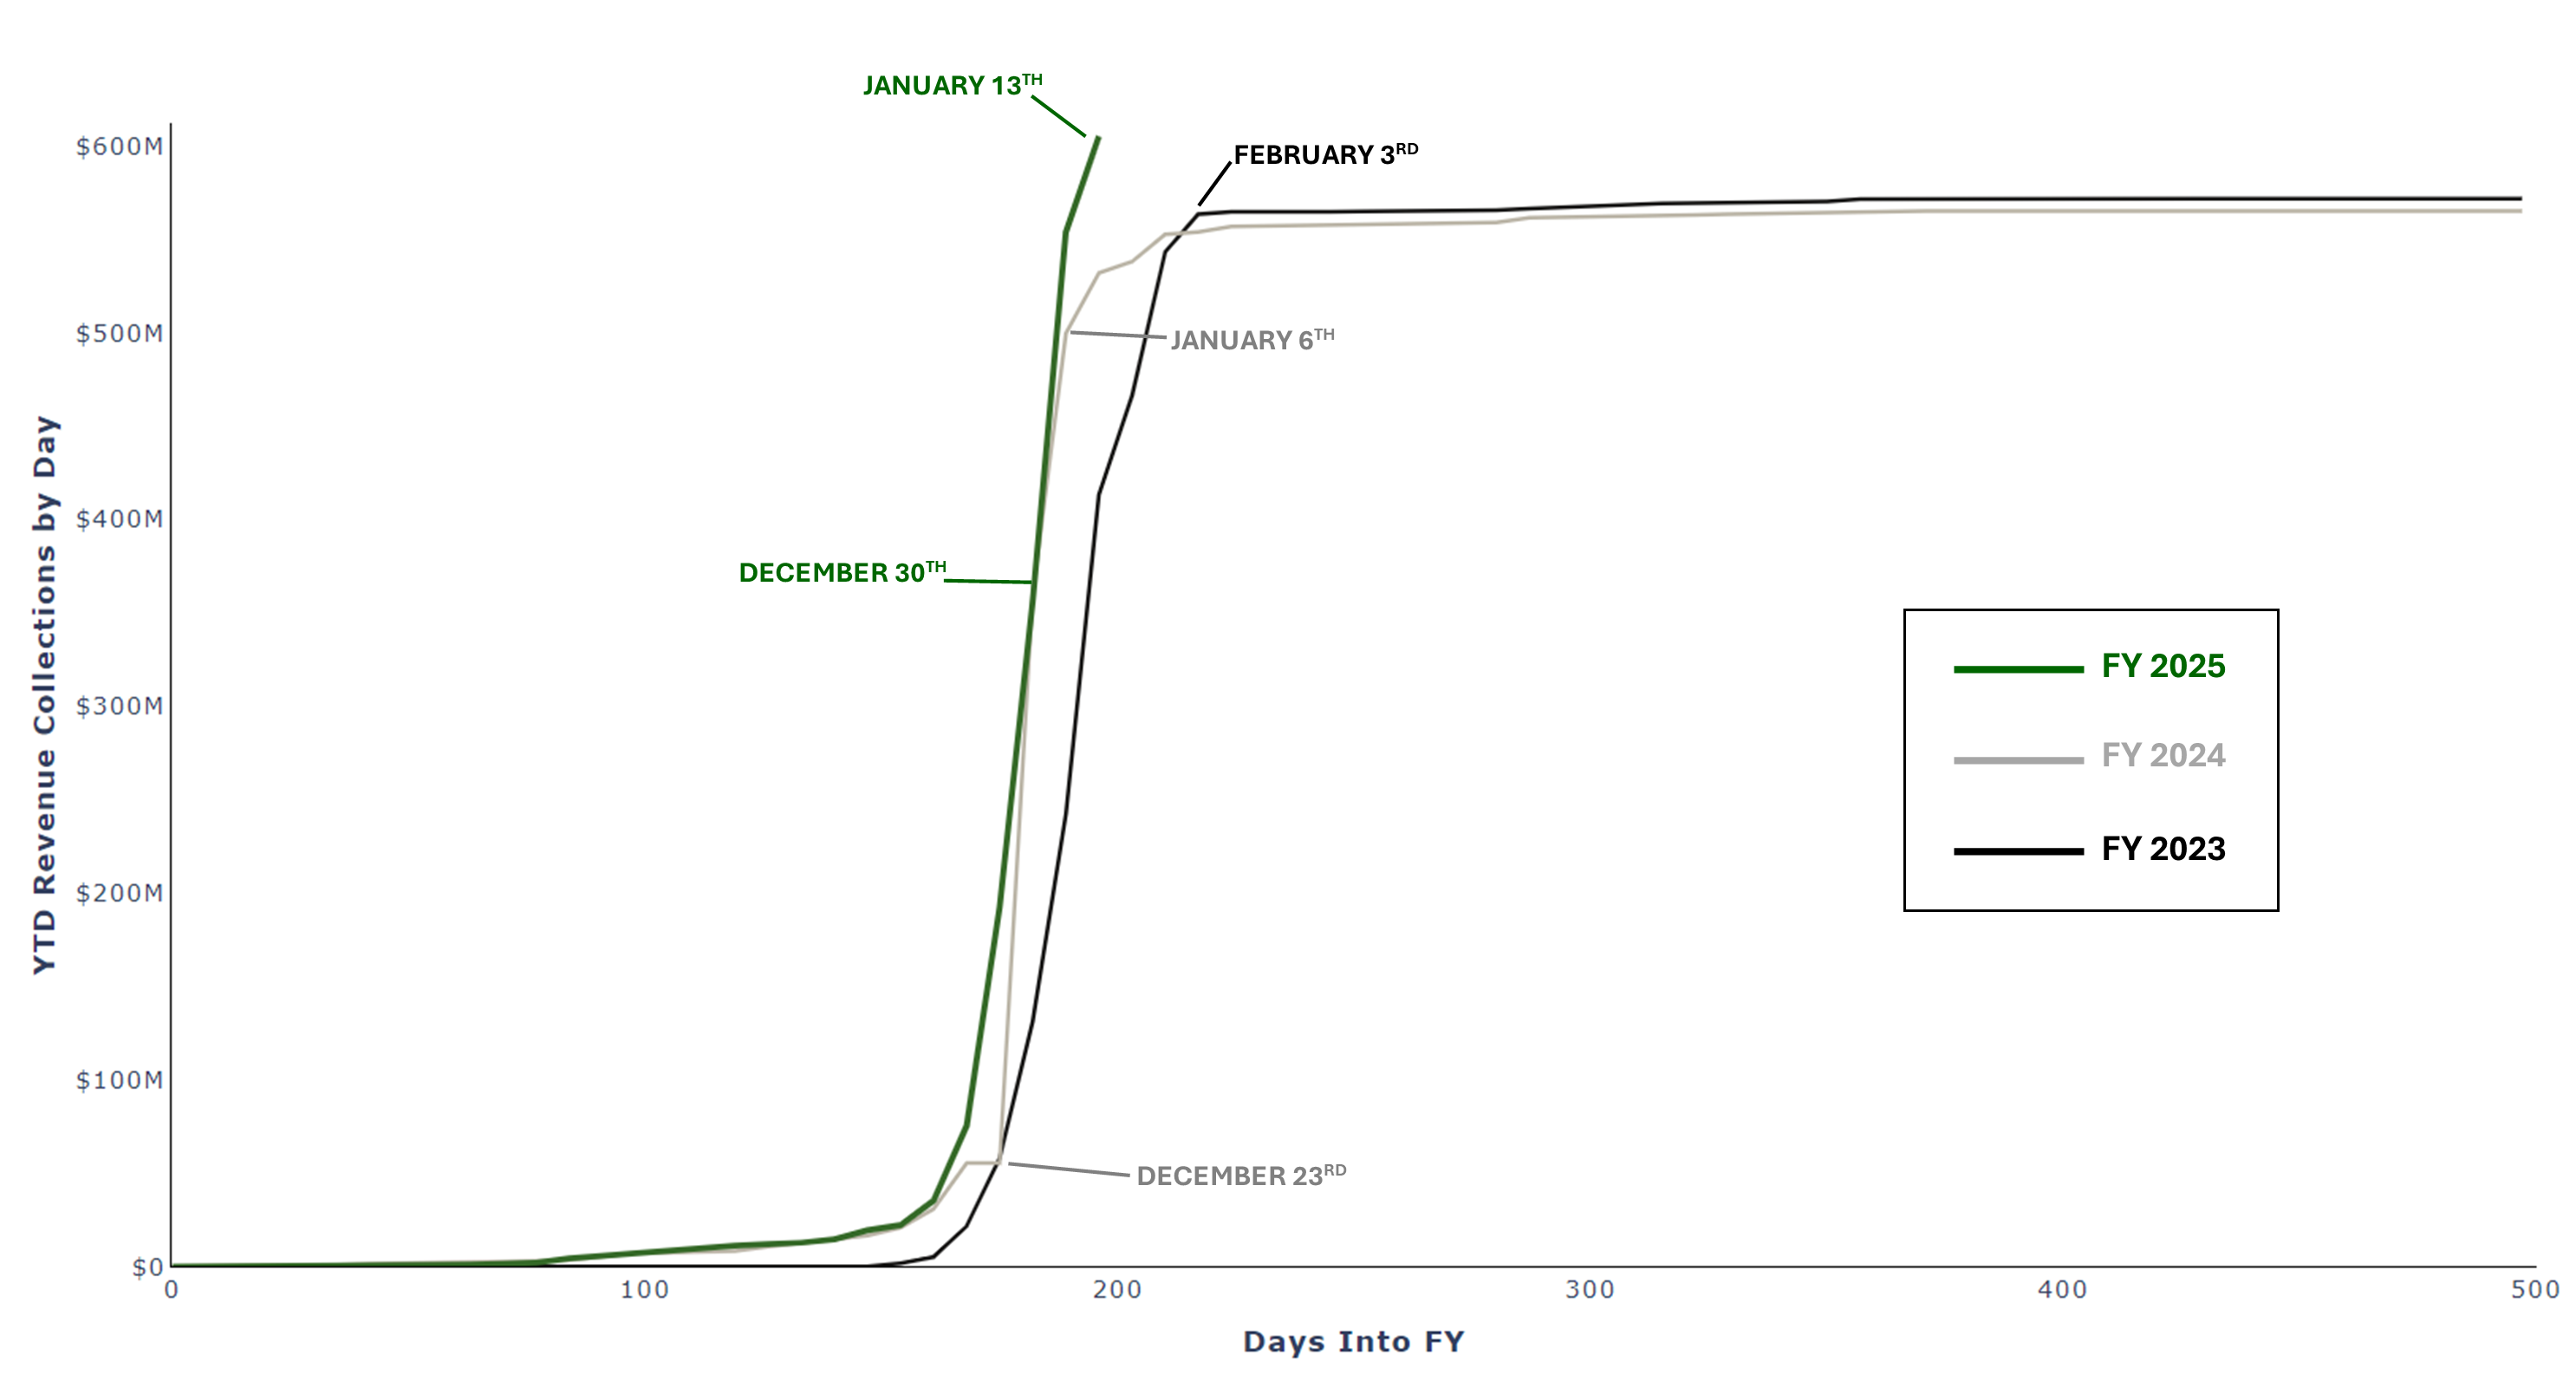
The chart above shows YTD collections for individual income tax of the State and Local Taxes (SALT) from Pass-through entities. Due to the nature of these payments, the state receives the bulk within a short window of time, beginning shortly before the end of the calendar year then spiking sharply over the course of a few weeks before leveling off for the remainder of the fiscal year (FY). This example illustrates perfectly the timing issues which can make the monthly, point-in-time totals presented in each report appear to be relatively more volatile from one to the other. If we look at FY 2024, shown in grey, it can be seen that collections began to increase slightly earlier that year than they had in FY 2023 – as a result, the initial snapshot of these collections indicated strong growth in this source, which can be seen as the large gap between the grey and black lines at the point marked January 6th. If that report was presented just days later, the growth rate would have come in significantly lower, and ultimately in the following month’s report it became clear that collections in this source were in fact lower, slightly, YoY. Similarly, in the current year, initial indications reflected essentially flat growth YoY, however, the latest inflows now indicate strong growth from this source.
For other sources of revenue that are more periodic than SALT payments, (meaning they flow into the state more frequently throughout the year) the effects of these year-to-year timing differences are generally more subtle, but nonetheless are still a significant factor in the monthly reports. This can be seen reflected in the chart below, which shows YTD collections of withholding payments, (another component of total individual income tax collections). As was noted in the December Revenue Snapshot report, due to the cutoff of data presented in the monthly document, a significant amount of these payments were not yet processed into the state accounting system on the date of publication. At this point, the green line, reflecting the current fiscal year, was briefly below the grey line which was precisely what contributed to the bleak nature of the ITF collections reported for December. If that report had been presented just days later, again the growth rates would have shown significant “improvement” or rather would have properly reflected the actual rate of growth for that month’s collections.
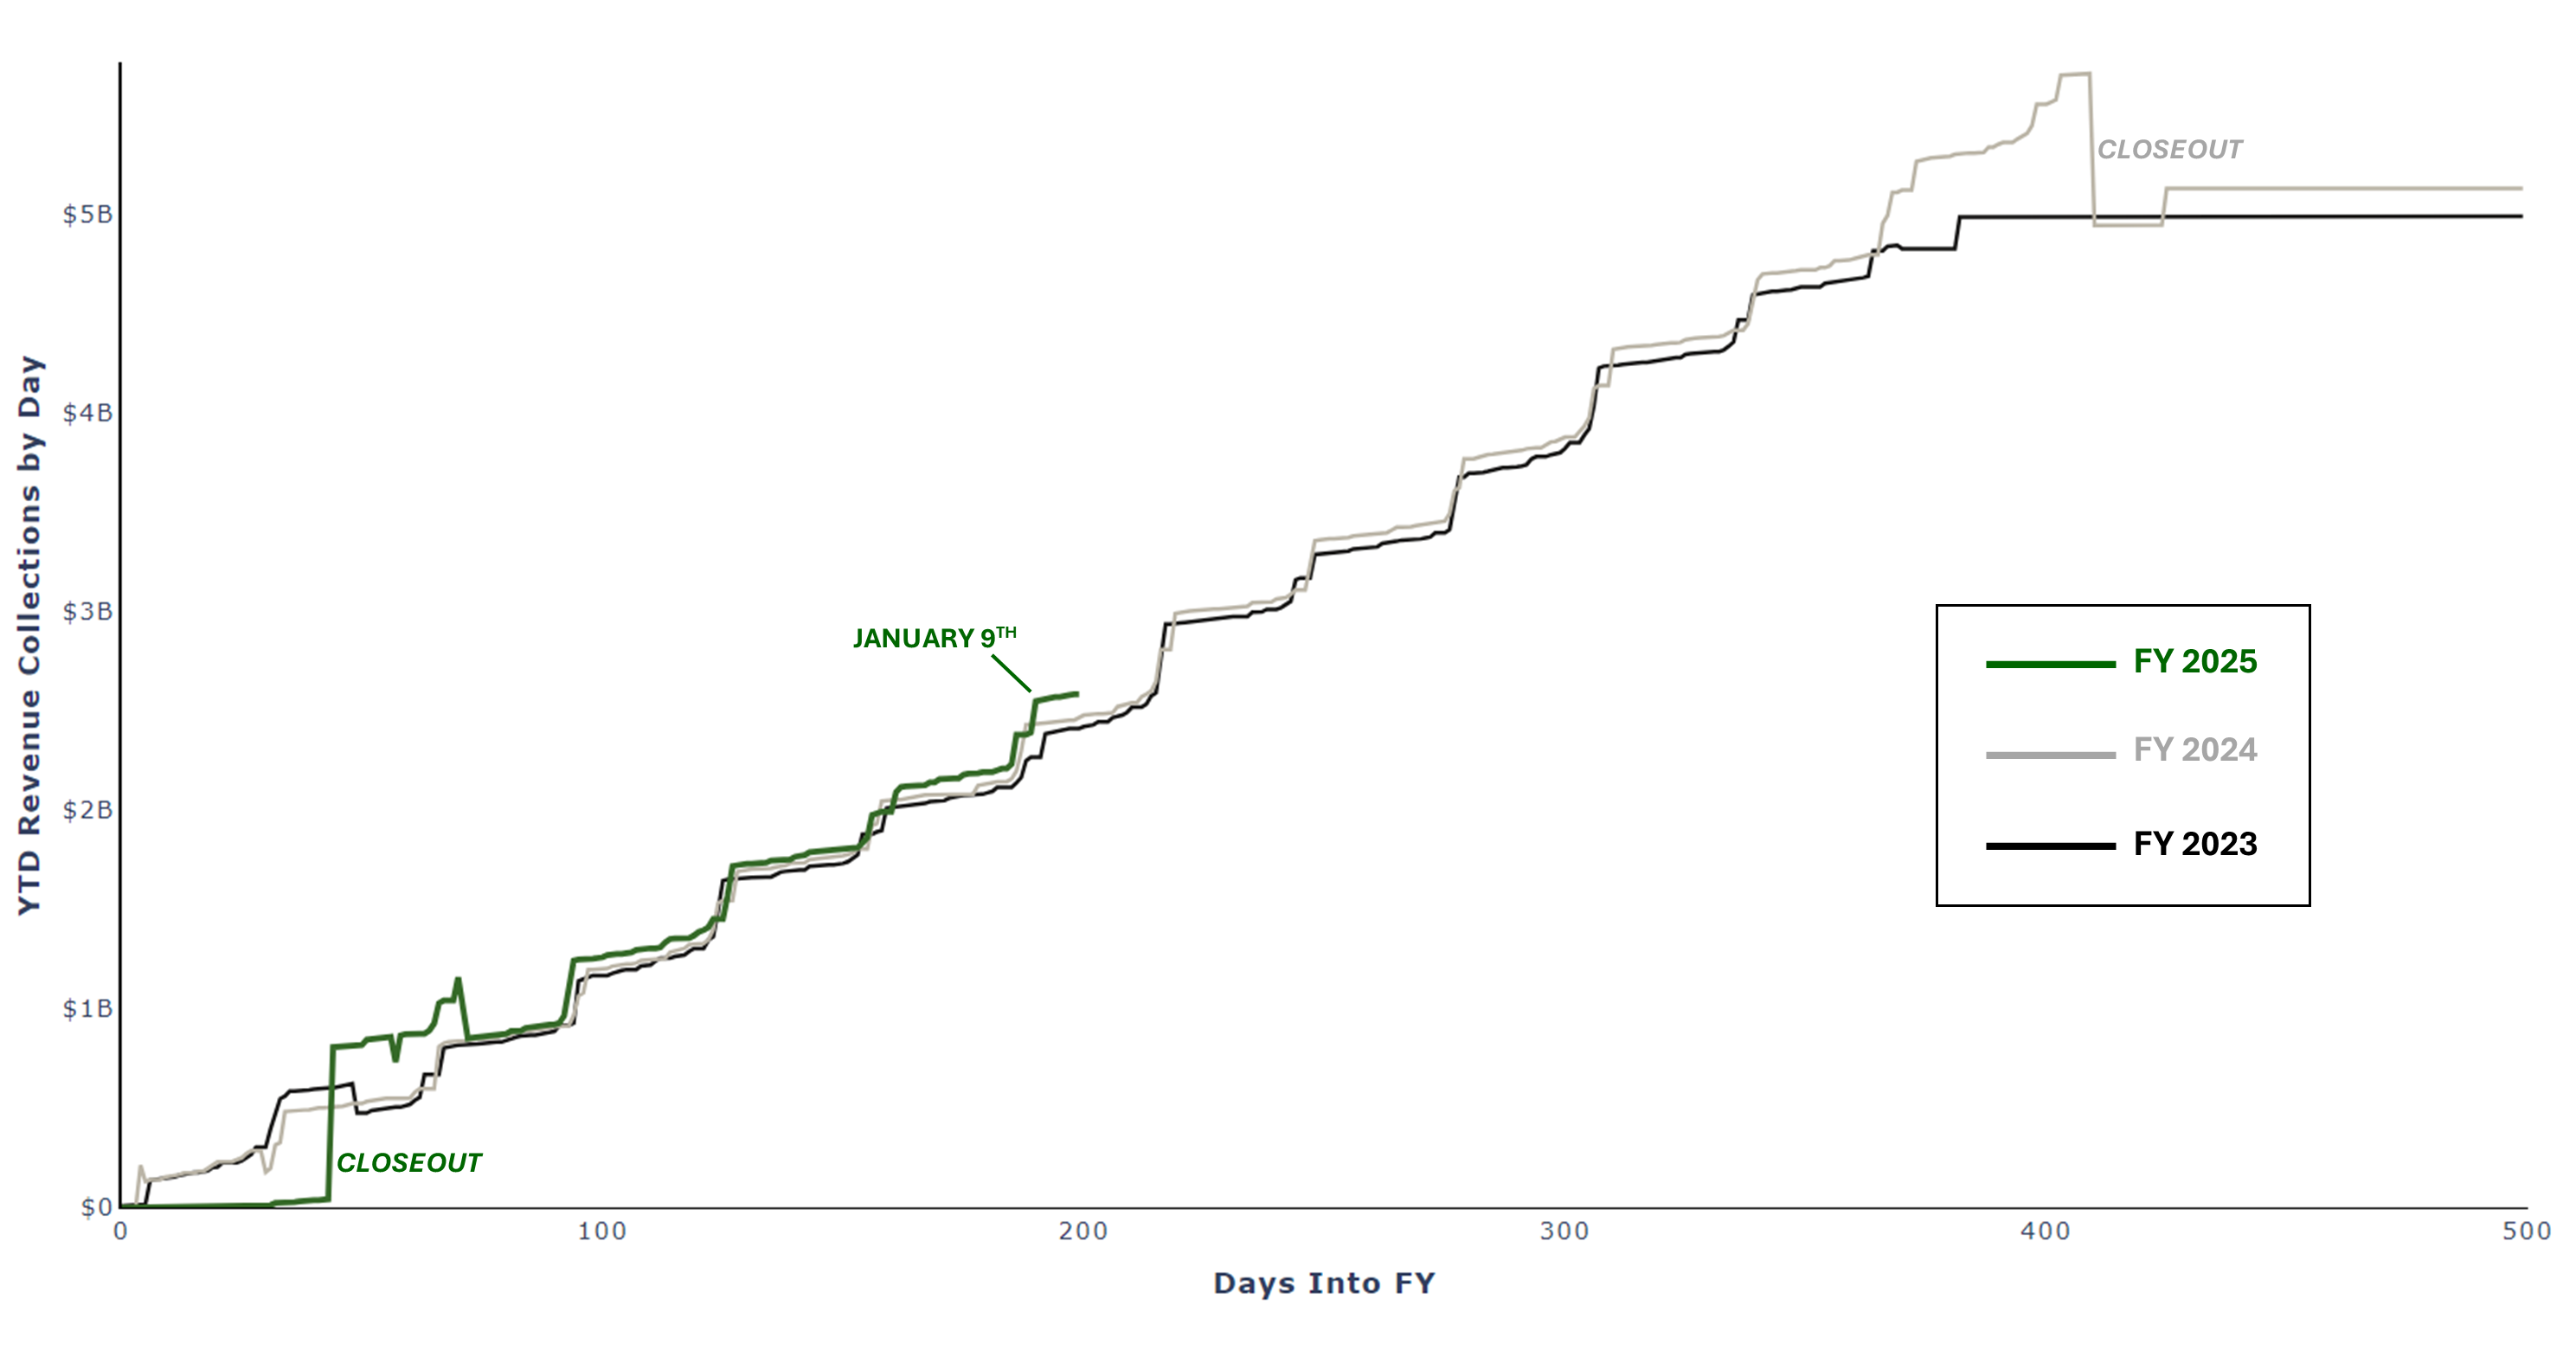
These timing issues are no doubt at play in the current month’s revenue summary report. The relatively strong growth rate indicated for YTD withholding is in some sense the reverse of the apparition seen last month. Collections reported in January, are collected in November for wages paid in November. Why is this important? There were five Fridays in November 2024, but only four in November 2023. Because many employees receive their paychecks on Fridays, this difference in the number of weekends in a given month can have significant influence over the apparent growth rate for income tax. Looking ahead to next month’s report, we note that December of 2024 had only four Fridays, while December of 2023 had five. As such, it is likely that we will again see a reversal in the growth rate for income tax collections due to these timing variations. Now you see it, now you don’t.
The reports referenced in this post are available at the following links:
December Revenue Snapshot (FY 25)
Tax Commission Revenue Summary (Period 5, FY 2025)
January Revenue Snapshot (FY 25)
Tax Commission Revenue Summary (Period 6, FY 2025)
Revenue Publications Archive
The Budgeting Balance: Revenues, Requests, and Reality
In December, Legislative economists provided updated revenue estimates to the Executive Appropriations Committee, along with a summary of how current spending and statutorily required and recommended revenue set asides paints a narrow margin for new spending during the General Session. As discussed last week, recent trends in collections are likely attributable to timing, and February's report (when economists again update revenue estimates before the end of session) should provide a clearer picture of the revenue seesaw.
Perched on the other end of this budgeting teeter-totter are Requests for Appropriations (RFA), the method for legislators to secure additional funding for programs not associated with proposed legislation. RFAs were introduced to limit the drafting, presenting, and voting on bills which only included appropriations and did not amend policy. This dual path was designed to allow legislators and staff to streamline budget and policy objectives in the short, six week annual legislative session. Under Joint Rule 3-2-701, RFAs are due on the 11th day of the General Session at 12pm (this year, that's Friday, January 31st, 2025).
To assist policymakers in walking this fiscal tight rope, the Legislative staff annually make recommendations to each appropriations subcommittee on potential actions that could be taken to reallocate existing budgets for new purposes. During the fourth week of the session, RFAs, (along with all budget requests) will be prioritized by each subcommittee and then presented the following week to the Executive Appropriations Committee. EAC’s work during the following two and a half weeks will determine which items are including in the final act.
As of publication, 100 Requests for Appropriation have been submitted, for a total ask of $334.4 million one-time and $70.1 million ongoing.
The Quest for Accountability: Why One Measure Can't Rule them All
Passed on the 10th day of session, the base budget bills for state agencies provide important direction for state agencies in the upcoming budget year. Included for Fiscal Year (FY) 2026 is intent language establishing line item performance measures for most line items of every agency. This post will serve as a refresher on what performance measures are, how they’re used, and things the Legislative Fiscal Analyst and Governor's Office are actively working on to improve their’ usefulness and relevance. To keep things interesting, we’ll use parts of J.R.R. Tolkien’s classic series, The Lord of the Rings, to illustrate how performance measures might work in the real (or fantasy) world.
Line Item Performance Measures Tell an Agency’s Story over Time
Performance measures help tell the story of the progress agencies are making in their efforts to transform appropriated funds into real-world impacts for Utahns. Measures can take a variety of formats, including a count (such as the number of people served), a percentage (such as the proportion of tasks completed on time) or a dollar amount (such as cost savings achieved). On Frodo's quest to save Middle Earth, some of his performance measures might have included the number of miles traveled toward Mordor, the percentage of orcs defeated in battle, or the time needed to send a call for help to their allies in Rohan. And, whenever possible, performance measures should be designed to reflect the actual outcomes of a funded activity, rather than just the output—were the people of Middle Earth successful in defeating evil? Or in the real world, are Utahns better off than before because of any given state-funded activity?
This year’s nine base budget bills contained 738 unique measures that agencies will report on, which are associated with 209 line items in the state’s budget structure. While most of these line items have between one and four measures, some of the largest line items representing vast operations have significantly more—Public Education’s Basic School Program (22 measures), Utah Department of Transportation’s Support Services (14 measures), and Department of Workforce Services’ Operations and Policy (10 measures) to name a few.
Some examples in this year’s base budget bills include:
- Measure of Recidivism (Board of Pardons and Parole)
- Per Capita Rate of Statewide Air Emissions (Department of Environmental Quality)
- Transit Ridership (Department of Transportation)
- Persons Returning to Homelessness (Department of Workforce Services)
Each of these measures help legislators make ongoing decisions about how to prioritize, increase, decrease, or reallocate funding throughout the state budget based on each line item’s performance.
Connecting the Dots—Making Measures Meaningful
The story of The Lord of the Rings centers around a single artifact—one ring to rule them all! Unfortunately, in our budgetary quest to improve state government operations that serve Utah’s residents, there is no single performance measure to rule them all (but we’ll keep an eye out in case we find one). Therefore, a suite of complimentary measures is often necessary to connect the dots, understand whether programs are operating effectively, and see beyond the expenditures to assess larger-scale progress toward agency or statewide initiatives.
A previous post on this topic, “Metrics that Matter,” discussed the importance of linking performance measures to agencies’ strategic plans to show policymakers whether they are effectively using appropriated funds to fulfill their agency-wide missions. Building on this concept, the LFA Ops. Team plans to introduce new features that will connect measures to broader statewide initiatives and policy areas, such as housing, energy, public health, or transportation. Beginning in 2025, agencies will be required not only to directly connect each measure to part of their strategic mission statement, but also to connect each measure to relevant statewide policy impact areas.
For example, let's sat a constituent is interested in understanding all of the funding across the state that is related to environmental issues As illustrated in the graphic below, 'Agency A' and 'Agency B' may both have measures that relate to their agency-level goals, and also to the broader “land and environment” area. With the new impact area tags, a user will be able to filter for “land and environment” and see a comprehensive list of related funding and performance measures from Agency A, Agency B, and any other parts of the state that are working on this issue. Legislators may recognize these categories as the "subjects" required as part of the Request for Appropriations process.
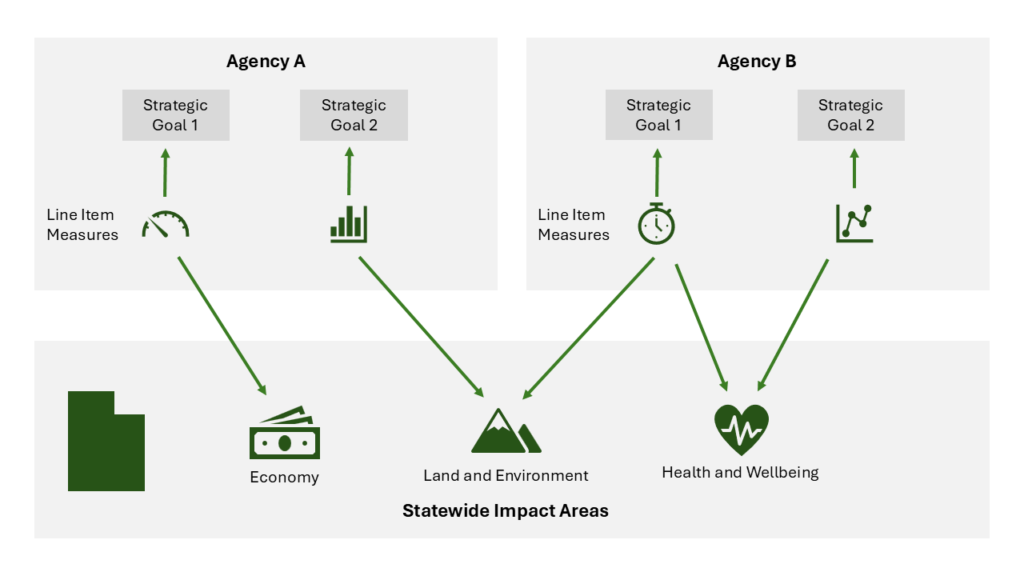
Just as Frodo, Gandalf, and Aragorn in The Lord of the Rings each had to complete their own individual quests to defeat Sauron and save Middle Earth, each program, line item, and state agency has its own role to play in achieving the state government’s broader missions. The goal of connecting topical performance measures with spending data is to equips policymakers with the type of information required to make budgeting decisions that move the state toward key objectives.
Why'd You Have to Go and Make Things So Comp-licated? Demystifying the Compensation Bill
Every year, the Legislature passes a bill that adjusts the ongoing base funding for state employees’ compensation, sometimes referred to as the “compensation bill” or just the “comp bill.” This bill has a lot of moving parts, making its nickname very appropriate—it's not just “comp-ensation,” it’s also “comp-licated!” Many factors (such as cost-of-living changes, adjustments to health and dental benefits, and savings from employee turnover) come together to determine the final appropriations amounts authorized in this bill.
What Does the Compensation Bill Do?
To help you better understand the compensation bill and everything it does, this article will highlight the major types of adjustments that are typically found in the bill and give some background on how those amounts are determined. Read on to learn about each component:
- Salary Increases (Cost of Living). Each year, the Legislature may decide to appropriate additional funds to cover cost-of-living salary increases for state employees. Before the General Session begins, the Legislative Fiscal Analyst calculates the value of a baseline 1% salary increase for state employees and puts that value in the first version of the compensation bill. Before the compensation bill is finalized and passed at the end of the session, the Legislature may decide to budget for a different percentage increase, and the value of the baseline 1% increase is multiplied accordingly and updated in the final bill version.
- Health and Dental Care Cost Increases. State agency employees receive health and dental care benefits through the Public Employee Health Plan (PEHP), and higher education employees are covered by a variety of plans, including PEHP, U Health, or other private providers depending on the institution. Each year, the compensation bill appropriates any additional funding needed to cover increases in these health and dental care costs. PEHP provides estimates of the rate increases needed, and those rates are approved by the Executive Appropriations Committee in December, before the session begins. Although higher education employees are covered through the U Health system, appropriations for their costs are made at the same rate as for PEHP plans.
- Pay-for-Performance Reallocations. Each year, funds are set aside for state employee pay-for-performance increases, which are awarded by agency administrators to their high-performing employees. After those employees are identified for targeted pay increases, the money that was previously set aside needs to be distributed appropriately throughout the state budget depending on where the funding for those individuals’ salaries comes from. This item directs those reallocations to the correct budget units.
- Retirement Rate Adjustments. This item covers changes in state employers’ contributions to employees’ retirement benefits. There are many different rates that are paid based on employees’ retirement plans (Tier I vs. Tier II) and even their job type (for example, public safety employees have their own rates). The effects of the various changes in these rates are combined to determine the increase or decrease in funding needed. These rates are calculated by actuaries at Utah Retirement Systems (URS) and approved by the URS board.
- 401(k) Match Increase. The state currently offers a 401(k) contribution match for state employees of up to $26 per pay period. This item is used to account for any additional cost increases needed to cover those 401(k) matches for the coming year.
- USDB Educator Steps and Lanes. The salary schedule for educators at the Utah Schools for the Deaf and Blind (USDB), known as “steps and lanes,” is set independently from that of other public K-12 educators. Each year, the state board of education is statutorily required to determine a weighted average percent increase to apply to this salary schedule and keep USDB educator salaries competitive with other educator salaries in the state (see 53A-8-302).
- Termination Pool Rate Adjustments. When state employees retire or otherwise end their employment with the state, the value of their accrued PTO hours is paid out to them based on their current wage. However, employees who have worked for the state for a longer period may have earned some of that PTO when they were earning a lower wage. Thus, the state needs to maintain a pool of money to cover those differences in the value of accrued PTO from the time it's earned to when it's paid out. The existence of this pool also helps to smooth out agency personnel costs from year to year. The termination pool helps prevent shortfalls personnel budgets when these large PTO payouts occur, eliminating the need for agencies to predict and budget for these events.
- Turnover Savings. State employers may experience savings when employees leave state employment partway through the year, when open positions that were budgeted for go unfilled for some or all of the year, or when higher-paid roles are backfilled by lower-paid employees. These savings are called “turnover savings,” and result from agencies not spending their full appropriations for the various compensation expenses described in this list, such as salaries, healthcare costs, and retirement contributions. Each year, the LFA calculates a turnover savings rate for each agency based on recent appropriations compared actual spending for personnel services. This differential rate is then used to discount any adjustments in the compensation bill.
Bringing it All Together: Passing the Bill
Each year, the compensation bill sponsored by the EAC vice-chairs, alternating between being a Senate bill and a House bill—in the 2025 General Session, it will be numbered as H.B. 8, “State Agency and Higher Education Compensation Appropriations.” The compensation bill is typically voted on during the last week of the General Session each year, after EAC makes any final adjustments to pay increase percentages (such as the cost-of-living adjustment mentioned above) and makes any other desired changes to the bill. The result is a package of updated compensation appropriations that enables state employers and their employees to continue providing key public services to Utahns for yet another year—a complicated but worthwhile effort!
The Great Budget Bake-Off
Ingredients:
- 8 - Appropriations Subcommittee Reports (linked below):
- 1 - Executive Appropriations Committee (EAC), seasoned with leadership from both chambers and parties
- 1 - Batch of Freshly Baked Revenue Estimates
- 1 - Copy of Joint Rule 3-2-402 (the recipe book)
Instructions:
- Prep: Each of the seven Appropriations Subcommittees thoroughly reviewed their assigned agency budgets, and approved intent language, fees, non-state fund adjustments, and prioritized wish lists for new state funds. These lists are the key flavor components of our fiscal dessert. (See individual subcommittee reports for specific ingredient details).
- Sift: On February 18th and 19th, the subcommittee chairs presented their reports and prioritized funding requests to EAC. These reports ensure the best ingredients are considered first.
- Check the Temperature: EAC’s culinary endeavors are aided by updated revenue estimates which, due to the timing of this year's session, are now available (though still subject to adoption by the Executive Appropriations Committee in the coming week). The flavor of the update is a net reduction across the Income Tax Fund and General Fund, to the tune of $74 million one-time and $38 million ongoing. (See the Tax Commission's Revenue Summary and Revenue Snapshot for the full collections information).
- Combine the Ingredients: Subcommittee priorities along with fiscal impacts of legislation may not always combine well with revenue projections, meaning that recipe adjustments may be necessary. More than one budget round ensures consistency.
- Bake: The budget must come out of the oven before March 7th. All funding increases, reductions, and technical adjustments will be carefully incorporated into one of several appropriations bills. EAC acts as the final taste tester for these gourmet bills.
Yield: one balanced budget.
Recipe Notes:
- Revenue estimates may add a bitter taste.
- This recipe requires careful attention to financial details and a steady hand.
- From the kitchen of Jonathan Ball.
The reports referenced in this post are available at the following links:
February Revenue Snapshot (FY 25)
Tax Commission Revenue Summary (Period 7, FY 2025)
Revenue Publications Archive
Here's Your Sine: Summary of the 2025 General Session Budget Actions
The Utah Legislature concluded its 2025 General Session with a budget of $30.8 billion for fiscal year 2026. The budget includes $12.7 billion from state funds (General Fund, Income Tax Fund, and Uniform School Fund).
Top legislative budget priorities included state fund investments in:
- Tax Relief – $103.3 million ongoing and $22.6 million one-time for an income tax rate cut from 4.55 percent to 4.50 percent, $2.0 million for a new nonrefundable tax credit for child care centers, and $4.1 million for expansion of the nonrefundable child tax credit; $24.1 million ongoing and ($1.3 million) one-time for expansion of the Social Security Benefits Income Tax Credit; and $16 million ongoing and ($13 million) one-time for single sales factor apportionment of financial institutions;
- Public Education – $178.6 million to increase the WPU Value by 4.0% to $4,674 for FY 2026, up from $4,494 in FY 2025. $47.4 million for the Educator Salary Adjustment, $45.2 million for the Educator Support Professional Bonus, and $471.6 million in one-time projects from the Public Education Economic Stabilization Restricted Account.
- Higher Education – $20.0 million ongoing for performance funding, $4.7 million ongoing and $5.0 million one-time for technical colleges’ growth and equipment; $5.5 million ongoing for a St. George Campus of the University of Utah’s Medical School; $58.5 million ongoing and $55 million one-time for new building construction;
- Affordable Housing – $20.0 million for First Time Home Buyer Program and $2.0 million for Shared Equity Revolving Loan Program;
- Homelessness – $1.9 million ongoing for a non-congregate family shelter and $5.5 million to support emergency winter and summer response throughout the state; and
- State Employee Compensation – $136.8 million ongoing in FY 26 and $19 million one-time in FY25 for a 2.5% salary increase for state and higher education employees, a 1% pay-for-performance bonus for state employees, and funding for retirement, long-term disability, leave pool, and health benefit rate changes.
As required by the Utah Constitution, legislators balanced the budget to projections of available revenue.
This document lists the most significant budget actions according to appropriations subcommittee: Spending Summary.
There are a number of resources available for the public and legislators to understand more about Fiscal Year 2025 and 2026 funding:
Budget Quick Facts – A pocket-sized guide to the budget.
DataViz – An interactive graphical representation of the budget. View the budget by sources, uses, and new money. Click a bubble to see how that item has changed over time, and in what bills it changed. Search for budget requests and find where it exists in appropriations bills.
Compendium of Budget Information (COBI) – A complete guide to the Utah State budget. Find budget requests on the Issues tab, and Line item/program budgets on the Financials tab.
The Fiscal Final Four: Latest Report Shows Upsets and Top Seeds
With only four more periods in the fiscal year (excluding close out), Legislative economists watch with anticipation to see how close their brackets revenue projections are to the yearend tally. In the latest Tax Commission Revenue Summary, a picture of mixed performance is seen across the state’s revenue streams, with some surprising upsets and strong advances. The Income Tax Fund continues to shine, despite Corporate Taxes being down 20% compared to this time last year. The March Revenue Snapshot, published jointly by the Governor's Office and Legislative Fiscal Analyst, describes revenues to all sources just inching past the annual growth rate, by 0.8%. A break down of the matchups is summarized below.
General Fund
This month the General Fund showed moderate growth, with Sales and Use Tax posting a 3.1% increase. However, other sources to the General Fund fell by 6.3%, meaning that the General Fund only grew 1.3% year-over-year (YOY). Like last month, a key factor in the "other sources" decrease is from investment income, due to lower interest rates. This is compounded by the fact that the state is spending down funds accumulated post-pandemic, resulting in lower balances that would otherwise generate interest.
A caveat to this month's General Fund collections are referees from the Tax Commission reviewing key plays related to earmarks transfers (related to water and transportation), due to those sources posting after the 5-day accrual period. The outcome of this official review will likely bring General Fund growth closer to 0.5%.
Income Tax Fund
The Income Tax Fund collections grew 2.5% through March, with Individual Income Tax being the MVP, posting a 4.8% increase. As mentioned in January's post about timing, the current period included an extra Friday when compared to the previous year's report, meaning that there was likely an additional pay period in the current year's collections. (TGIF?) As mentioned, Corporate Tax collections are roughly $70 million lower when compared to March of 2024, though this revenue source comprises only about 10 percent of the total Income Tax Fund.
Transportation Fund
The Transportation Fund retains the title of the budgetary Cinderella, with Motor Fuel Tax revenues up by 9.2%, and Motor Vehicle Registration Fees increasing 25.0% YOY. In total, the Transportation Fund is up 12.2% over FY 2024.
Key Takeaways:
As with any fiscal year, there are standout players and underperformers. Economists will wait until May to see how close their picks are, when April's filing deadline will start to appear in collection reports. (And if their brackets were as well informed as their consensus revenue projections, our economists would all be in Las Vegas right now.)
The reports referenced in this post are available at the following links:
March Revenue Snapshot (FY 25)
Tax Commission Revenue Summary (Period 8, FY 2025)
Revenue Publications Archive
On the Road Again: Evaluation Seeks to Optimize Travel Time for Inspectors
We’ve all been there: the second trip to the home improvement store for a part we forgot earlier; stopping at the grocery store every day during the work week; taking a student back home because they forgot their project that’s due today. These extra trips not only come with direct costs (like fuel), but also represent the opportunity cost of time we could have spent on more meaningful activities.
The Utah Department of Agriculture and Food’s (UDAF) Regulatory Services Division recognized an opportunity to spend more time performing valuable inspections by reducing “windshield time” (a.k.a., drive time) for their inspectors, especially in rural areas. Partnering with LFA’s Operational Excellence Team and the Results Management Team from the Governor’s Office of Planning and Budget (GOPB), this most recent efficiency evaluation focused on improving the use of UDAF inspectors’ time by:
- using automated tools and existing data to optimize inspection batching and scheduling, and
- designing a “pull” system in which time-sensitive and less-predictable inspection events trigger the scheduling of nearby routine inspections.
Batching Inspections Provides Time to Focus on Critical Activities
One operational strategy that our team recommended to UDAF to reduce miles traveled and inspector time behind the windshield is using technology to optimize travel routes and batch inspections. Our report highlighted this concept by reviewing inspections that took place in Washington County in October 2024. Our team found that by using a route optimizing tool and then consolidating the optimized stops, the seven actual trips taken in that month could be reduced to five as shown in the maps below, reducing travel time and mileage by about 27% (see page 12 of the evaluation).
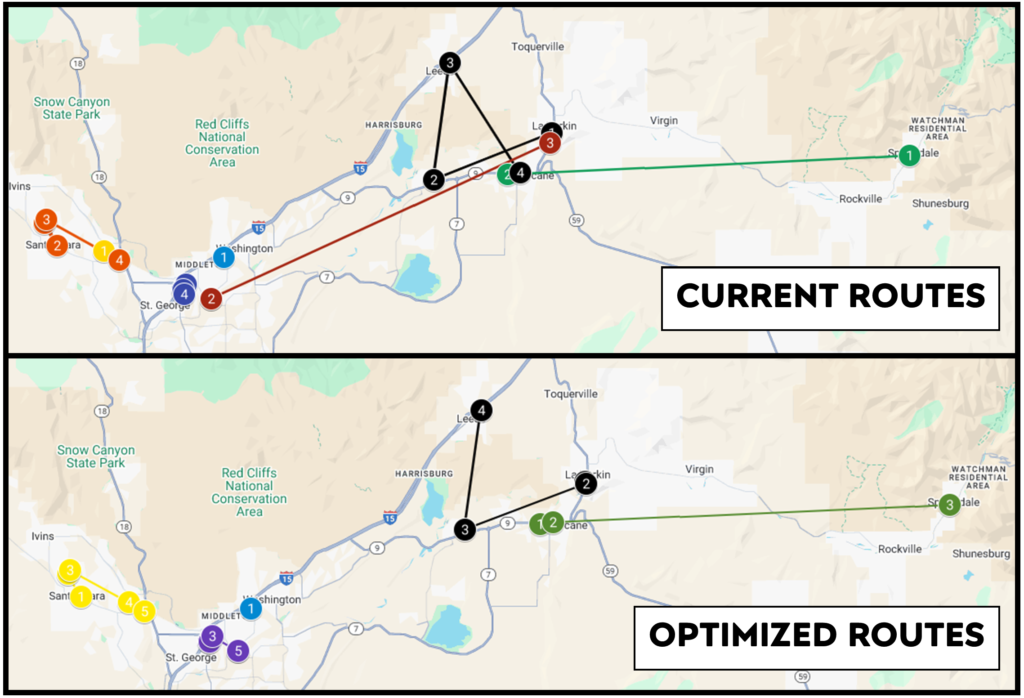
The impact of the optimization of routes for inspections can be seen in the table below, where two trips can be eliminated, saving roughly four hours of drive time for UDAF employees.
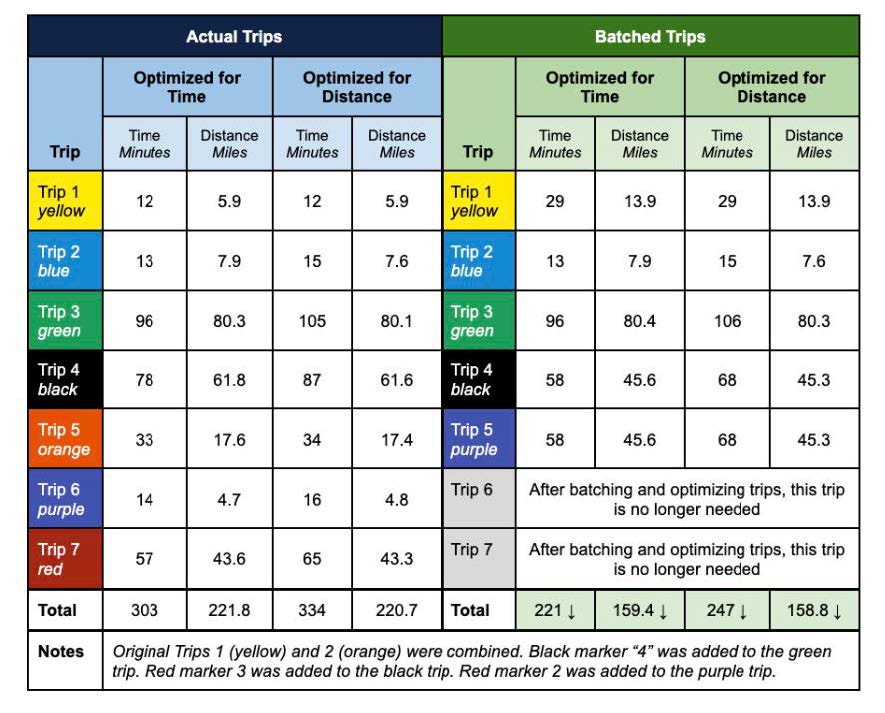
While the trips to inspection sites are relatively short in these examples from Washington County, more rural regions of the state, such as the Uintah Basin and central Utah where windshield time is a greater proportion of an inspector’s monthly workload, could see even greater time savings.
A companion strategy to better batching is to develop a “pull” system for routine inspections in more rural regions of the state. Redundant trips to rural areas of the state can be reduced by using time-sensitive and less-predictable inspections, like pre-operational inspections that allow a food-based business to begin operations, to trigger the scheduling of nearby routine inspections along the same route. More details about this strategy can be found on page 15 of the evaluation.
Less Driving, Reduced Backlog
Converting windshield time into increased time for inspections can also the Regulatory Services Division make progress toward a goal to reduce their backlog of past-due inspections. The growing number of registered establishments in the state, as well as the occasional need to divert inspectors to address emergencies such as food-borne illness outbreaks, can both contribute to this backlog, necessitating greater efficiency in covering the state’s inspection needs.
As of October 2024, there were at least 1,000 past-due inspections according to UDAF data. As UDAF adopts the strategies described above, as well as data-driven inspection planning and operator education, we expect that this backlog can be reduced. We estimated that adding 4-5 inspections per month to each inspector’s caseload could eliminate this backlog within 18-24 months, assuming steady staffing levels and no increase in the backlog’s growth rate.
This backlog volume is one of the data points that the Office of the Legislative Auditor General (OLAG) will be able to follow up on when they review the results of implementation over the next year. All follow-ups of efficiency evaluations and the status of implementing recommendations can be seen on OLAG’s dashboard. We look forward to seeing the results of this collaboration with UDAF and are glad to have had the opportunity to support them in their mission to ensure Utahns1’ access to a safe food supply.
Power Surge: Recent Investments in Utah's Energy
To accommodate an expected half a million new residents in the next decade, policymakers have undertaken a 'power surge' of policy and investment, aimed at securing the ample, affordable energy resources that support Utah's quality of life. The 2025 General Session underscored this urgency, with lawmakers considering nearly 30 energy-related bills and allocating a $10.0 million state investment towards nuclear power development. The figures below describe energy related funding during the last five general sessions, and broadly describe the categories into which these investments fall:
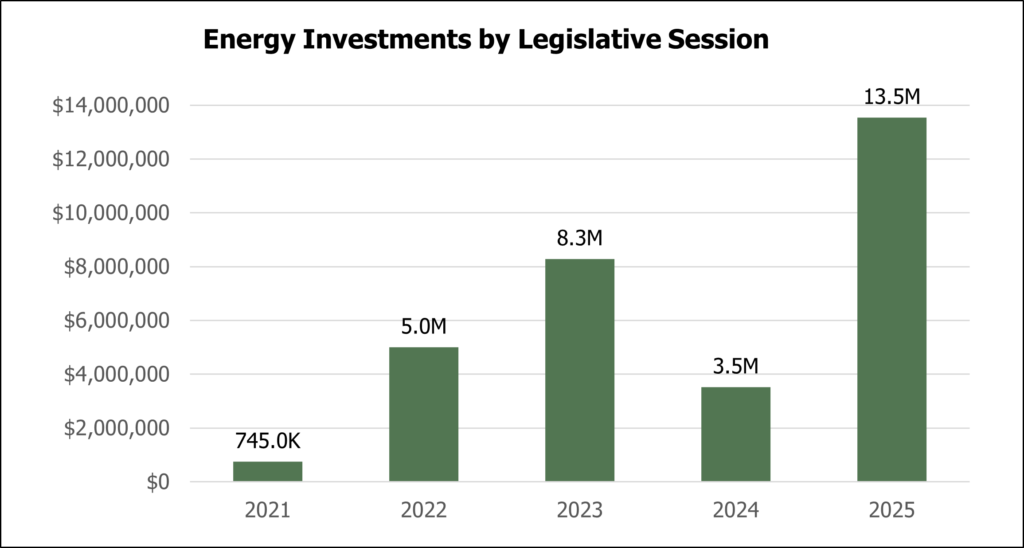
As mentioned, the largest single investment during the 2025 General Session was for nuclear power permitting and development. In the graph below, the category of 'generation facilities' includes funding related to the Intermountain Power Project and also permitting for a nuclear facility. While the San Rafael Energy Lab (a state owned facility) is used for research, it was separated from funding awarded to higher education institutions and research grants. More information about how items were categorized is available in this summary list.
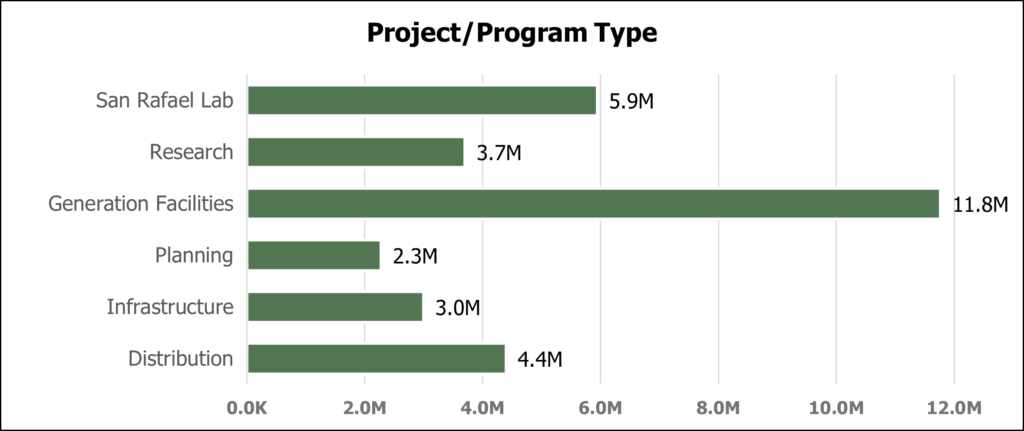
The federal government has also provided substantial resources in recent years for projects like grid resilience, with $105.5 million in federal funds appropriated to the Office of Energy Development for FY 2026. However, the future of these federal programs remains to be seen.
The funding mentioned above has primarily been appropriated to the Office of Energy Development (which is housed in the Department of Natural Resources). In addition to increasing the funding for power related topics in the 2025 General Session, the legislature added several new entities to assist with executing policies related to Utah's energy future. H.B. 249, "Nuclear Power Amendments" and H.B. 70, "Decommissioned Asset Disposition Amendments" created the Nuclear Consortium, Utah Energy Council, Utah Advanced Nuclear and Energy Institute, remodeled the Utah Energy Research Board, and repealed the Decommissioned Asset Disposition Authority. The graphic below shows how each of the energy related entities are connected and who they are required to report to, with the green boxes signifying programs under the Department of Natural Resources.
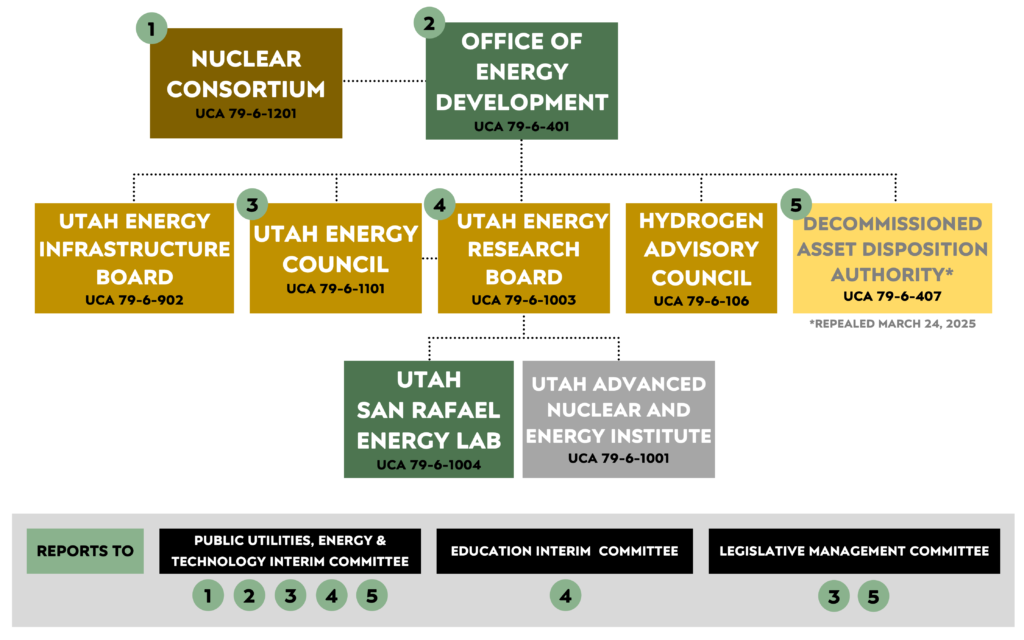
The grey sheep of this chart is the Utah Advanced Nuclear and Energy Institute, which is defined in statute as an agreement between Utah's higher education community and the Idaho National Laboratory.
While the state has made significant strides in the last few years to reimagine Utah's power landscape through incentives, improved regulatory framework, and research, it's likely that energy will be in the legislative foreground for the foreseeable future.
How Does Eliminating the Federal Department of Education Impact Utah?
In late March, the President issued an executive order to eliminate the U.S. Department of Education (DOE). What impact will this action have on education in the states is one of many questions raised by lawmakers, school professionals, and parents nationwide. Potential closure of the DOE is in the early stages, and little information is available regarding funding received by states.
While DOE oversees significant funding granted to the states, closure of the department and potential loss of federal funding may be separate issues. Federal grant programs received by Utah and other states are tied to federal legislation; examples include Individuals with Disabilities Education Act (IDEA) in public education or student financial aid (Pell Grants) in higher education. Elimination of the DOE does not necessarily mean the federal legislation and associated funding will be terminated. Preliminary information suggests the management of funds may be assigned to other federal agencies or provided through block-grant funding to states.
When it comes to Utah’s public education budget, the federal government plays a relatively minor role in providing funding to the state, but a significant role in funding certain programs. The Legislature appropriated a total of $598.7 million in estimated federal funding in public education for FY 2026, (approximately 7.0% of the total appropriation). The percentage impact increases significantly when looking at specific programs within the budget.
Federal funds are focused in four major areas in public education, Special Education, Title Programs (Economically Disadvantaged), Career and Technical Education, and Child Nutrition Programs. The nutrition programs are overseen by the U.S. Department of Agriculture (DOA), so there may be less risk associated with that funding. The list below provides contextual information on the four major federal grant programs:
- Special Education – Utah receives approximately $142.6 million in federal IDEA funding. On top of this amount, the Legislature has appropriated approximately $600.0 million ongoing in state funds to support special education programs. This makes federal funds approximately 19% of total special education funding. State statute governing special education in Utah are aligned to the federal IDEA laws and the federal process is used to determine eligibility. Changes in how the federal laws are implemented and monitored may impact delivery of special education services. Block granting these funds to the state may allow for greater state flexibility in implementation.
- Title Programs - $62.7 million in federal funding received through various Title Programs (i.e., Title I, Title II) the primary focus of the federal title programs is to provide funding for students experiencing economic disadvantage, migration, homelessness, etc. The Legislature has appropriated $130.5 million ongoing in state funds to support the Students At-Risk WPU Add-on program which distributes state funding to LEAs based on student economic disadvantage and English language learner status. Federal funds comprise approximately 32% of total funding dedicated for “At-Risk” students. Utah’s law for the Students At-Risk WPU Add-on is independent of federal funding and laws governing the Title Programs. While changes at the federal level may impact the use of Title funding, the use of the state appropriation is governed by state statute and local implementation.
- Career & Technical Education - $16.8 million in federal funding to support public and higher education CTE programs, often called the Perkins grant. The Legislature has appropriated $134.4 million to support CTE programs in the public schools and over $185.0 million to support technical education through higher education institutions. In this case, federal funding is just under 5% of total CTE funding (both PED and HED). Career and Technical Education programs in the public schools and higher education institutions are governed by state statutes and federal funds assist in the delivery of technical education.
- Child Nutrition - $354.4 million in federal funding to support school breakfast, lunch, milk, etc. programs. The Legislature has appropriated $50.1 million from the liquor tax to support the program. In this case, the federal government provides approximately 86% of the funding. Again, the DOA oversees these funds. While not at risk with the closing of the Department of Education, other reforms that may impact the DOA may also impact child nutrition programs in Utah. For example, there have been reports from various news sources about reduction in funding for schools to purchase local agricultural products for use in school meal programs.
These federal education grant programs have been renewed for the coming fiscal year (prior to the last continuing resolution), so the risk of immediate financial impact appears low. Fully eliminating the agency and federal grant programs (including governing laws) would require an act of Congress. To date, Congress has not commented on this issue or what a potential timeline for future action.
There are approximately $20.0 million in other minor federal grants received by the State Board of Education, these are mostly focused on student assessment, accountability, and teaching/learning programs. A listing of all federal grants received by the State Board of Education can be found here: State Board of Education Federal Grants.
There are a lot of unknowns as the potential closure of the Department moves forward. Hopefully, this summary is helpful in providing context to the issue and in answering constituent questions. For more information on federal funds, read the report by the Kem C. Gardner Policy Institute on the nexus of Utah and Federal Government: Utah/Federal Government Nexus.
Calibrating Collections: Why Small Changes Make a Big Impact in Revenue Reports
To provide a useful estimate of the year-to-date revenue for any state fund, collections must account for tax earmarks that are set aside for specific purposes and in some cases generated from specific subsets of a tax. The Tax Commission’s Revenue Summary (which informs the Revenue Snapshot’s contrast between collections and revenue estimates) provides a calculation for both the year-to-date earmarks and state fund collections. However, for the past few months this calculation has shown an uptick in underestimating the earmark values and overestimating General Fund revenue.
The reason that the earmark calculations have appeared to be underperforming relates to the timing of the revenue and reporting. Specifically, the earmarks are calculated on roughly the 20th of each month when local sales tax revenue distribution is tallied (a.k.a. ‘distribution periods’). State fund revenue is calculated from ‘fiscal periods’ which end on the 5th business day of the month. While these two accrual periods are similar, there is some time after the distribution period closes when the fiscal month is still ongoing. There are roughly two weeks between the closing of the distribution period for the purposes of earmark calculations and the end of the fiscal period when sales tax revenue is totaled for reporting purposes.
The chart below shows the relationship between these two overlapping accrual periods for the April Revenue Summary report and Revenue Snapshot. The green line shows year-to-date General Fund collections while the two black boxes show the periods over which the two revenue sums are accrued for calculation purposes. Changes occurring after the distribution period ends can cause earmark values to appear low while unrestricted revenue appears high.
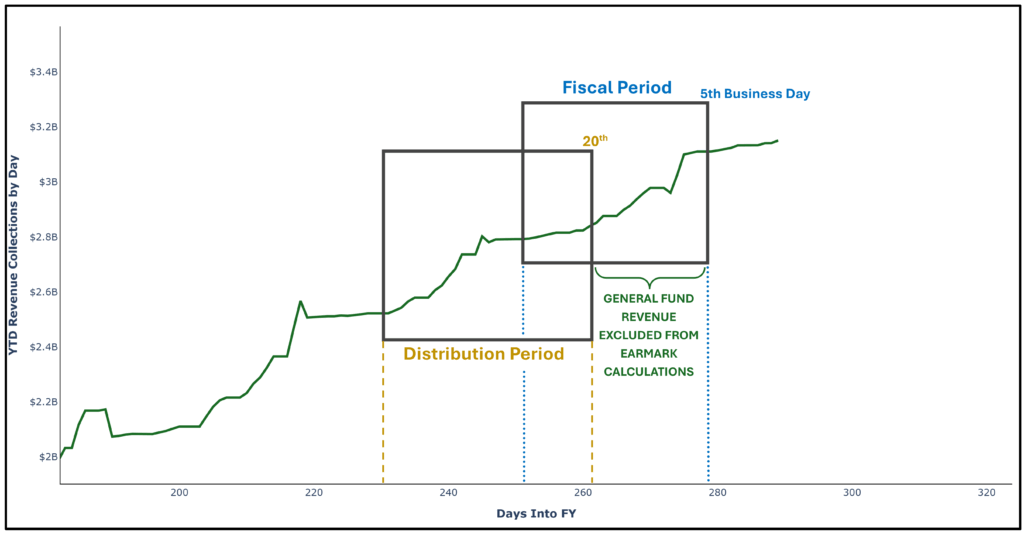
Usually, the timing difference in these two calculation periods is not a problem for year-over-year comparisons, since both the current and base collections have roughly the same relationship between the distribution period and the fiscal period. However, several factors may cause the accrual differences between the earmark and year-to-date revenue calculations to become more apparent, including fluctuations in the number of late filers, statute changes, and/or reporting process changes.
This year’s distortions have likely been caused by two main factors. First, at the end of Fiscal Year 2024, closeout accounting processes were updated regarding how revenues were attributed between fiscal years, which caused earmark totals to appear low in FY 2025 when performing a year-over-year comparison. Secondly, behavior of filers has changed from 2024 to 2025, so in several months earmarks calculations have appeared low.
In the coming weeks, economists from the Tax Commission, Legislature, and Governor’s Office will meet to discuss the best ways to improve reporting to lessen the impact of these factors on monthly revenue reporting.
The reports referenced in this post are available at the following links:
April Revenue Snapshot (FY 25)
Tax Commission Revenue Summary (Period 8, FY 2025)
Revenue Publications Archive
On the Move: Updates to Sales Tax Designated for Transportation
During the 2025 General Session, the Legislature passed three major bills that impacted the state’s budget for transportation and infrastructure:
- S.B. 195, “Transportation Amendments”
- S.B. 27, “Motor Vehicle Division Amendments”
- H.B. 502, “Transportation and Infrastructure Funding Amendments”
The impact of these bills is an increase from Sales Tax for transportation and a simplified calculation for specific set asides. The following post summarizes the budgetary impact of these bills and explains how they relate to the state’s financial position. For a refresher on transportation funds, check out this post from November.
S.B. 195
Prior to the 2025 General Session, the Utah Department of Transportation (UDOT) expressed concern about unnecessary strain on the Transportation Fund resulting from statutory transfers. S.B. 195 eliminated the ongoing transfer from the Transportation Fund to the TIF generated from the 1.8 cents per gallon Sales Tax on motor and special vehicle fuels (approximately $35 million annually).
The bill also designated $305.0 million one-time from the TIF of 2005 for two transportation projects and right-of-way acquisition:
- $2.0 million for the Coral Pink Sand Dunes Road Project;
- $3.0 million for the I-15 Salem and Benjamin Environmental Impact Study; and
- $300.0 million for the costs of right-of-way acquisition and construction for improvements on State Route 89 in a county of the first class.
During the 2020 5th Special Session, the Legislature passed S.B. 5012, “Statutory Adjustments Related to Budget Changes” which directed an annual transfer of $1.8 million from the TIF to the General Fund. This transfer reduced funding previously used by UDOT for litter and carcass removal. S.B. 195 eliminated this transfer from UCA 59-12-103(13), allowing UDOT to reinstate litter and carcass removal services.
Under current statute, 20.68% of all Sales Tax revenue is deposited into the TIF (left panel in the chart below) This deposit is comprised of two pieces: a 17% earmark under UCA 59-12-103(7), and a 3.68% earmark UCA 59-12-103(8). The 17% deposit is reduced by 0.44% for the Cottonwood Canyons Transportation Investment Fund, by 1% for the Commuter Rail Subaccount, and by up to $45,000,000 for the Active Transportation Investment Fund. Of the 3.68% Sales Tax deposit, a portion is redirected to the Transit Transportation Investment Fund, based on a calculation involving fuel tax revenue.
Effective July 1, 2025, S.B. 195 will increase the 17% earmark contained in UCA 59-12-103(7) to 24% (middle panel).
S.B. 27
Beginning July 1, 2026, S.B. 27 simplifies the calculations for sales tax earmarks. As can be seen in the right panel in the chart above, S.B. 27 provides a single point of diversion from sales tax for transportation projects (as opposed to the current path of 17% + 3.68%). S.B. 27 maintains the existing earmarks for the Cottonwood Canyons Transportation Investment Fund and the Commuter Rail Subaccount, though these portions will no longer be deducted from the deposit for the Transportation Investment Fund of 2005. This bill also reenacts the $1.8 million sales tax reduction that was repealed by S.B. 195 to be used for litter and carcass removal.
H.B. 502
In 2019, the Legislature passed S.B. 34 which requires certain municipalities to adopt affordable housing strategies in their master plans to be eligible for having projects prioritized by the Transportation Commission. UDOT also plays a role in housing preservation when homeowners are displaced for transportation projects. H.B. 502 authorizes UDOT to take out $70.0 million of general obligation bonds for Affordable Housing Infrastructure Grants, which are available to public entities within a county of the first class.
When evaluating grant proposals that include highway infrastructure, the Affordable Housing Infrastructure Board requires grantees to provide a minimum matching contribution of title to the right-of-way required for the highway improvements. This program will require UDOT to pay debt service of about $4.9 million annually for 15 years beginning in FY 2027 from the TIF of 2005.
H.B. 502 designates $74.5 million in grants and loans from the County of the First Class Infrastructure Bank Fund (local option sales and use taxes) to local governments for transportation and water infrastructure projects:
- $20.0 million loan to Draper for renovation of existing water pipelines and the expansion of drinking water infrastructure;
- $5.0 million loan to Herriman for the mitigation and replacement of impacted soils;
- $9.0 million grant to County of the First Class Highway Projects Fund;
- $4.0 million grant to Metropolitan Water District of Salt Lake and Sandy for the Little Cottonwood Creek conduit connecting to the water treatment plant;
- $2.0 million grant to Draper for construction, expansion, and renovation of new and existing drinking water infrastructure;
- $2.0 million grant to West Jordan for improvements to 6700 West between 9000 South and New Bingham Highway;
- $2.5 million grant to Riverton for improvements to 2700 West between 13400 South and Bangerter Highway; and
- $30.0 million grant to Bluffdale for construction of a multiple lane, 750 grade-separated rail crossing at 1000 West and 14600 South.
The bill also grants Spanish Fork $13.0 million from the TIF of 2005 for the costs of right-of-way acquisition, construction, reconstruction, or renovation to connect Fingerhut Road over the railroad to U.S. Highway 6.
H.B. 502 changes the list of transportation projects funded by the County of the First Class Highway Projects Fund and adds $13.5 million of projects to the list, including:
- $3,750,000 to West Valley City for improvements to 4000 West between 4100 South and 4700 South and improvements to 4700 South from 4000 West to Bangerter Highway;
- $1,700,000 to South Jordan for improvements to Prosperity Road between Crimson View Drive and Copper Hawk Drive;
- $2,300,000 to West Valley City for a road connecting U-111 at approximately 6200 South, then east and turning north and connecting to 5400 South;
- $1,400,000 to Magna for improvements to 8000 West between 3500 South to 4100 South;
- $1,300,000 to Taylorsville for improvements on 4700 South between Redwood Road and 2700 West; and
- $3,000,000 to West Jordan for improvements to 1300 West between 6600 South and 7800 South.
Lastly, the bill modifies Sales Taxes for transit projects in counties of the first class. The bill requires at least three counties of the first class (currently there is no minimum number of participating counties) to charge the sales and use tax authorized by UCA 59-12-2220 for the purposes of sharing revenue to pay for large transit projects. If Davis and/or Weber County were annexed into a public transit district revenues to the Transit Transportation Investment Fund (TTIF) would increase by $3,100,000 and $6,950,000 respectively, beginning as early as FY 2027.
Debt Service
Per Article XIV, Section 1 of the Utah Constitution, Constitutional Debt Limit is set at 1.5% of the total value of taxable property in Utah. General Obligation (GO) bonds are the only form of bonded debt that counts against the Constitutional Debt Limit. Currently, the limit is $11.86 billion, and the state has issued $1.55 billion in GO bonds, meaning that the present Debt-to-Debt Limit Ratio is 13.1%.
Over the last 5 years, the Debt-to-Debt Limit Ratio has steadily decreased, due to the taxable value of property in Utah increasing while the state has paid off GO bonds. The enactment of H.B. 502 includes $70.0 million in additional bonding authority, increasing the total GO bond debt to $1.62 billion. Similarly, the Debt-to-Debt Limit Ratio will increase from 13.1% to 13.7%. The table below lists the state’s Debt Payment System (Debt Service) from 2008 to 2030. This schedule does not include the additional authorization from H.B. 502, however those payments will be factored into Debt Service as new GO bonds are issued.
| Fiscal Year | Debt Payment Schedule |
|---|---|
| 2008 | $ 115,590,600.00 |
| 2009 | $ 203,450,700.00 |
| 2010 | $ 266,296,100.00 |
| 2011 | $ 320,768,800.00 |
| 2012 | $ 390,427,500.00 |
| 2013 | $ 424,370,200.00 |
| 2014 | $ 374,199,900.00 |
| 2015 | $ 410,631,800.00 |
| 2016 | $ 426,262,400.00 |
| 2017 | $ 404,323,700.00 |
| 2018 | $ 347,096,400.00 |
| 2019 | $ 329,022,000.00 |
| 2020 | $ 345,753,800.00 |
| 2021 | $ 408,276,600.00 |
| 2022 | $ 435,814,500.00 |
| 2023 | $ 428,637,100.00 |
| 2024 | $ 396,861,900.00 |
| 2025 | $ 413,416,300.00 |
| 2026 | $ 292,125,200.00 |
| 2027 | $ 213,795,000.00 |
| 2028 | $ 176,436,700.00 |
| 2029 | $ 111,461,000.00 |
| 2030 | $ 84,784,800.00 |
From the Ground Up: Affordable Housing Investments and Initiatives
According to the Federal Reserve, in 2015 the average home value in Utah was just over $230,000. Ten years later, the average home value has more than doubled to an average price of $530,000. While 2015 to 2020 provided steady, moderate growth, the last five years were marked by the profound impacts of the pandemic and interest rates. As can be seen in the graph below, the interest rate increase in 2022 changed the trajectory of the market from the rapid ascent that began in mid-2020, returning home price growth to a more moderate pace.
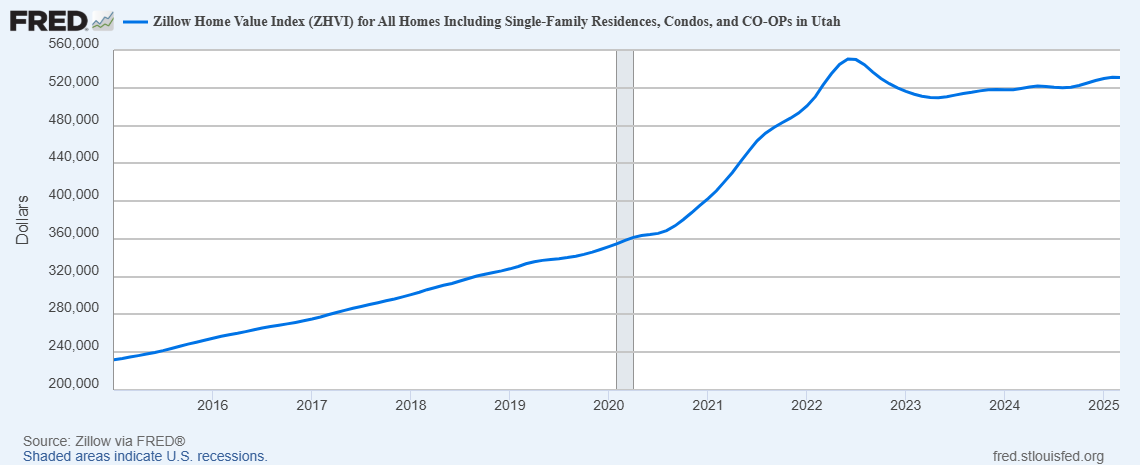
While it’s easy to summarize recent impacts to the housing market under the umbrella of ‘the pandemic,’ in reality many factors have influenced Utah’s home price in the last decade, including: labor and supply shortages, high and low interest rates, inflation, land use policies, and population growth (from natural growth and in-migration). But wait, there’s more! On the horizon, economic uncertainty and tariffs look to add new layers of complexity to the ever-changing housing market.
While state-by-state comparisons vary, Utah remains one of the least affordable places to purchase a home, when comparing personal income to housing prices nationwide. The Utah Geospatial Resource Center found that 60% of the state's zip codes had a home-price-to-income ratio of over 5.
At the same time, Utah’s workforce has experienced robust salary growth. According to the Federal Reserve, Utahns have seen per capita personal income grow from roughly $40,000 in 2015 to $66,500 in 2024. While substantial, the pace of income growth hasn't matched the growth of real estate prices---the average home price grew roughly twice as fast as personal income in the last ten years.
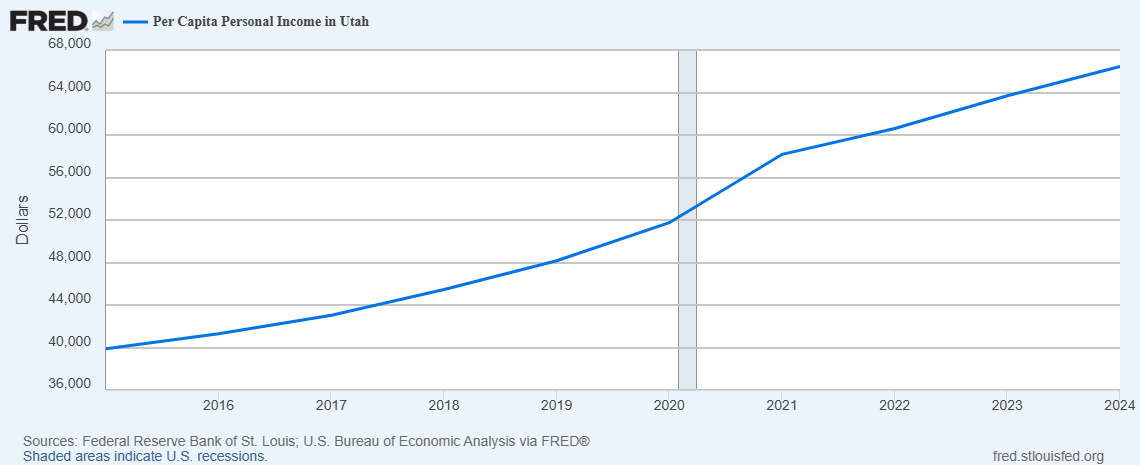
In the Utah Foundation’s 2024 Annual Report, polled voters identified housing affordability to be their number one priority. In response, the legislature has worked to craft and pass legislation that to target zoning, land use, and develop affordable housing programs. In the 2025 General Session, the legislature made the following investments in housing affordability:
- First Time Homebuyer Program -- $20.0 million one-time for mortgage rate buydown or down payment assistance for first-time homebuyers;
- Shared Equity Revolving Loan Program -- $2,000,000 one-time for the expansion of the program that uses a shared equity model for low and moderate income families and individuals focusing on first-time homebuyers, active military, and veterans;
- Affordable Housing Acquisition/Pre-Development Loan Fund -- $500,000 one-time for lending towards affordable land acquisition and predevelopment for affordable house developers;
- Southeastern Regional Development Agency (SERDA) Land acquisition -- $500,000 one-time for the purpose of starting a revolving loan fund for land acquisition for the U.S. Department of Agriculture (USDA) Mutual Self-Help Program in Carbon, Emery, and San Juan Counties;
- H.B. 262, “Housing Affordability Modifications” -- $92,500 one-time and $263,200 ongoing for the creation of a first-time homebuyer loan program and administration of the loan program;
- Housing Choice Voucher Incentive Program -- $350,000 one-time for the mitigation and reduction of financial risk for landlords who provide housing to recipients of U.S. Department of Housing and Urban Development (HUD) choice voucher, also known as Section 8 housing; and
- Utah’s Habitat for Humanity Homeownership Fund -- $100,000 one-time for program support of the housing affordability efforts and to pursue larger multi-family housing projects.
As was discussed in last week’s post, H.B. 502, “Transportation and Infrastructure Funding Amendments” also authorized the Department of Transportation (UDOT) to bond for $70.0 million for Affordable Housing Infrastructure Grants.
In January, Governor Cox discussed his goal to build 35,000 starter homes within five years. This week, the School and Institutional Trust Lands Administration (SITLA) closed on a Request for Proposal (RFP) in Washington County to develop up to four parcels of trust lands for the purposes of building affordable housing. The proposals must include a housing plan for detached structures at a $400,000 price point for roughly $250 per square foot. In phase one of this development plan, SITLA collected information from southern Utah municipalities on relevant programs or incentives that could be paired with development projects. Similar proposals have been discussed in Wasatch County, though no development has currently taken place.
There may also be opportunities for SITLA to coordinate with Federal Programs to increase the amount of affordable housing, as trust lands frequently border federal properties and are found in areas adjacent to existing municipalities. The future of this state-federal partnership remains to be seen.
For a summary of affordable housing investments from 2020 to 2024, check out this post from last August: The Reality of Realty.
For more information on Federal Housing Assistance in Utah, see this report from the Kem C. Gardner Policy Institute: Utah/Federal Government Nexus.
Lost in the Sauce: the Messy Business of Tariffs
As discussions surrounding tariffs circulate through the news, it is important to understand what they are and how they work. Tariffs are taxes that are imposed by governments on goods and services imported from other countries. The primary intent of tariffs is to raise the price of imported goods relative to domestically produced goods, so that national commodities have a competitive price advantage. Tariffs are a form of protectionist policy and are often employed to protect emerging and strategic industries and to preserve domestic labor opportunities. In rare circumstances, tariffs can be used as a penalty or in retaliation against other countries. This post serves to illustrate the economic impact of tariffs using the most delicious Utah commodity, fry sauce.
To investigate how tariffs shift supply and demand, we first need to start with a market that doesn’t allow trade. We can see on the chart below that a market in equilibrium without trade will have its Price (Pe) and Quantity (Qe) set where domestic demand intersects domestic supply. Let’s say this is the market for fry sauce, a Utah classic. In this instance, Pe could be $18 for a bottle of Utah-made Arctic Circle Fry Sauce, and Qe is 1,000.
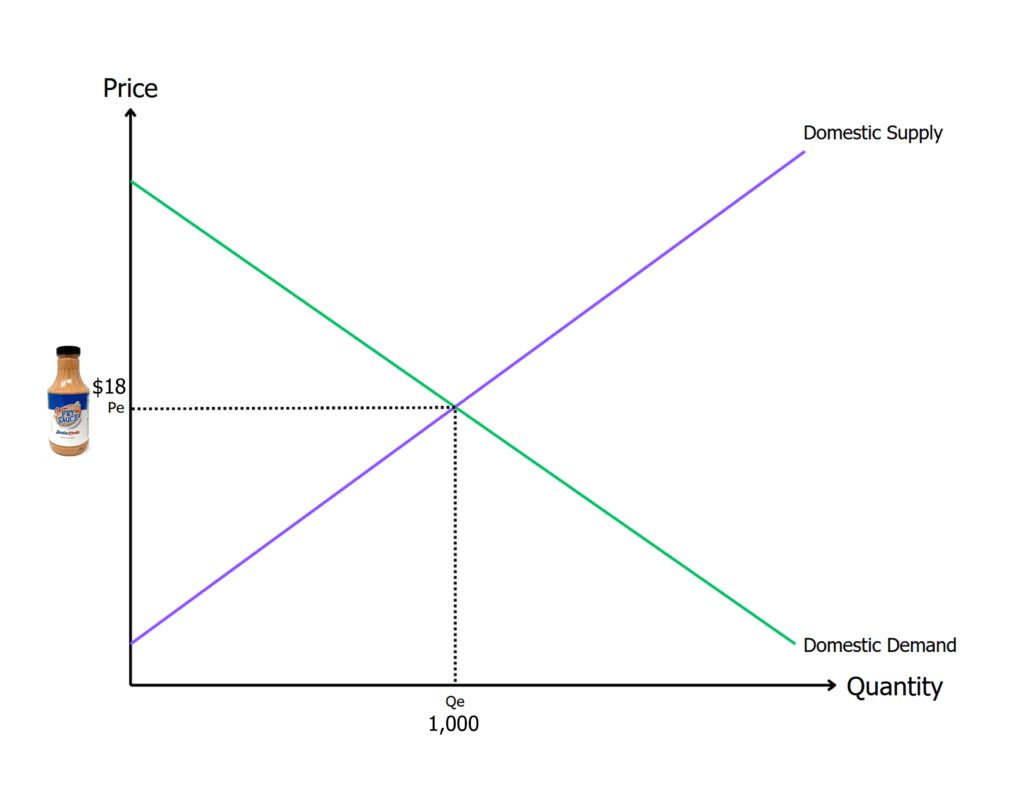
When we allow for international trade in the Utah condiment market, we find that the World Price (Pw) is typically well below $18. This is because we are opening our consumption up to a much larger market comprised of businesses who in many cases are more efficient at producing fry sauce. We can see on the second diagram below that when including global products, the competitive price would drop from Pe to Pw, creating a divergence in the domestically produced quantity (Qs) and the domestic demand (Qd) at this lower price. The difference between Qs and Qd is made up by imports. Returning to our sauce analogy, if Pe is $18, Pw is the equivalent of importing golf sauce from Argentina at $7. (Golf sauce, or salsa golf, is mayo and ketchup-based sauce that for the purposes of this analogy can act as a perfect substitute for fry sauce.) Because so many people switch to buying the cheaper sauce, Utah manufacturers would start being priced out. This would result in domestic production dropping from 1,000 at Qe to 700 at Qs. However, with the new, lower price, domestic demand would rise from 1,000 at Qe to 1,300 at Qd.
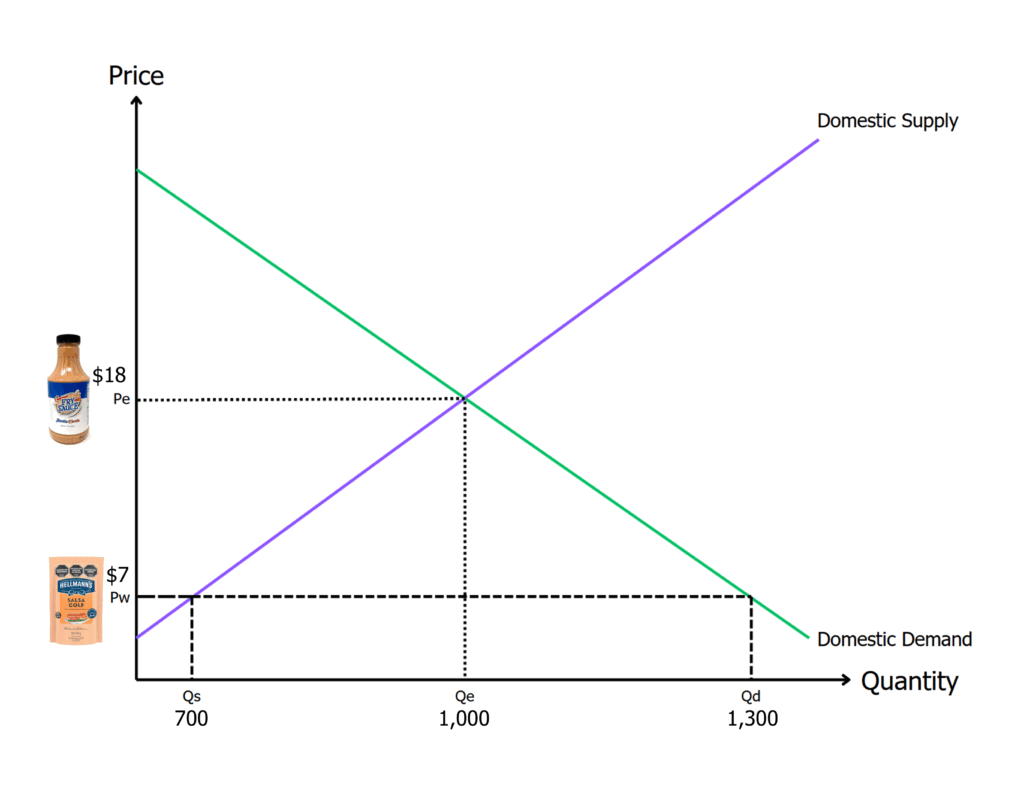
At this point in the sauce shortage, a tariff could be introduced to help bring domestic supply in line with demand. In the third chart below, the impact of introducing a tariff raises the price to Pw + Tariffs (the world price plus the tariff). In our example, Utah could choose to put a $4 per bottle tariff on imported fry sauce, increasing the price to $11. That would increase domestically supplied fry sauce from Qs at 700 to Qs + Tariffs at 800. This would, however, also drop domestic demand for fry sauce from Qd at 1,300 to Qd + Tariffs at 1,200. The impact of the tariff being 200 additional units that are produced in Utah rather than being imported.
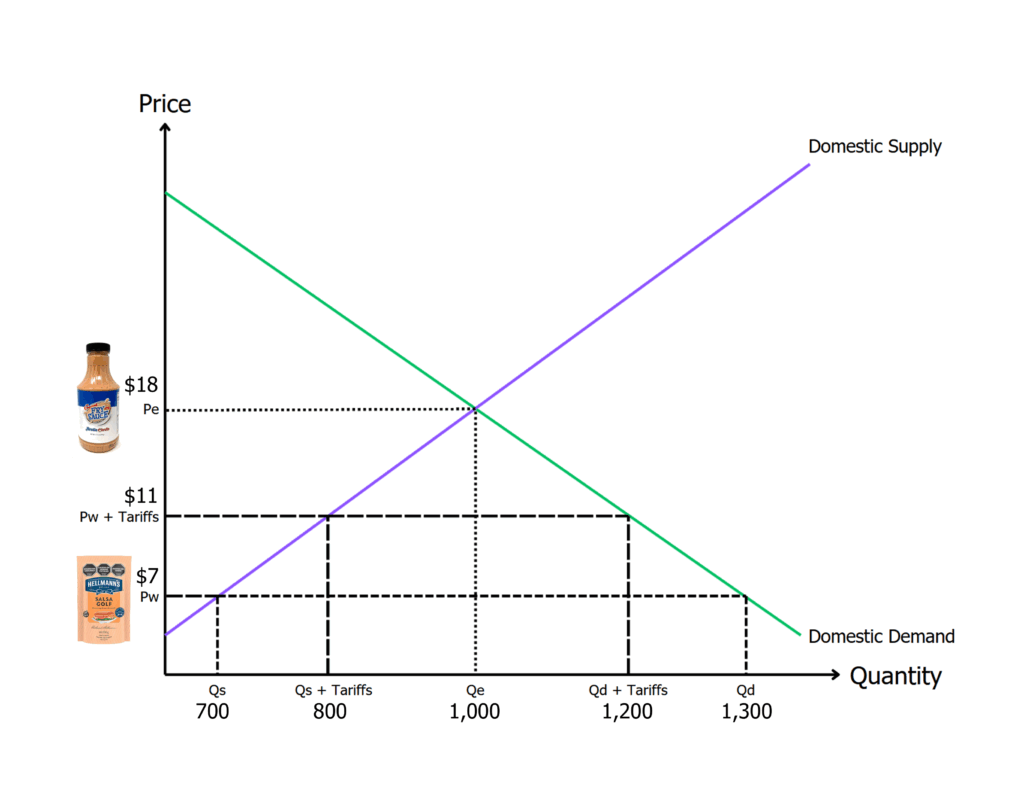
Based on this model, we could theoretically see a resurgence in fry sauce in Utah, which may have jobs associated with the increased condiment production. We can also see that a tariff could have an artificial inflationary effect on a market since the price increased by 57% from Pw ($7) to Pw + Tariffs ($11).
It is important to note, however, that when a tariff is announced, it is often announced as being levied against another country; however, this can be misleading because the country that has the tariff levied against it never pays the tariff. Depending on how long the tariff is in effect, the additional cost could either be absorbed by a company to keep prices consistent or it could be passed on to the consumer. In this way, tariffs essentially act as a tax on consumption, predominantly affecting anyone who purchases imported goods.
In the United States, tariffs are collected by U.S. Customs and Border Protection (CBP), which operates under the authority of the Department of Homeland Security but enforces trade laws and regulations on behalf of the U.S. Department of Commerce. Typically, CBP officers assess and collect tariffs and duties at ports of entry when goods cross the border. Historically, U.S. tariffs have varied significantly depending on the economic or political climate. However, in recent years, the United States has embraced more free trade principles, including entering into agreements like those organized by the World Trade Organization and pacts like the North American Free Trade Agreement (NAFTA) (now the United States-Mexico-Canada Agreement, USMCA). These trade agreements meant that the U.S. has averaged tariffs of 2.2% until recently. Additionally, since about 1945, tariff revenue has comprised only about 2% of the total U.S. federal revenue.
Never Gonna Give BOTSU Up
The Legislative Fiscal Analyst's (LFA) annual budget report for the State of Utah dates all the way back to the 1960s. That means that for the last 60 years we've provided a breakdown of the state's budgetary acts to help you find the answers to what you're looking for. Do you want to know how much the state budgeted for mental health programs in Fiscal Year 1977? We reported on it. Are you interested in finding out how much was appropriated to the Tax Commission for license plate production in 1991? We reported on it (and for those interested, it was $1,278,900). Budget reporting is in our bones, and like Rick Astley once said, we are never going to give it up.
This document is everything you’ve come to expect and love from our office: numbers, revenue, and appropriations shown in an ever-improving, accurate and reliable format. The report is broken into nine different chapters: one for each of the eight appropriations subcommittees and a statewide summary chapter that encompasses larger impacts from all the topical funding areas.
While BOTSU officially stands for the Budget of the State of Utah, we wouldn’t mind it being known amongst friends as the Best of the State of Utah. It’s a report that details budget actions that were taken during the legislative session, with the goal of providing a one-stop shop for those looking for intel into the funding acts of the legislature.
While the report itself is required by UCA 36-12-13 to be compiled every spring, analysts don’t publish the report in order to simply check off a statutory requirement. That’s not the LFA way. Budget staff want this report to be something readers can depend on for years to come as accurate, digestible information, no matter if you’re an elected official, a state agency, or a member of the public.
The BOTSU process begins immediately after the General Session comes to a close, and LFA drafts the report with our readers in mind, from the format of the budget tables to the online version we upload online. This year’s report boasts two new features: Table 2C (a.k.a, the subcommittee roll up) and improved listings for expendable accounts. Table 2C may look familiar to our customers who frequent the Compendium of Budget Information site, since it summarizes the information available there. With these two new additions, it’s easier to understand how BOTSU relates to other financial data published by the legislature.
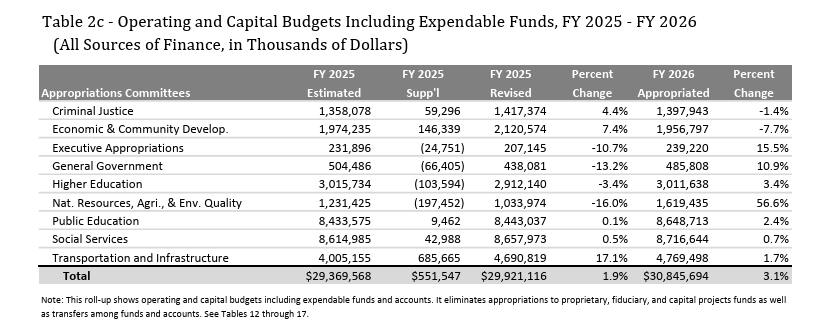
As an office that is borderline addicted to fiscal improvements, LFA is already laying plans on how to improve next year’s edition of the Budget of the State of Utah. Specifically, staff are working with the Division of Finance on how to improve the relatability between BOSTU and the Utah Annual Comprehensive Financial Report (ACFR). A current barrier to cross walking these two reports is the method of cataloging budget areas (i.e. ‘subcommittees’ in BOTSU versus ‘activities’ in the ACFR).
BOTSU also does more than provide LFA with the opportunity to scratch the post-session itch for fiscal itemization. This report is used by the Governor’s Office and the Treasurer during their annual trip to New York to visit bond rating agencies. BOTSU assists the state in maintaining our highly desirable AAA bond rating (from Moody’s, Fitch, and S&P). Additionally, when the state issues a General Obligation Bond, (such as the $70.0 million authorized for the Department of Transportation in the 2025 General Session) credit analysts use information included in BOSTU to determine the state's interest rates based on perceived risk. BOTSU includes information that assists the state in getting favorable terms for debt, such as Utah's financial structure, current debt information, and balanced budget.
Now, would LFA really be doing their part in making this report easily accessible if they only made BOTSU available in its physical, beautifully bound book with hundreds of pages? Of course not! BOTSU can be found on budget.utah.gov. However, for those wanting to bury their nose in a rich retelling of the fiscal spending this past session, you’re in luck. If you would like a hard copy, contact the Office of the Legislative Fiscal Analyst (and remember, it makes a great gift).
Don't Just Settle: Leveraging Opioid Funds for Lasting Impact
The 2025 General Session continued the Legislature’s work in thoughtfully utilizing the Opioid Settlement payments to help Utah’s citizens impacted by the opioid epidemic, including the growth of fentanyl use. As a reminder, in 2021, nationwide settlements were reached to resolve all opioid litigation brought by states and political subdivisions against the three largest pharmaceutical distributors, McKesson, Cardinal Health, and AmerisourceBergen, and also against manufacturer Janssen Pharmaceuticals, Inc. and its parent company Johnson & Johnson. (For a refresher, see this post from last July.)
These agreements were followed in 2022 by additional settlements reached with CVS, Walgreens, and Walmart, and two additional manufacturers: Allergan and Teva. Since that time, there have been additional smaller agreements with advertising firms, additional distributors and pharmacy chains.
The Utah will receive almost $543 million in total from opioid settlements over 17 years through 2039. With the State receiving $276.7 million and counties receiving $266.3 million. The majority of the settlement funding will be split 50-50 between the state and participating Utah counties to support the needs of addiction treatment, prevention, and recovery. See the planned distribution scheduled below for both state and local funds:
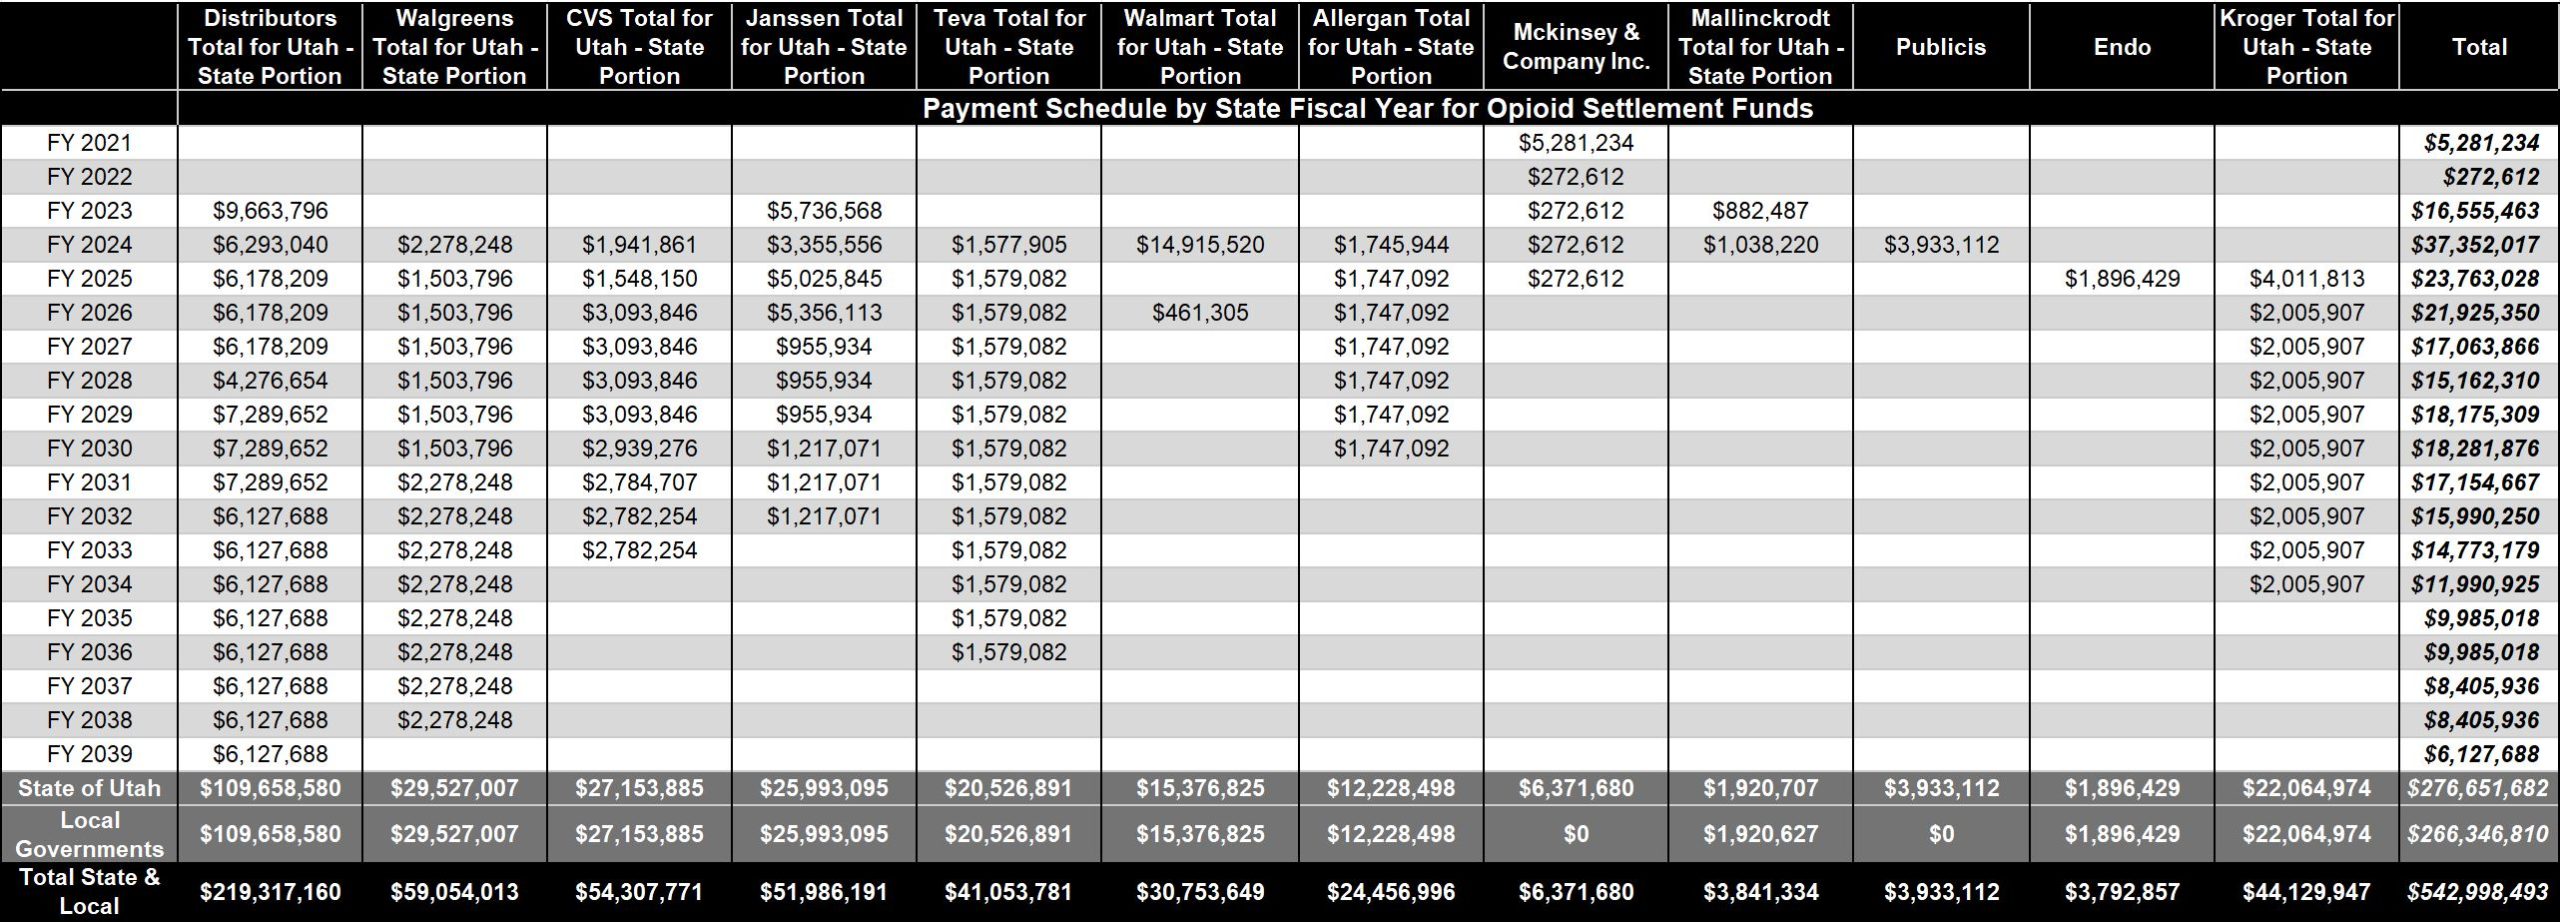
During the 2025 General Session, the Utah Legislature passed H.B. 10, "Fund and Account Modifications" which implemented changes in the way these funds are managed to provide a sustainable revenue source to help those struggling with and impacted by opioid addiction. The bill changed the Opioid Litigation Proceeds Restricted Account into a permanent fund. With this new fund type, only investment earnings are available for expenditure with the principal being managed to generate sustainable funds for appropriation. With this change, the Legislature has taken one-time funding and turned it into an ongoing revenue source that can benefit Utahns indefinitely. Depending on how revenues materialize, there may be $5 million per year available in this fund to address the impacts of the manufacture, marketing, distribution, or sale of opioids.
This legislation also provided for previous appropriations and adjustments made during the 2025 General Session to be exempted from the limitations of this new fund. The table below shows appropriations from the restricted account from the 2021 through 2025 General Session:
As the Legislature looks ahead to the 2025 Interim and 2026 General Sessions, staff will begin the process of reviewing past expenditures. The Social Services Appropriations Subcommittee has included intent language to provide for the review of each appropriation after 3 years to determine whether it is working as intended or if the funds should be reallocated elsewhere. Preliminary findings related to expenditures can be found here: Opioid Expenditure Table Summary.
Careful planning and prudent financial management of settlement proceeds has left Utah well poised to quickly react to constituents needs as the opioid epidemic evolves.
Win-Win: An Overview of Districts Centered on Sports
Recently, the Legislature has been active in the expansion or creation of designated areas which utilize funding mechanisms such as taxing authority, redirected revenue, and bonding capacity to achieve public purposes for a broad audience of Utah taxpayers. In exchange for these financial benefits, the local districts are tasked with furthering goals such as urban revitalization, economic development, and cultural enhancement.
One such area is the Sports, Entertainment, Culture, and Convention District (SECC) originally authorized by S.B. 272, “Capital City Revitalization Zone” (2024 General Session). The legislation allowed the state’s capital city to implement a 0.5% sales tax and designate a public infrastructure district to levy property tax. Since then, Salt Lake City has entered into a participation agreement with the Smith Entertainment Group which lays out the plan for the use of funds. Under the terms of the agreement, the project participant agreed to use funds raised from bonding against the sales tax increment to revitalize a three-block area which includes the Delta Center. Additionally, Smith Entertainment Group agreed to contribute to a public benefit account, support workforce development and community initiatives, create public gathering spaces within the district, and refrain from moving any professional basketball or hockey teams out of the Delta Center while the agreement is in effect.
Sports, Entertainment, Culture, and Convention District
| State Authorized Funding Mechanisms | Public Purposes |
|---|---|
| Sales Tax Authority | Urban Redevelopment |
| Property Tax Authority | Workforce Expansion |
| Public Infrastructure Investments |
Another example, the Utah Fairpark Area Investment and Restoration District (UFAIR) is set up somewhat differently from the SECC. Instead of granting taxing authority to an existing political subdivision of the state, H.B. 562, “Utah Fairpark Area Investment and Restoration District” (2024 General Session) created UFAIR as a new, independent political subdivision aimed at developing the land within its borders for public benefit. More specifically, UFAIR was tasked with developing a sports stadium and supporting infrastructure, restoring the area around the Jordan river, and other improvements to State Fair Park Authority property. To facilitate these efforts, the state exempted construction materials used in the sports stadium from sales tax, redirected tax on sales within the district to the Authority, and authorized the collection of enhanced property taxes as well as several consumption taxes (including Transient Room Tax).
Utah Fairpark Area Investment and Restoration District
| State Authorized Funding Mechanisms | Public Purposes |
|---|---|
| Sales Tax Revenue + Exemptions | Sports Stadium |
| Consumption Tax Authorization | Jordan River Restoration |
| Enhanced Property Tax | Public Infrastructure Improvements |
Among the benefits of creating local districts is that the State can improve public goods and services while expending little or no financial or administrative resources. When contemplating the creation of a local district, it pays to carefully consider what powers the district is allowed, how it is to finance itself, and what oversight mechanisms should be in place to ensure accountability to Utah’s taxpayers.
Speaking of Sales Tax, you may be interested in the latest revenue collections, available here:
June Revenue Snapshot (FY 25)
Tax Commission Revenue Summary (Period 11, FY 2025)
Revenue Publications Archive
Liberating the Ledger: Increasing Transparency in Higher Education Budgets
In the world of higher education budgets, funding takes one of three forms:
- State Appropriations: consisting primarily of General and Income Tax Fund;
- Tuition Revenues: paid by students for instruction services; and
- Institutional Funds: consisting of grant funding and earnings from executed contracts, athletic revenues, and other businesslike activities that support the institution.
Historically, the Legislature has only tracked the first two buckets, and even those were appropriated primarily in lump sums to institutions with little to no programmatic guidance. To provide greater insight into the budgets of Utah’s colleges and universities, the Higher Education Appropriations Subcommittee utilized the Accountable Budget Process (ABP) during the 2023 interim to redesign the appropriation structure for higher education. The 2023 ABP outcomes included accounting for all revenue sources within higher education and a restructure of appropriation units to provide greater insight into how both appropriated and non-appropriated dollars are being utilized.
Starting with the 2024 General Session, appropriations bills for higher education consist of two sections: Operating and Capital Budgets and Higher Education Budget Reporting. Operating and Capital includes state appropriations and tuition revenues and is the area of the budget which is controlled by the legislature. Historically, Operating and Capital has been the only information included in higher education appropriations bills. The Higher Education Budget Reporting section is intended as an informational addendum to provide a complete picture of each institution’s budget. This section includes a summary of state appropriations and tuition revenue and adds elements of institutionally controlled revenue (such as grants, endowments, ticket sales, etc.) These sections are not additive but instead are meant to illustrate the contrast in elements of funding provided by the state and those revenue sources which are derived by the colleges and universities themselves.
Below is an example of the two budget sections in appropriations bills. In this chart tuition revenues are orange, state funding is green, and institutional funds are blue.
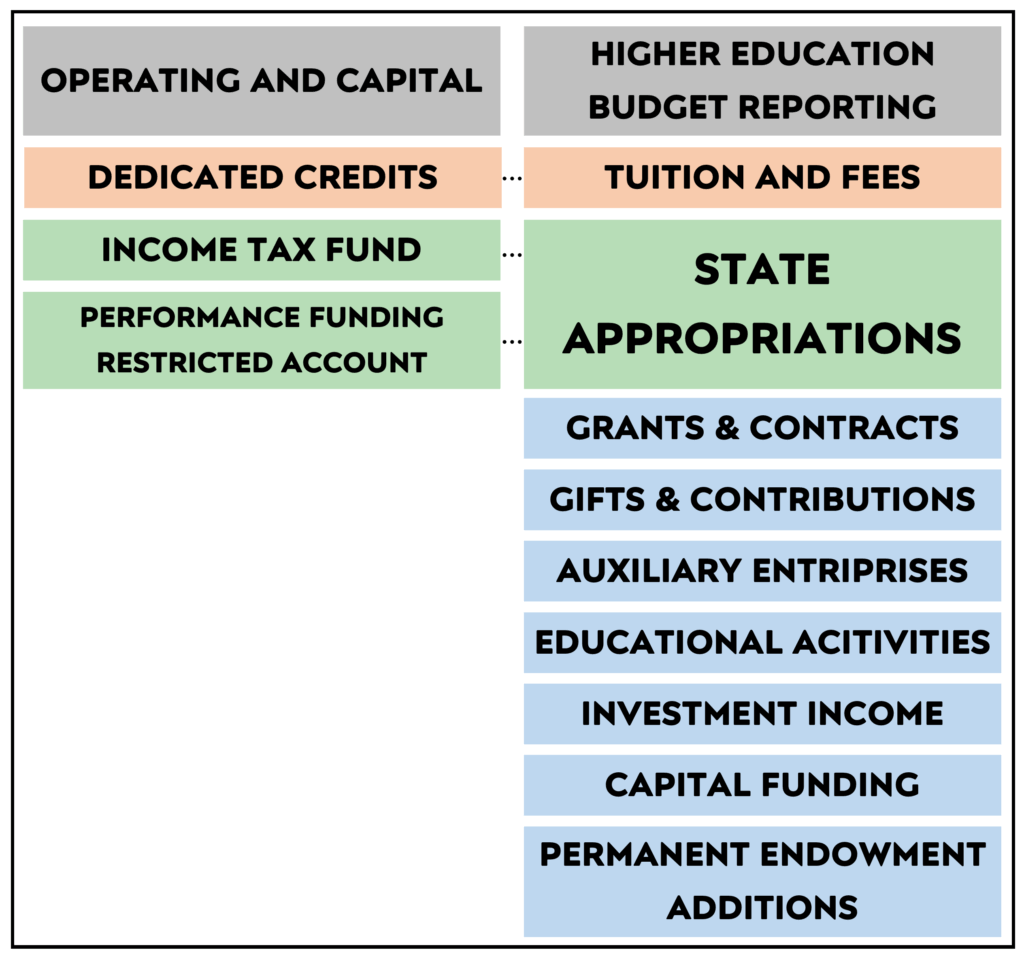
In addition to creating the new Higher Education Budget Reporting section of the budget, the subcommittee also created new appropriation units to provide a better understanding of how state investments were being spent in higher education. To avoid duplication of effort for institutional finance offices, the subcommittee chose to utilize functional expenditure categories as the new appropriation units. Functional expenditure categories are broad categories utilized in reporting to the federal Department of Education and capture the many activities an institution undertakes to help students be successful in higher education. These are not to be confused with programs, departments, or offices; rather, they are categories of operations. Below is an example of how Operating and Capital Budgets in Southern Utah University’s Education and General line item Fiscal Year 2026 budget comparing the old structure with this new system of functional appropriation units.
| Old Appropriation Unit Structure | Amount | New Appropriation Unit Structure | Amount |
|---|---|---|---|
| Education and General | $143,423,900 | Instruction | $60,995,100 |
| Educationally Disadvantaged | $108,300 | Public Service | $1,570,400 |
| Operations and Maintenance | 11,277,000 | Academic Support | $16,597,100 |
| Student Services | $27,613,700 | ||
| Institutional Support | $27,370,500 | ||
| Scholarships and Fellowships | $9,385,400 | ||
| Operations and Maintenance | $11,277,000 | ||
| Total | $154,809,200 | Total | $154,809,200 |
These appropriation units are duplicated in the Higher Education Budget Reporting section to provide for direct comparisons between legislatively controlled funding and institutional dollars among colleges and universities. As a result of this budget restructuring, the Higher Education Appropriations Subcommittee has adopted a five-year accountable budget plan around the functional budget programs to conduct a deep dive into comparisons among institutions. During the 2025 interim, the subcommittee is focusing on the Instruction appropriation units.
Both changes (the new appropriation units and new bill section) allow legislators to make informed decisions about the overall impact a dollar has at each institution, and how institutions are utilizing their appropriations to leverage further investments in the state.
Fireproof Funding: Recent Changes in Utah's Wildfire Budget
In Utah—and the rest of the western United States—footing the bill for wildfire prevention, suppression, and mitigation is a persistently hot topic. The challenge of addressing wildfire on state, private, and federal lands, layered with the complexities of increasingly arid conditions, multiplied by population growth, and seasoned with competing budgetary priorities results in a natural resource issue which is anything but clear cut.
In the 2025 General Session, the Legislature passed H.B. 307, “Wildfire Funding Amendments” which combined three separate funds into a single pot focused not only on fighting wildfires but also on pre-fire and post-fire activities. The bill moved the balances from the Wildland-Urban Interface Prevention Preparedness and Mitigation Fund, the Wildland Fire Preparedness Grants Fund, and from the Wildland Fire Suppression Fund into the newly created (and most succinctly titled) Utah Wildfire Fund. The graphic below details the various sources to the fund and permissible uses.

As an expendable special revenue fund, this account does not require an appropriation by the Legislature to be used by the division for purposes authorized in statute. A notable change included in H.B. 307 was a minimum annual expenditure from the Utah Wildfire Fund of $10.0 million for wildfire prevention, preparedness, and mitigation efforts.
Prior to 2021, budgeting for wildfire suppression costs was reactionary--essentially always playing catch-up with last season’s expenses. However, a significant shift occurred during the 2021, 2022, and 2023 General Sessions, when the Legislature allocated a total of $155.2 million to fire suppression (including $10.0 million ongoing). This substantial investment transformed the former Wildland Fire Suppression Fund into a proactive, working rainy day fund. In fact, the interest earned by the fund in fiscal years 2024 and 2025 almost entirely covered the state's share of wildfire costs for the 2024 fire season.
Federal Funding for Wildfire
It comes as no surprise that wildfire doesn’t adhere to property boundaries. With nearly two-thirds of the state being owned by the Federal Government, collaboration on fire response is a requirement. At the end of each fire season, the Division of Forestry, Fire and State Lands (FFSL) settles with federal partners, including the United States Forest Service (USFS), the National Park Service, the Bureau of Indian Affairs, and others. This process of reconciliation for expenses for various fires based on land ownership operates smoothly for the state. Depending on the fire year and the agency, the state may owe funds or may be the collector.
The Federal government also provides multiple streams of grant funding which carry varied levels of reliability. From the Department of Homeland Security, the state may apply for Fire Management Assistance Grants (FMAG) from the Federal Emergency Management Agency (FEMA) for fires that pose the risk of a major disaster. Grant approval is provided early on, with payouts provided post-fire. The state is currently still waiting for FMAG payments from previous fire seasons.
The USFS provides an annual grant through the Cooperative Forestry Assistance Act of 1978. This program provides a consolidated grant for several programs, which has ensured stable base funding of roughly $3.0 million for FFSL to pay for staff salaries as well as pass-through funding to rural fire departments. While this grant award is typically paid to Utah by the first of May, the state has not received payment this year. On June 12th, the President issued an executive order directing the Department of the Interior and the Department of Agriculture to create a separate, new agency specifically to address wildfires. At present, it’s unclear when or if the Cooperative Forestry Assistance grant will resume.
While the federal side of the equation currently provides uncertainty, the state budget for preventing, preparing, fighting, and cleaning up wildfires has never burned brighter.
Pioneering Prosperity: Utah's Framework for Stabilizing Education Funding
While our Grandma's legendary two-year supply of emergency rations might be more rice and beans than legislative genius, this Pioneer Day we're digging into a different kind of foresight: the Legislature’s plan to steady the public education budget during difficult economic times. Developed in 2020, this plan (titled the Public Education Funding Framework) includes three primary components:
- Maintain the system by funding student enrollment growth,
- Adjust the system for increased costs using an inflationary factor, and
- Stabilize the system by saving for a future economic downturn.
All three components work together to support the public education budget. This article focuses on the third element: the Public Education Economic Stabilization Restricted Account.
What is the Public Education Economic Stabilization Account?
This account was developed as a “working rainy day fund” dedicated for public education. In statute, UCA 53F-9-204 provides that the Legislature will set aside 15 percent of the ongoing revenue growth to the Income Tax Fund (ITF) and Uniform School Fund (USF) in the stabilization account. Saving ongoing revenue provides the resources necessary for the Legislature to pay the ongoing costs of the first two components of the Funding Framework, namely, student enrollment growth and cost inflation.
In prior economic downturns, student growth and inflation were not consistently funded. This lengthened the time necessary for the public education budget to rebound. Setting aside ongoing funding for these elements ahead of a downturn provides stable revenue sources to pay for growth and inflation in lean years and provides a higher base to grow from when the economy rebounds.
Chart A shows a scenario used during the 2020 General Session to show the concept of funding stabilization. The dark blue line shows actual Minimum School Program (MSP) spending from FY 2000 to FY 2020. The pre-recession budget “peaks” are seen in FY 2002 and FY 2008, with the subsequent budget “valley” following each recession. Following the great recession of 2008, it took approximately 5 years for the MSP budget to recover and up to 10 years when factoring for student growth and inflation costs.
The light orange line shows the impact if the Funding Framework was in place. This shows a smoothing of the “peaks” and “valleys” over time. The scenario assumes that budget increases are lower in healthy years due to saving ongoing funding in the restricted account. The decreases are also less severe due to spending the savings during the recession.
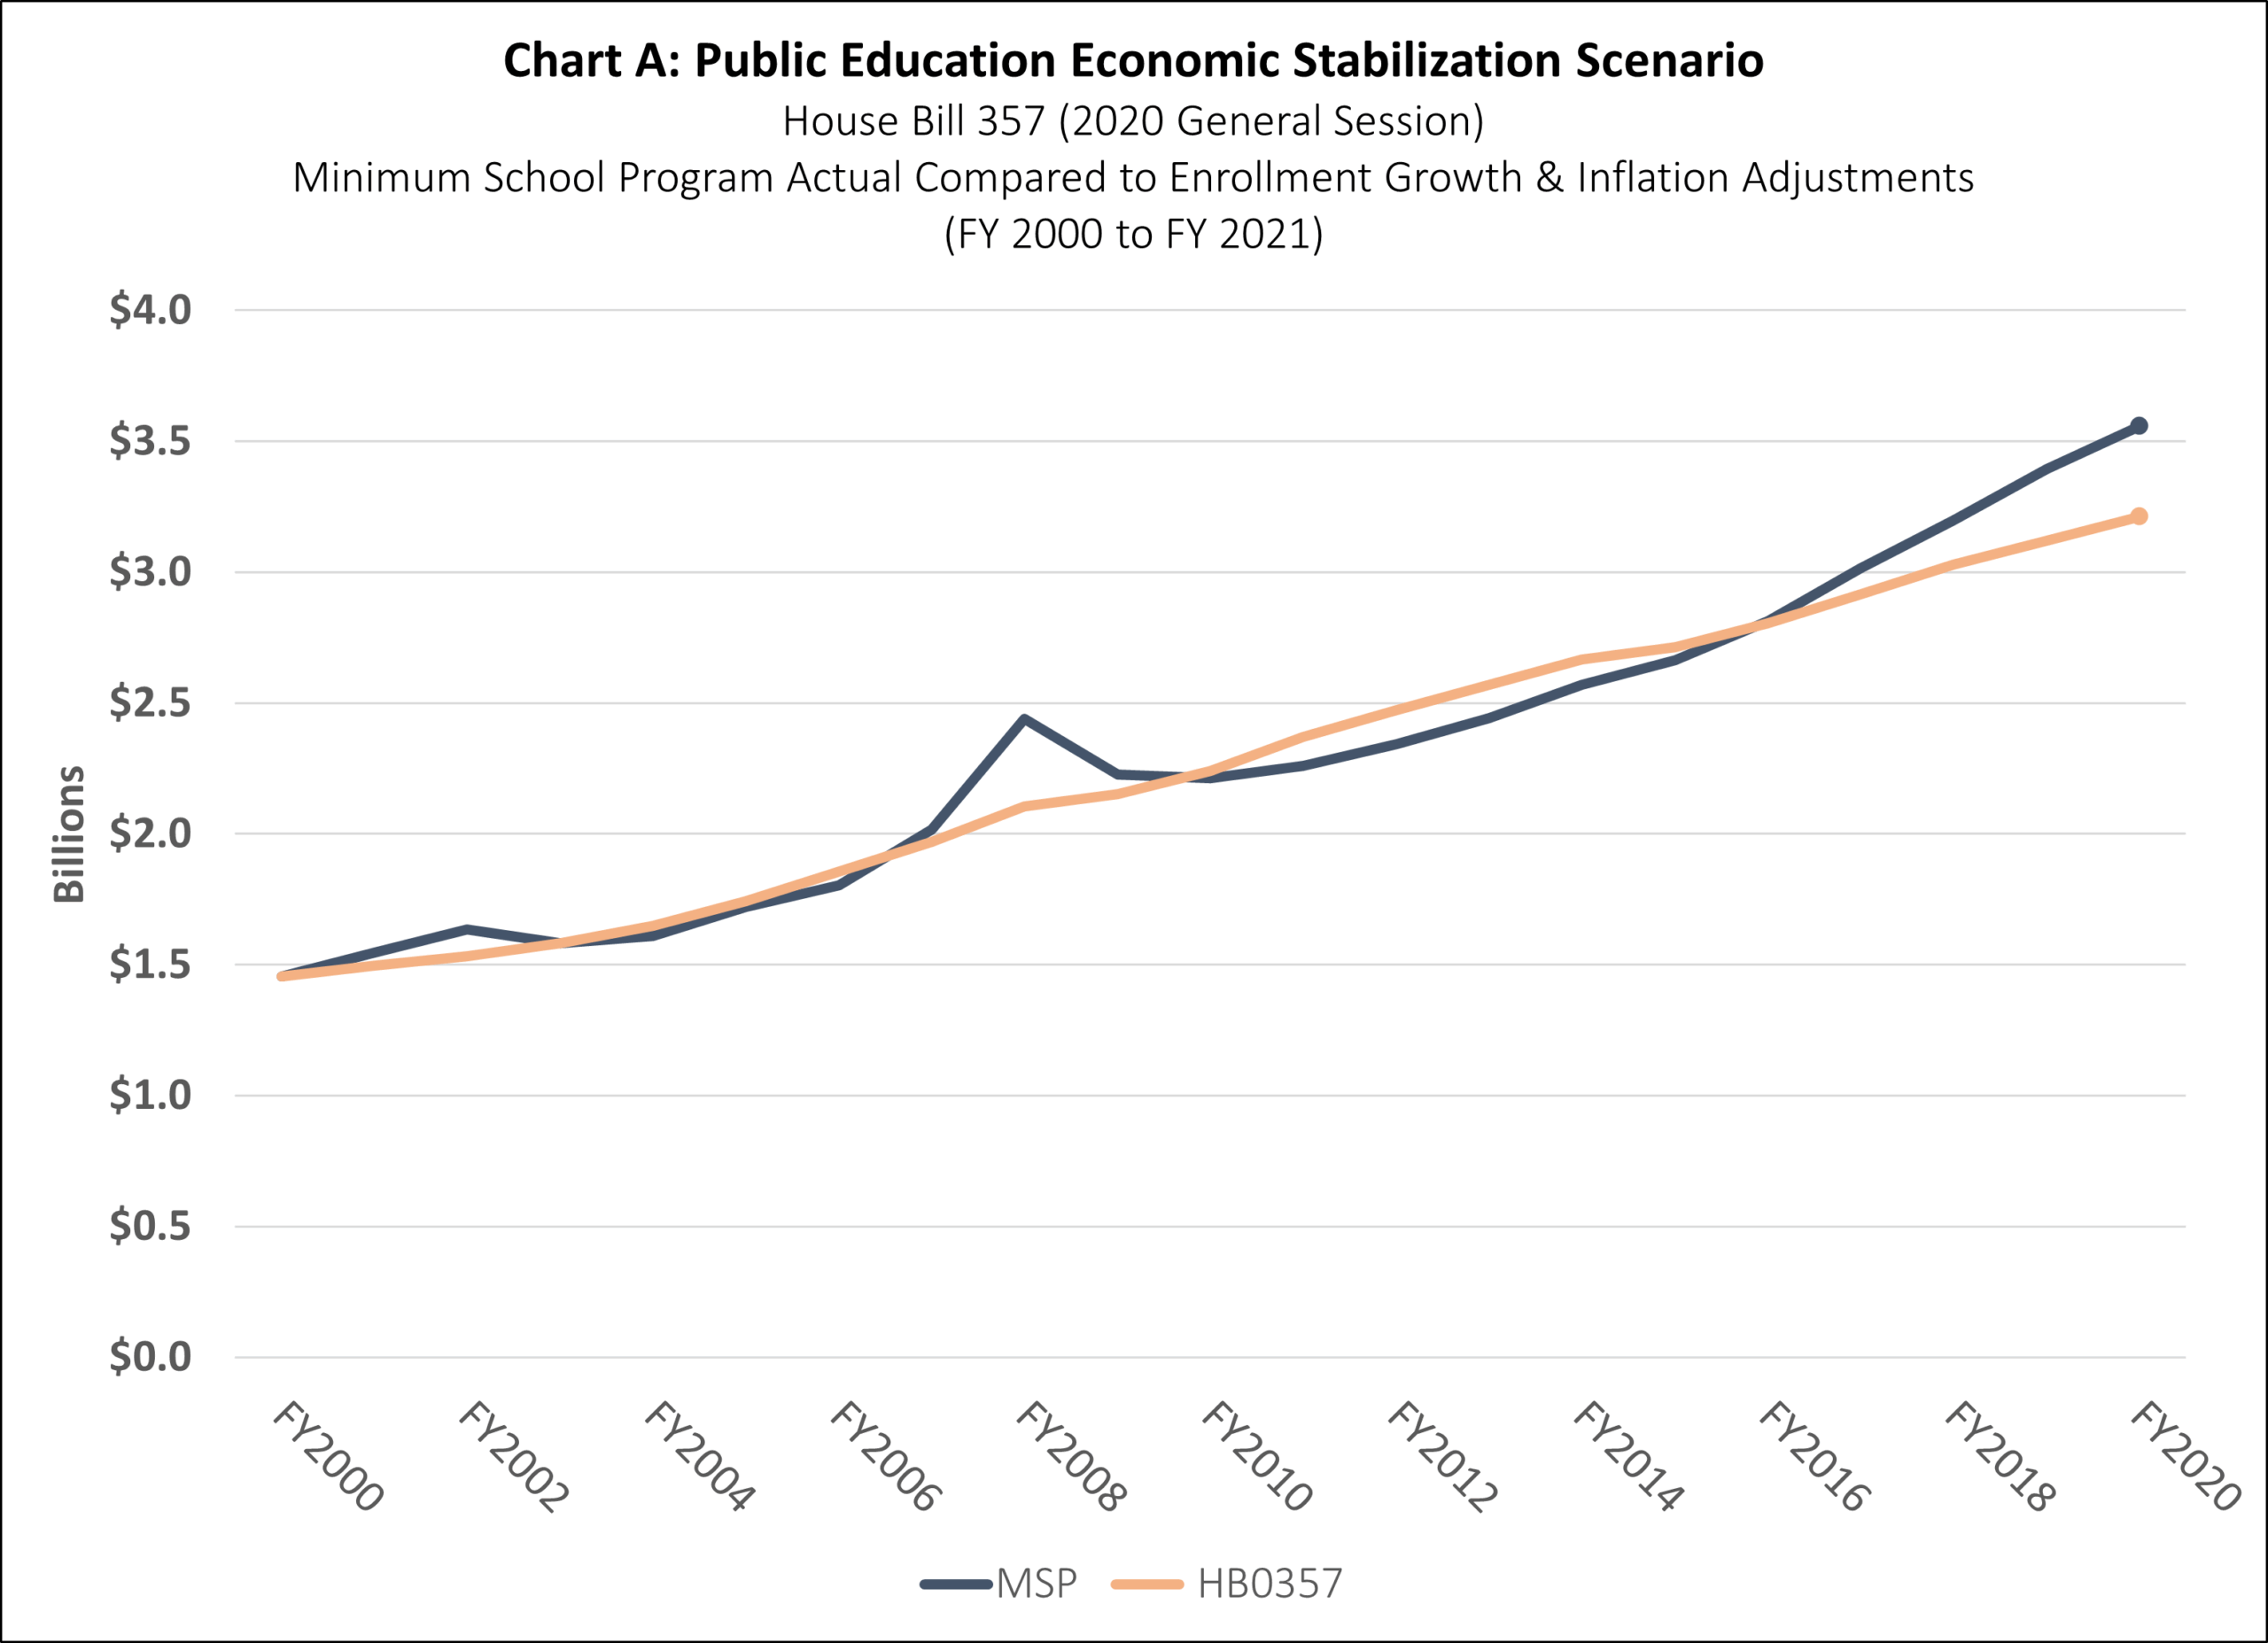
Statute also includes a savings limit for the Stabilization Account. Funding in the account can grow until it reaches 11 percent of USF appropriations for the Minimum School Program. In FY 2026, this appropriation totals $4.7 billion making the Stabilization Account limit approximately $521.6 million.
Chart B shows the funding history of the Stabilization Account since it was first funded in FY 2022. The balance in the program grew quickly to the current balance of $440.6 million due to strong economic growth in the past several years. The Legislature did not make the annual deposit into the account in FY 2025 ($40.9 million) and FY 2026 ($51.4 million). Instead, the Legislature used the funding to support other priorities in the public education budget in each fiscal year.
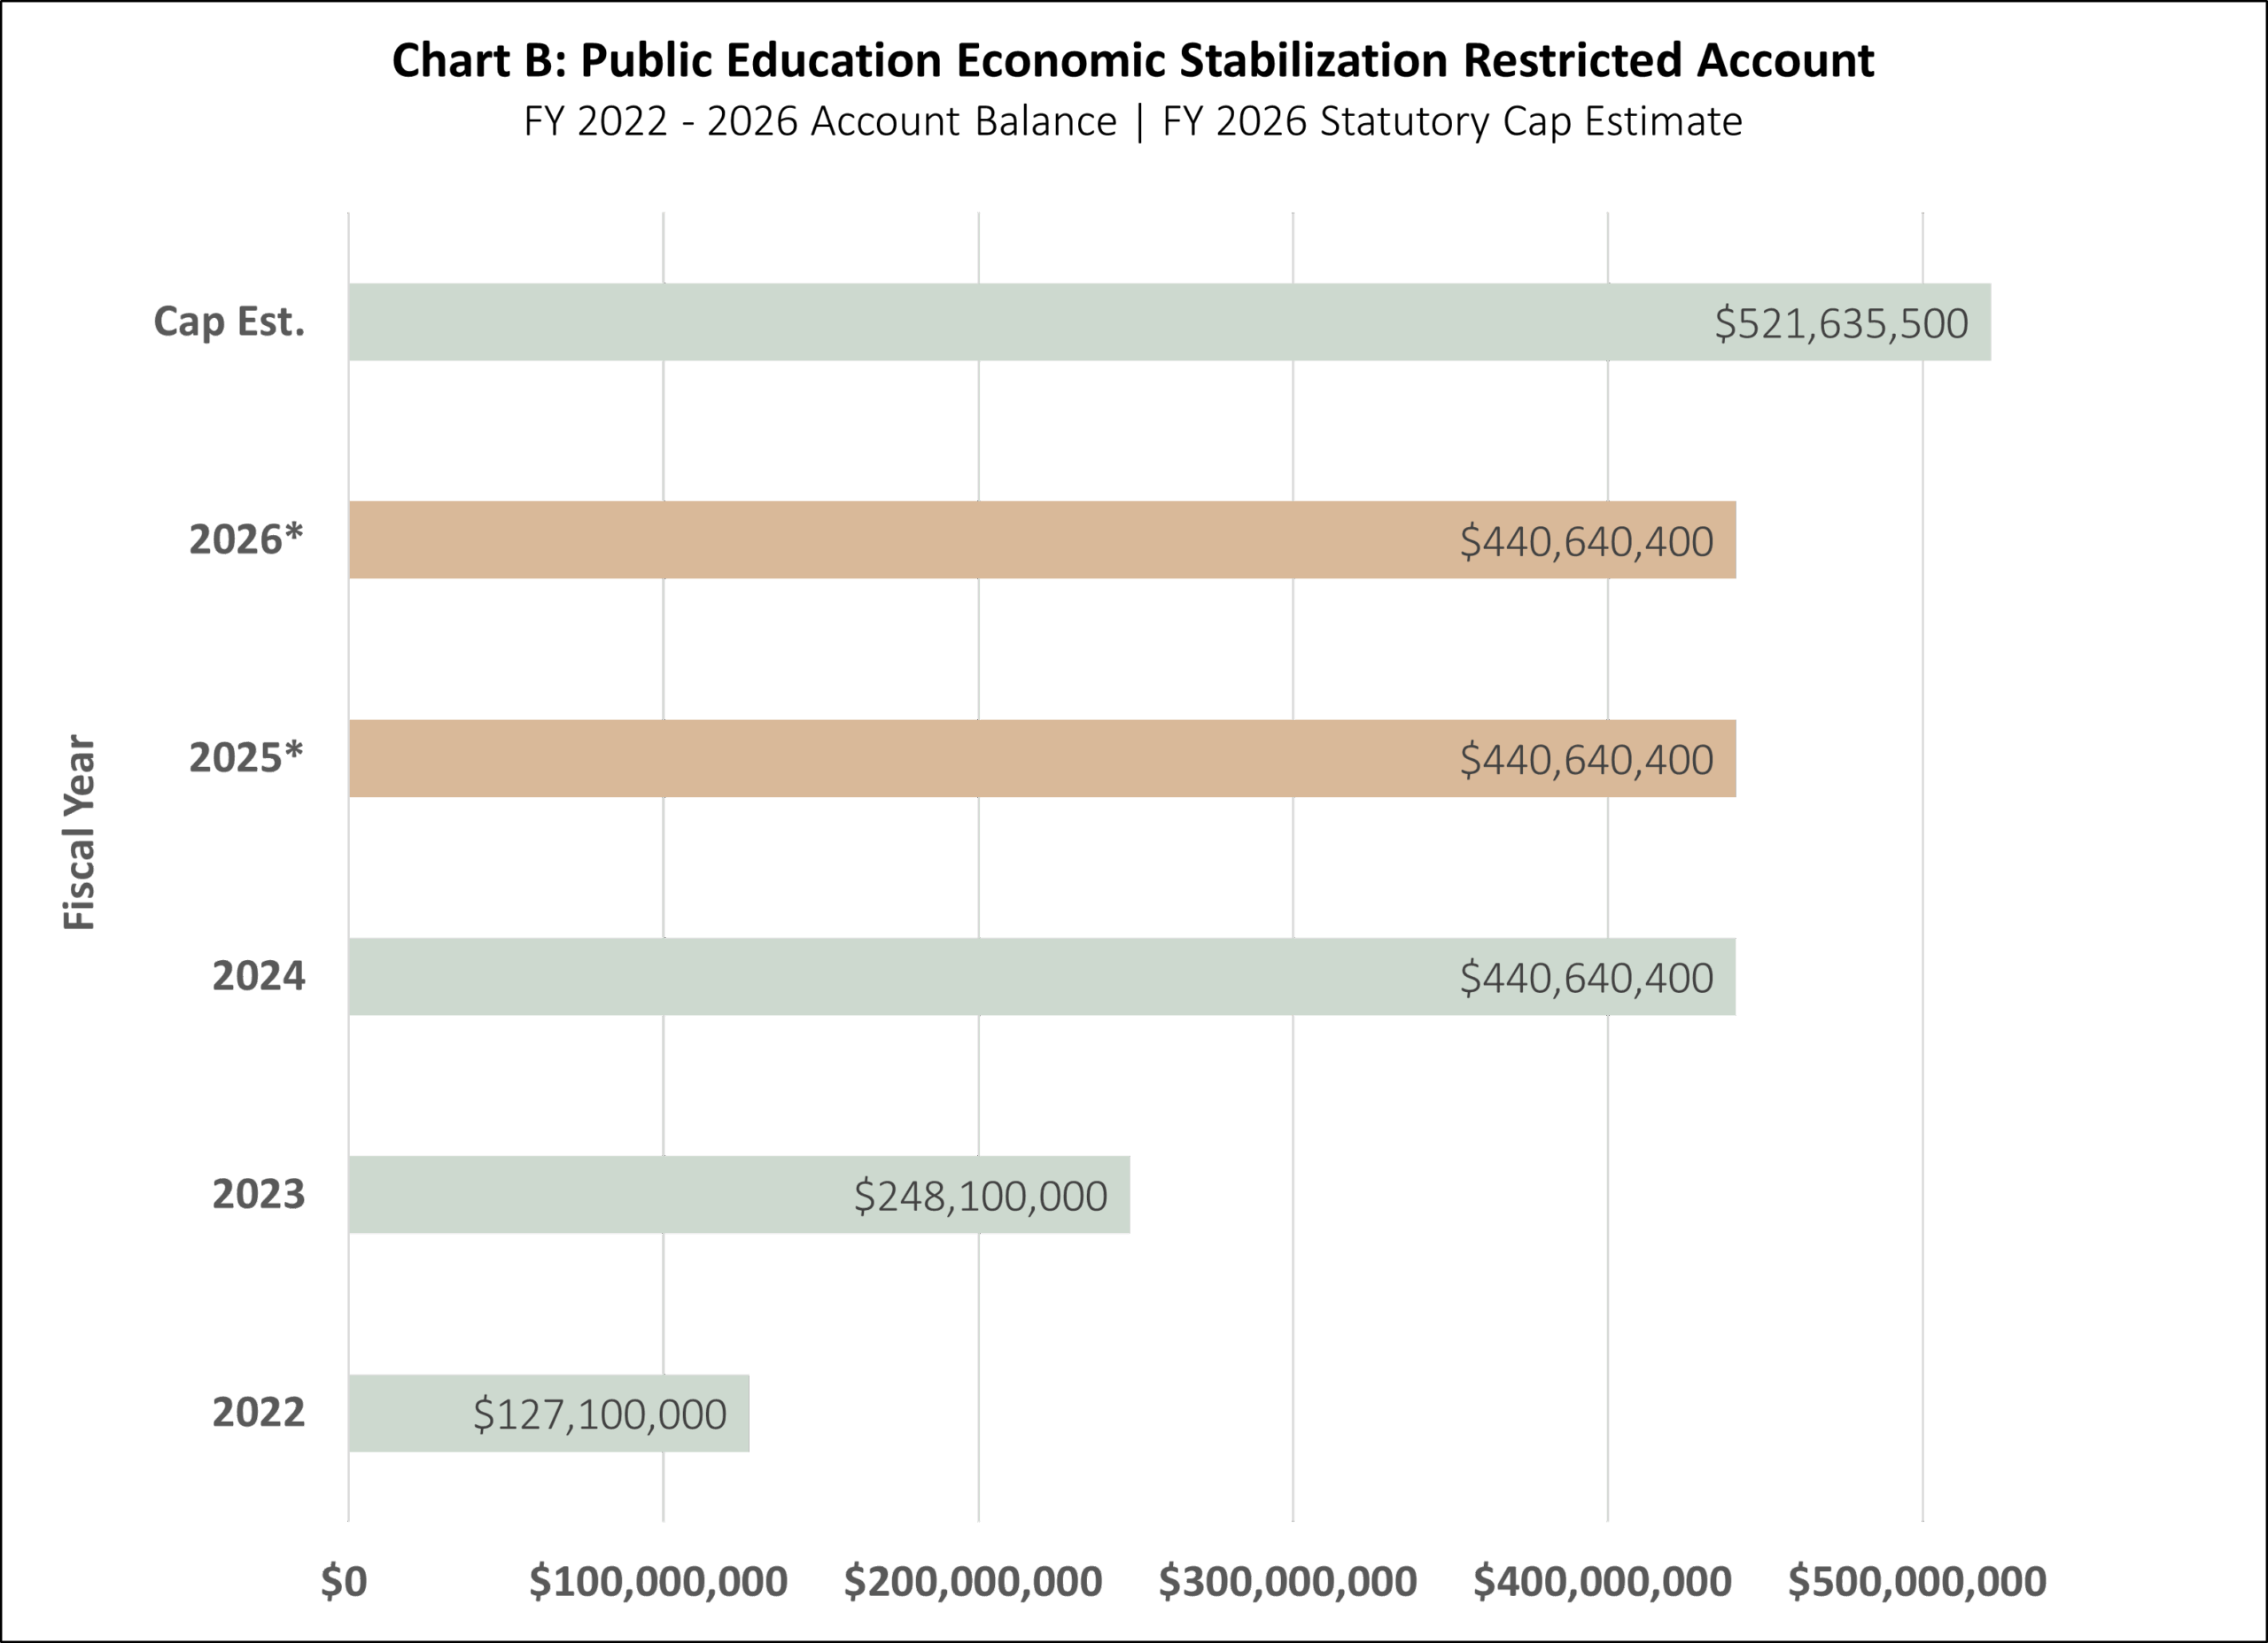
How can Stabilization Account funding be used?
Statute outlines how the Legislature can use funding within the Stabilization Account for both ongoing and one-time uses. The ongoing balance can be used by the Legislature when ITF and USF revenue is insufficient to fund:
- Ongoing appropriations to the public education system,
- Fund student enrollment growth and inflation estimates as defined in statute, and
- Support local property tax collections when collections from the Minimum Basic Tax Rate are insufficient to generate the amount of local contribution to the Minimum School Program.
In a year when the ongoing funding is not needed to fund these authorized uses, the Legislature can make one-time appropriations to the public education system from the account.
How has the Stabilization Account impacted the Public Education budget?
Luckily, Utah hasn’t experienced an economic downturn since the creation of the Stabilization Account to test the Public Education Funding Framework concepts. However, the account, and the one-time expenditures made because of the ongoing account balance, has significantly changed how the public education system is funded in Utah.
The infusion of approximately $440.6 million in one-time funds into the budget each year has allowed for significant expenditures that may not otherwise occur. The Legislature has made one-time appropriations to roughly 25 programs in each of the past three fiscal years. Major appropriations from the account include:
- $64.0 - $77.7 million each year to support additional professional time for educators;
- $12.5 - $80.0 million each year to provide grants to help small rural school districts renovate and build schools;
- $45.2 - $121.0 million in two fiscal years to provide bonuses to educators and school-based education support professionals;
- $91.5 million in FY 2023 to provide grants to school districts and charter schools for capital and technology needs;
- $25.0 - $100.0 million in each of the past three fiscal years to support school safety changes in public schools;
- $101.1 million in FY 2025 to create a captive insurance pool for school facilities, lowering insurance costs for the public education system; and
- $94.0 million in FY 2026 to enhance career and technical education programs through Catalyst Center and First Credential grants.
These programs represent a small number of the total one-time public education programs funded by the Legislature in the past five years. Check out this link to see a visual chart describing all of the funding items provided by the account since FY 2023.
Much like the dozens of jarred preserves in our aunt’s cold storage, the underlying purpose of the Public Education Economic Stabilization Account has yet to be tested. Still, the one-time uses made possible by the creation of the account have dramatically changed funding available for public schools in Utah.
Foundational Funding: The Rebuilding of Higher Education Capital Requests
As students and faculty return to campuses across Utah, a quiet revolution is underway in how the state funds and builds its higher education facilities. Since 2019, Utah has shifted from a reactive, year-to-year funding model to a strategic, forward-thinking approach that provides a stable financial foundation for capital projects. This change, initiated by Senate Bill 102 (2019 General Session), has given institutions the predictability they need to plan for the future, ensuring that buildings and infrastructure keep pace with the state's growing educational needs.
The Blue Print
Before 2019, higher education institutions would submit capital facility proposals to the Building Board and the Legislature each year, hoping for a green light. This process often led to uncertainty, making it difficult for schools to plan for major expansions or renovations. The outcome of each legislative session determined whether a project would move forward, leaving institutions with little ability to budget for long-term construction plans.
Passed during the 2019 General Session, S.B. 102, "Higher Education Capital Facilities," fundamentally changed this process. The bill established a dedicated funding stream for capital projects, ensuring a stable source of revenue that institutions could rely on. This legislation created two new dedicated funds: the Higher Education Capital Project Fund and the Technical Colleges Capital Projects Fund.
The Utah Board of Higher Education is responsible for distributing these funds based on a set of objective criteria designed to reward performance and address the most pressing needs. These criteria include:
- Enrollment: The number of students at an institution.
- Performance Metrics: The institution's overall performance as described in Utah Code 53B-7-706.
- Projected Growth: The anticipated increase in the student population.
- Square Feet per Student: The existing space available per full-time student equivalent.
- Facility Age and Condition: The age and state of existing buildings.
- Space Utilization: How efficiently academic and off-campus facilities are being used.
S.B. 102 also introduced a new classification system for projects:
- Dedicated Projects: These are projects funded by the new dedicated capital project funds. Institutions receive an allocation and can use these funds to either build new facilities or save the money over time to fund a larger project in the future.
- Nondedicated Projects: These projects request or use state funds from a source other than the dedicated capital project funds. Nondedicated projects can also be funded through a combination of sources, including donations, federal funds, and other state appropriations.
In addition to these categories, some projects—typically those for housing or parking—are funded through a third path: the use of bond proceeds. In these cases, the institution uses revenue generated from user fees (e.g., rent or parking fees) to pay off the bonds.
The Budget
One of the most significant benefits of the dedicated funding model is its transparency and predictability. These ongoing amounts were established in the 2021 General Session through intent language included S.B. 3, "Appropriations Adjustments" (Item 332), which promised a total of $120 million for higher education capital projects starting in FY 2023, contingent on revenue projections.
The most recent legislative session, however, saw a slight reduction in these amounts. For Fiscal Year (FY) 2026, the legislature appropriated $95.6 million to the Higher Education Capital Project Fund and $17.9 million to the Technical Colleges Capital Projects Fund ($6.5 million reduction from FY 2025). This reduction is a direct result of the projected revenue forecast for the upcoming fiscal year.
Even with this slight decrease, the new funding model provides a clear picture of how funds are allocated. For degree-granting institutions, the funds are distributed according to the criteria outlined in S.B. 102, while technical colleges receive funds based on projects they submit for review and approval by the Utah Board of Higher Education.
The Build-Out
The chart below describes how the dedicated funds were allocated to degree-granting institutions for FY 2026 and how those allocations, combined with existing balances and approved projects, impact each school's overall capital budget.

As seen in the table, the new system allows institutions to "bank" their allocations, accumulating funds over several years to support major construction projects. This long-term planning ability is a key feature of the new model.
During the 2025 General Session, the Legislature approved a total of 12 dedicated and nondedicated projects across eight campuses. In addition to construction funding, ongoing Operations and Maintenance (O&M) funding was appropriated for five of the approved projects. These funds will be used to support the day-to-day operations of the new buildings once they are completed. The table below describes the projects greenlighted in the 2025 General Session:
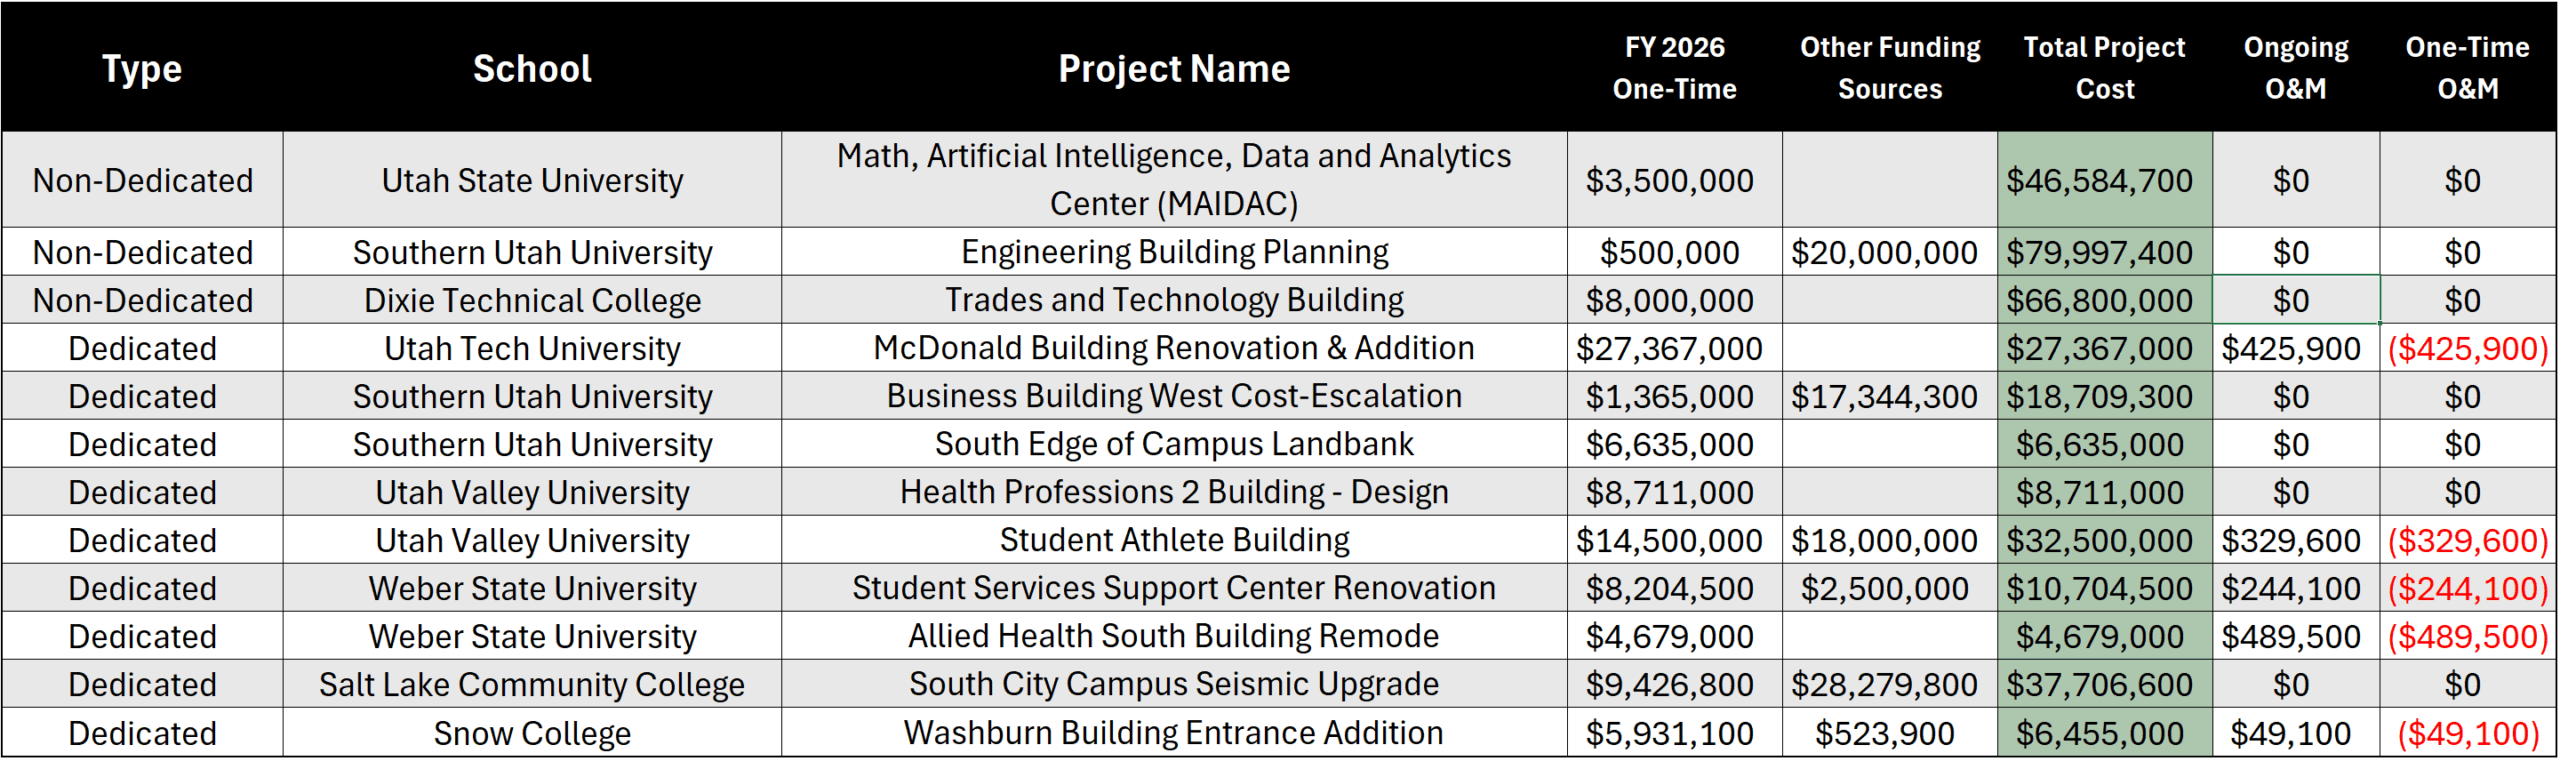
Details on project size, scope, costs, and funding sources available in the Division of Facilities Construction and Management (DFCM) 5-Year Construction Plan Book.
The passage of S.B. 102 has created a sustainable and predictable framework for funding higher education capital investments in Utah, which is also flexible enough to allow legislators to consider current revenue projections. By tying funding allocations to objective performance and demographic metrics, the Legislature has not only provided institutions with the tools to plan for the future but also created incentives for schools to meet their core missions. This innovative approach ensures that as Utah's population and economy continue to grow, the state's higher education infrastructure will be ready to support the next generation of students.
Oh, SNAP! How the One Big Beautiful Bill Act Impacts Utah's Nutrition Assistance Budget
The recently federally enacted "One Big Beautiful Bill Act" (H.R. 1) is set to create fiscal impacts for the state of Utah and could lead to future financial responsibilities related to the Supplemental Nutrition Assistance Program (SNAP). This new legislation changes the funding structure for both the administrative costs and the benefits provided through the program.
Changes to Administrative Costs
H.R. 1 modifies the match rate for SNAP administrative costs. Previously, the state and federal government split these costs with a 50/50 match rate. The new law, effective in Fiscal Year (FY) 2027, shifts this responsibility, requiring Utah to pay 75% of administrative costs while the federal share drops to 25%. Based on past administrative costs, this change is projected to increase Utah's ongoing burden by approximately $13 million annually.
Potential Changes to Benefit Costs
The cost of SNAP benefits, which were previously 100% federally funded, is also changing. H.R. 1 introduces a requirement for the state to contribute to benefit costs if its payment error rate exceeds a certain threshold. According to the USDA, Utah's 2024 error rate was 5.74%, primarily due to overpayments. However, if the error rate were to increase to 6% or more, Utah would be required to contribute to the cost of benefits, increasing Utah's share by $20 million. It's crucial for the state to maintain this low error rate to avoid these new costs. This change will go into effect in FY 2028.
Other Provisions in H.R. 1
Beyond funding, H.R. 1 includes other provisions that will affect Utah's SNAP program:
- Changes for Able Bodied Adults Without Dependents (ABAWDs): The work requirement for this group is increasing from ages 18-54 to 18-64. It also narrows the work requirement exemption for caregivers and parents by lowering the age of a "dependent child" from under 18 years to 14 years. DWS will need to update its eligibility system and provide staff support to eligible individuals.
- Low Income Home Energy Assistance Program (LIHEAP) Payments: The new law restricts how LIHEAP payments of $20 or more can be used to qualify for the standard utility allowance, which may affect the benefit amounts for some SNAP recipients. It also prohibits using household internet costs in the shelter expense deduction.
- Expiration of SNAP-Ed: The National Education and Obesity Prevention Grant Program, known as SNAP-Ed, will expire after FY 2025. DWS will no longer contract with Utah State University for these services.
- Citizenship Requirements for SNAP benefits: These requirements have changed for individuals residing in the United States. This change will likely result in some individuals currently eligible possibly losing SNAP eligibility. DWS will need to make one-time changes to the eligibility enterprise system and evaluate those whose eligibility for SNAP may be impacted.
An issue brief detailing these impacts and more is available here: Oh SNAP! How Much is That Going to Cost?
Power of PIDs: A Look at Utah's Public Infrastructure Districts
Public Infrastructure Districts (PIDs) are limited purpose local government entities which can be created by cities, counties or other political subdivisions to facilitate the development of infrastructure for public benefit as outlined in UAC Title 17D, Chapter 4. Initially authorized by S.B. 228, “Public Infrastructure District Act” in the 2019 General Session, these districts can be useful tools for local government entities to better leverage their existing resources in pursuit of delivering more or better services to their residents. This post provides a general overview of PIDs and how they are distributed in the state.
Once created, a PID generally pays for projects via tax increment financing on the property tax base contained within its borders. More specifically, a PID will issue bonds to pay for infrastructure investments and then will capture revenue resulting from the increase in property values to pay back the bonds it issued. In this way, these districts can be a mechanism to fund publicly beneficial investments by relying on the future value of those investments rather than diverting existing funding streams.
The size of PIDs in Utah vary both geographically and financially. Since the borders of these districts are ultimately set by the creating entity, they can range in size from a few city blocks to several thousand acres. Not surprisingly, the total property value that a PID contains also varies widely. Measuring the potential value of each district is further complicated by the fact that these districts are created explicitly to develop the areas within their boundaries. As such, the property value at creation will be substantially different than the value a PID eventually utilizes as its tax base. Each district also includes a unique maximum taxing authority included in the incorporation documents approved by the creating entity and filed with the Lieutenant Governor.
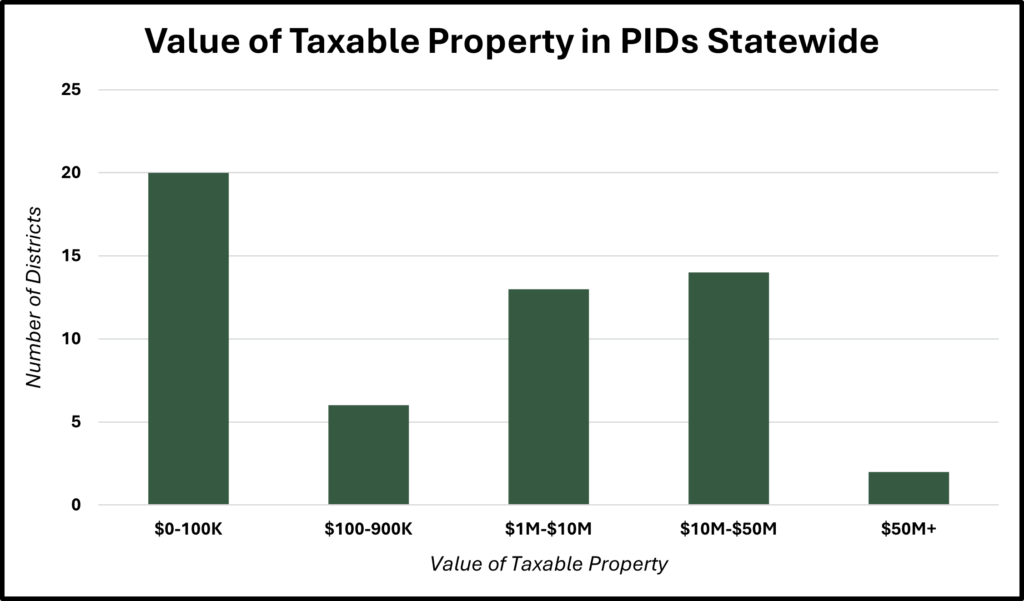
For the 2024 tax year, there were approximately 70 PIDs across the state. These districts fund the construction of various kinds of public infrastructure including roadways, utilities, buildings, parks, improvements to existing infrastructure, etc. In that tax year, the largest PID was the ‘Downtown East Streetcar Sewer’ PID in Salt Lake City which included over $60 million of taxable property. The state’s smallest public infrastructure districts include less than a few thousand dollars of currently taxable property. In terms of distribution, 60% are concentrated in Tooele and Washington Counties.
Below is a map showing several existing PIDs within Washington county. Of these, the Gateway at Sand Hollow PIDs are a good example of how these districts are typically set up. Originally created in 2021, this collection of 3 PIDs covering roughly 2,300 acres was created by the Hurricane City Council to develop a set of roadways, bike paths, and parks to support the development of a residential community in the area. When created, the districts were limited to a maximum bonding capacity of $75 million to finance these projects. Once its purpose is sufficiently accomplished, the districts will dissolve following the repayment or discharge of any outstanding bonds. This collection of bordering PIDs also includes a 'doughnut hole' carve out. State statute provides narrow situations where public infrastructure districts are allowed to be created without consent of 100% of surface property owners within the district boundaries.
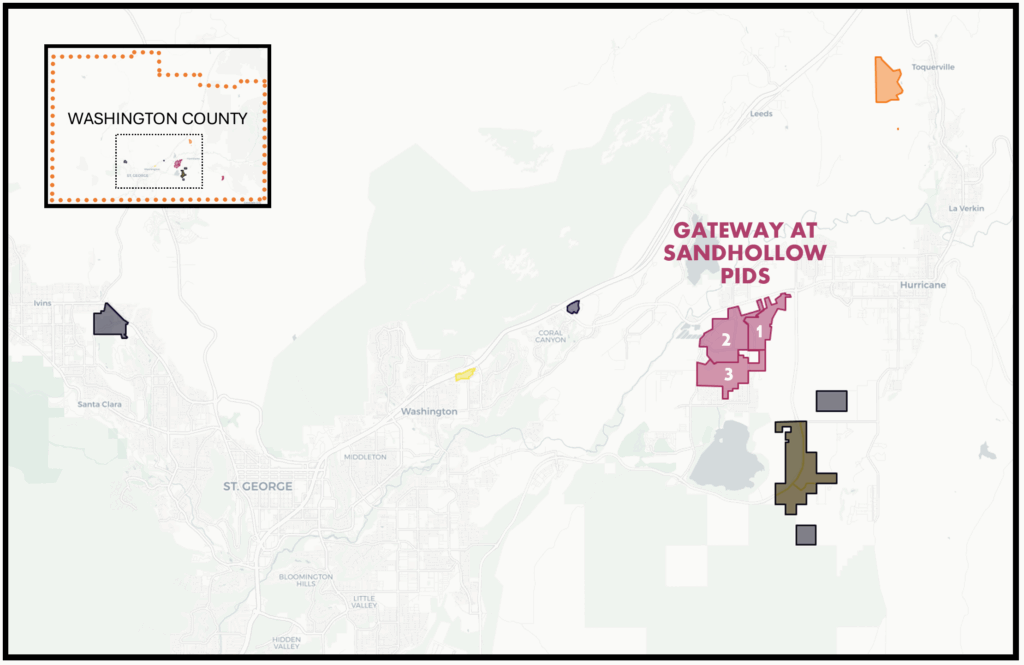
Creating entities might decide to divide PIDs, creating multiple entities, for a variety of reasons including individualized projects and development timelines associated with differentiated tax rates. There may also be geographic reasons for creating multiple areas or districts related to existing tax entities or legal property boundaries.
While the basic structure and power of PIDs are prescribed in state statute, the specifics around what a PID is tasked with developing, how it is to be administer, limits on its bonding capacity/term, dissolution conditions, etc. are all individually laid out in the incorporation documents. Necessarily, the requirements and goals imposed by the creating entity are stricter than those provided in statute. Given that PIDs are designed to be flexible, it falls to the local government creating the PID to structure it in such a way as to ensure the efficient and effective utilization of taxpayer resources. This might include setting explicit limits on bonding terms, tax rates, creating reporting requirements.
As a relatively recent development tool, the long-term impact on community growth and financial stability for PIDs remains to be fully seen. While these districts offer a promising method for funding essential infrastructure without relying on traditional municipal budgets, their widespread adoption and performance will be a key area to watch in the coming years. To assist with this, the Legislative Fiscal Analyst is developing an interactive mapping tool for taxing entities (including PIDs), expected to launch in 2026. Relying on information from the Tax Commission, this tool will provide a one-stop-shop for legislators and the public to access the most up to date information about Public Infrastructure Districts across the state.
Utah’s Division of Services for People with Disabilities: Understanding the Waitlist
The Utah Division of Services for People with Disabilities (DSPD) provides a variety of supports to help people with disabilities live more independently and participate fully in their communities. These supports are designed to meet the unique needs of each individual. Some people require around-the-clock care, while others may only need a few hours of assistance each week to remain independent. Services can include help with daily living tasks, supported employment, day programs, or respite care for family members.
Currently, over 7,000 Utahns receive DSPD services. The impact of these services is significant. For families caring for loved ones with disabilities, the support provides essential relief from constant caregiving responsibilities. Adults with disabilities who are able to work can access training, transportation, or other assistance that helps them enter or remain in the workforce. Individuals who might otherwise feel socially isolated have opportunities to connect with peers and participate in meaningful activities in their communities. In essence, DSPD services help people with disabilities live fuller, more independent lives.
Context for the Waitlist
The presence of a waitlist exists because the demand for services exceeds the resources available at any given time. In theory, even with additional legislative funding the waitlist won’t disappear entirely. Families who delayed applying for services due to uncertainty, lengthy processes, or concerns about availability would be likely to come forward, increasing the number of individuals seeking services. Population growth, increased awareness of available services, and changes in family circumstances all contribute to a steady stream of new applicants. This means that while the waitlist can be reduced, it is unlikely to disappear entirely.
The waitlist also allows DSPD to prioritize services for individuals with the greatest needs. People in urgent situations, those with critical health or safety concerns, or those at risk of losing family support are served first. Because of this priority system, individuals may find themselves higher or lower on the list at any given time, based on the characteristics and needs of others currently waiting.
Funding the Waitlist
Despite the substantial number of individuals currently receiving services, demand far exceeds the capacity of the system. In addition to the 7,157 people actively receiving support, another 5,345 individuals are on the waitlist for services. Addressing the needs of individuals currently on the waitlist would require an additional $74 million each year. However, the waitlist only represents part of the overall need. DSPD estimates that an additional 19,000 Utahns are eligible for services but are not yet receiving them nor are they on the waitlist. Providing support to all eligible individuals would require an estimated $241 million in ongoing funding each year.
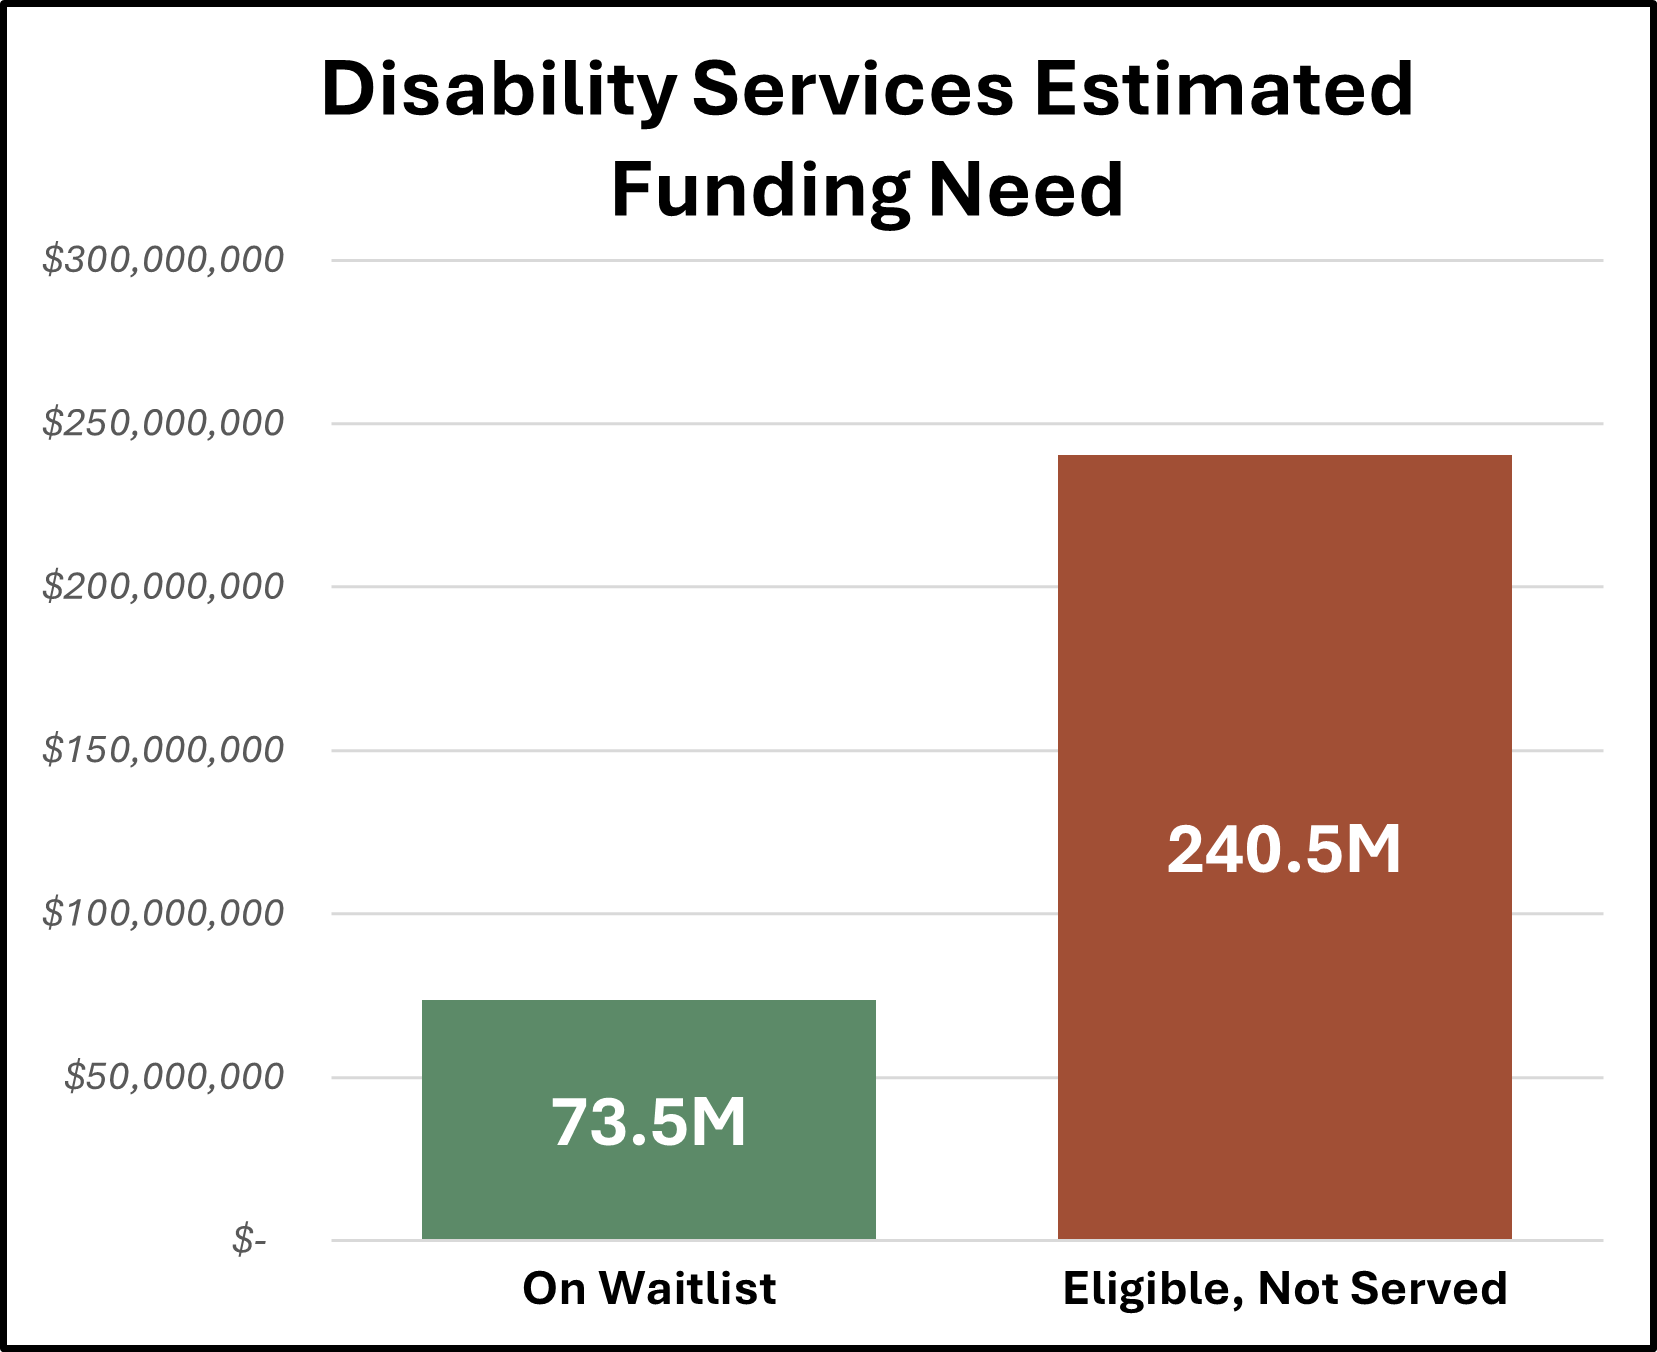
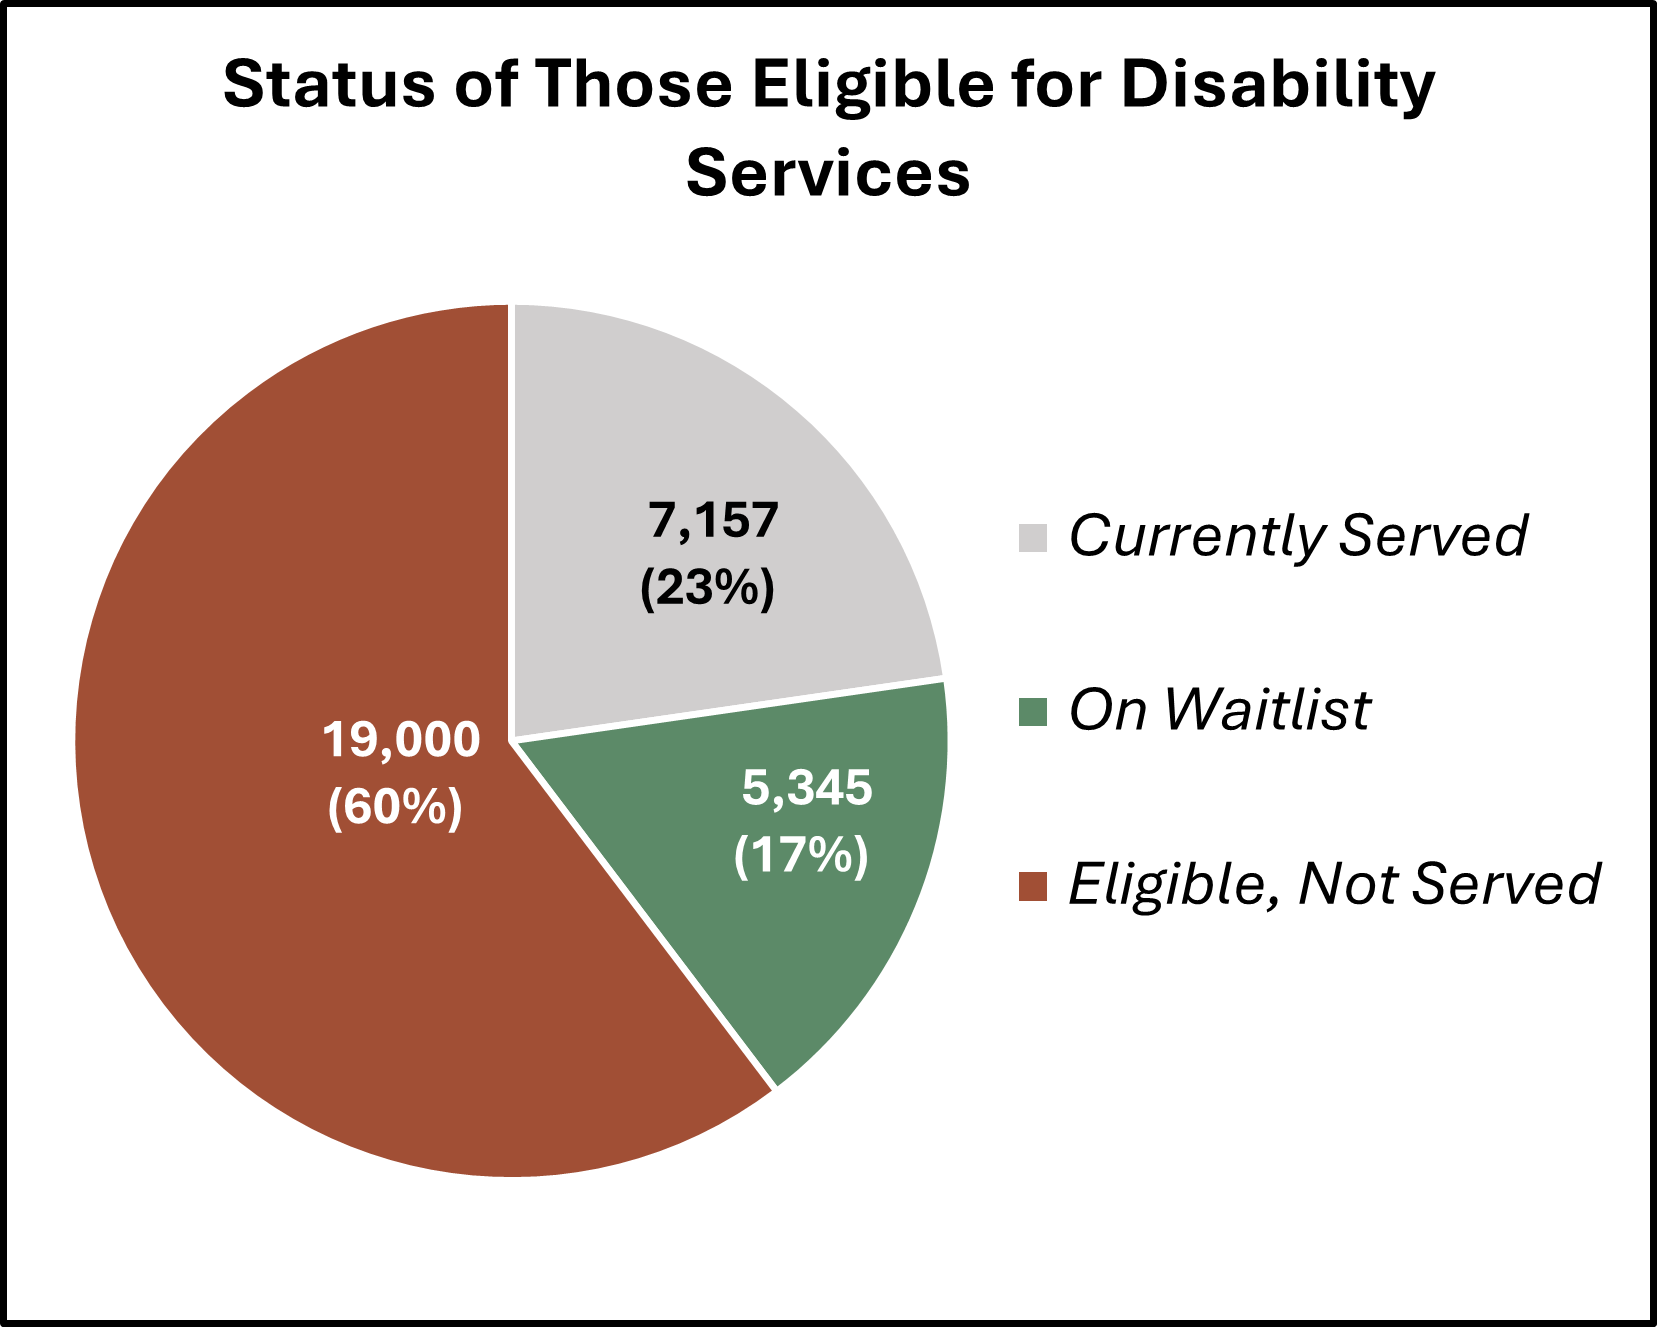
In the 2025 General Session, the Utah Legislature appropriated $6.0 million ongoing from the General Fund to DSPD to support services and help address the waitlist. This continues a pattern of incremental investments by the Legislature in recent years:
- 2024 General Session: $5 million ongoing;
- 2023 General Session: $3.0 million one-time and $3.5 million ongoing; and
- 2022 General Session: $6 million ongoing.
These appropriations represent important steps in expanding services and providing additional support to individuals and families who in some cases have waited decades to receive services. Even incremental increases can make a meaningful difference, whether by adding hours of respite care, expanding access to day programs, or helping more adults with disabilities enter the workforce. When ongoing appropriations fund moving people from the waitlist to DSPD support, federal funds are typically available as match which makes state investments go farther. While funding for the entire DSPD budget includes a mix of state and federal resources, the limited services provided to individuals on the waitlist such as short-term or emergency support are funded entirely with state dollars. In fact, in the last three Fiscal Years, DHHS spent an average of $6.5 million to provide respite or emergency services to those on the wait list.
The Price is Right: A Legislative Deep Dive into State Fees
During the legislative interim period, appropriations subcommittees engage in thorough analyses of budgetary matters that cannot be fully addressed during the General Session. These in-depth reviews are conducted as part of the Accountable Budget Process, a statutory mandate established by H.J.R. 18, “Joint Rules Resolution on Base Budgeting Provisions” (2019 General Session). Under this process, subcommittees systematically evaluate every program within the state budget over a five-year cycle.
General Government (GG), one of the newest appropriations subcommittees created by H.J.R. 23, “Joint Rules Resolution - Legislative Process Amendments” (2024 General Session), first met during the 2025 General Session. As an incipient committee, there was limited background knowledge amongst the committee members on the collective group of agencies under their purview. Consequently, there was significant interest in deeply exploring the operations of all the agencies, particularly in relation to fees. When presented with the list of fees requiring approval, several members requested additional details about each fee. Detailed information about each fee needing approval was not readily available, nor does the General Session provide sufficient time to explore each fee in depth.
To remedy this, the GG 2025 Accountable Budget Process focused on the fees and rates, aiming to evaluate the fee approval process and propose recommendations for ensuring legislators have sufficient detail in their decision making process.
Background on State Fees
In Fiscal Year 2024, more than 1,800 fees and rates charged by state agencies generated an estimated $473 million in revenue. All appropriations subcommittees oversee fees, but the quantity overseen by GG is the largest, due in part to the number of fees (or rates) charged by the state Internal Service Funds (ISF). The subcommittee oversees about 41% of all fees statewide, with the Department of Government Operations administering seven different ISFs.
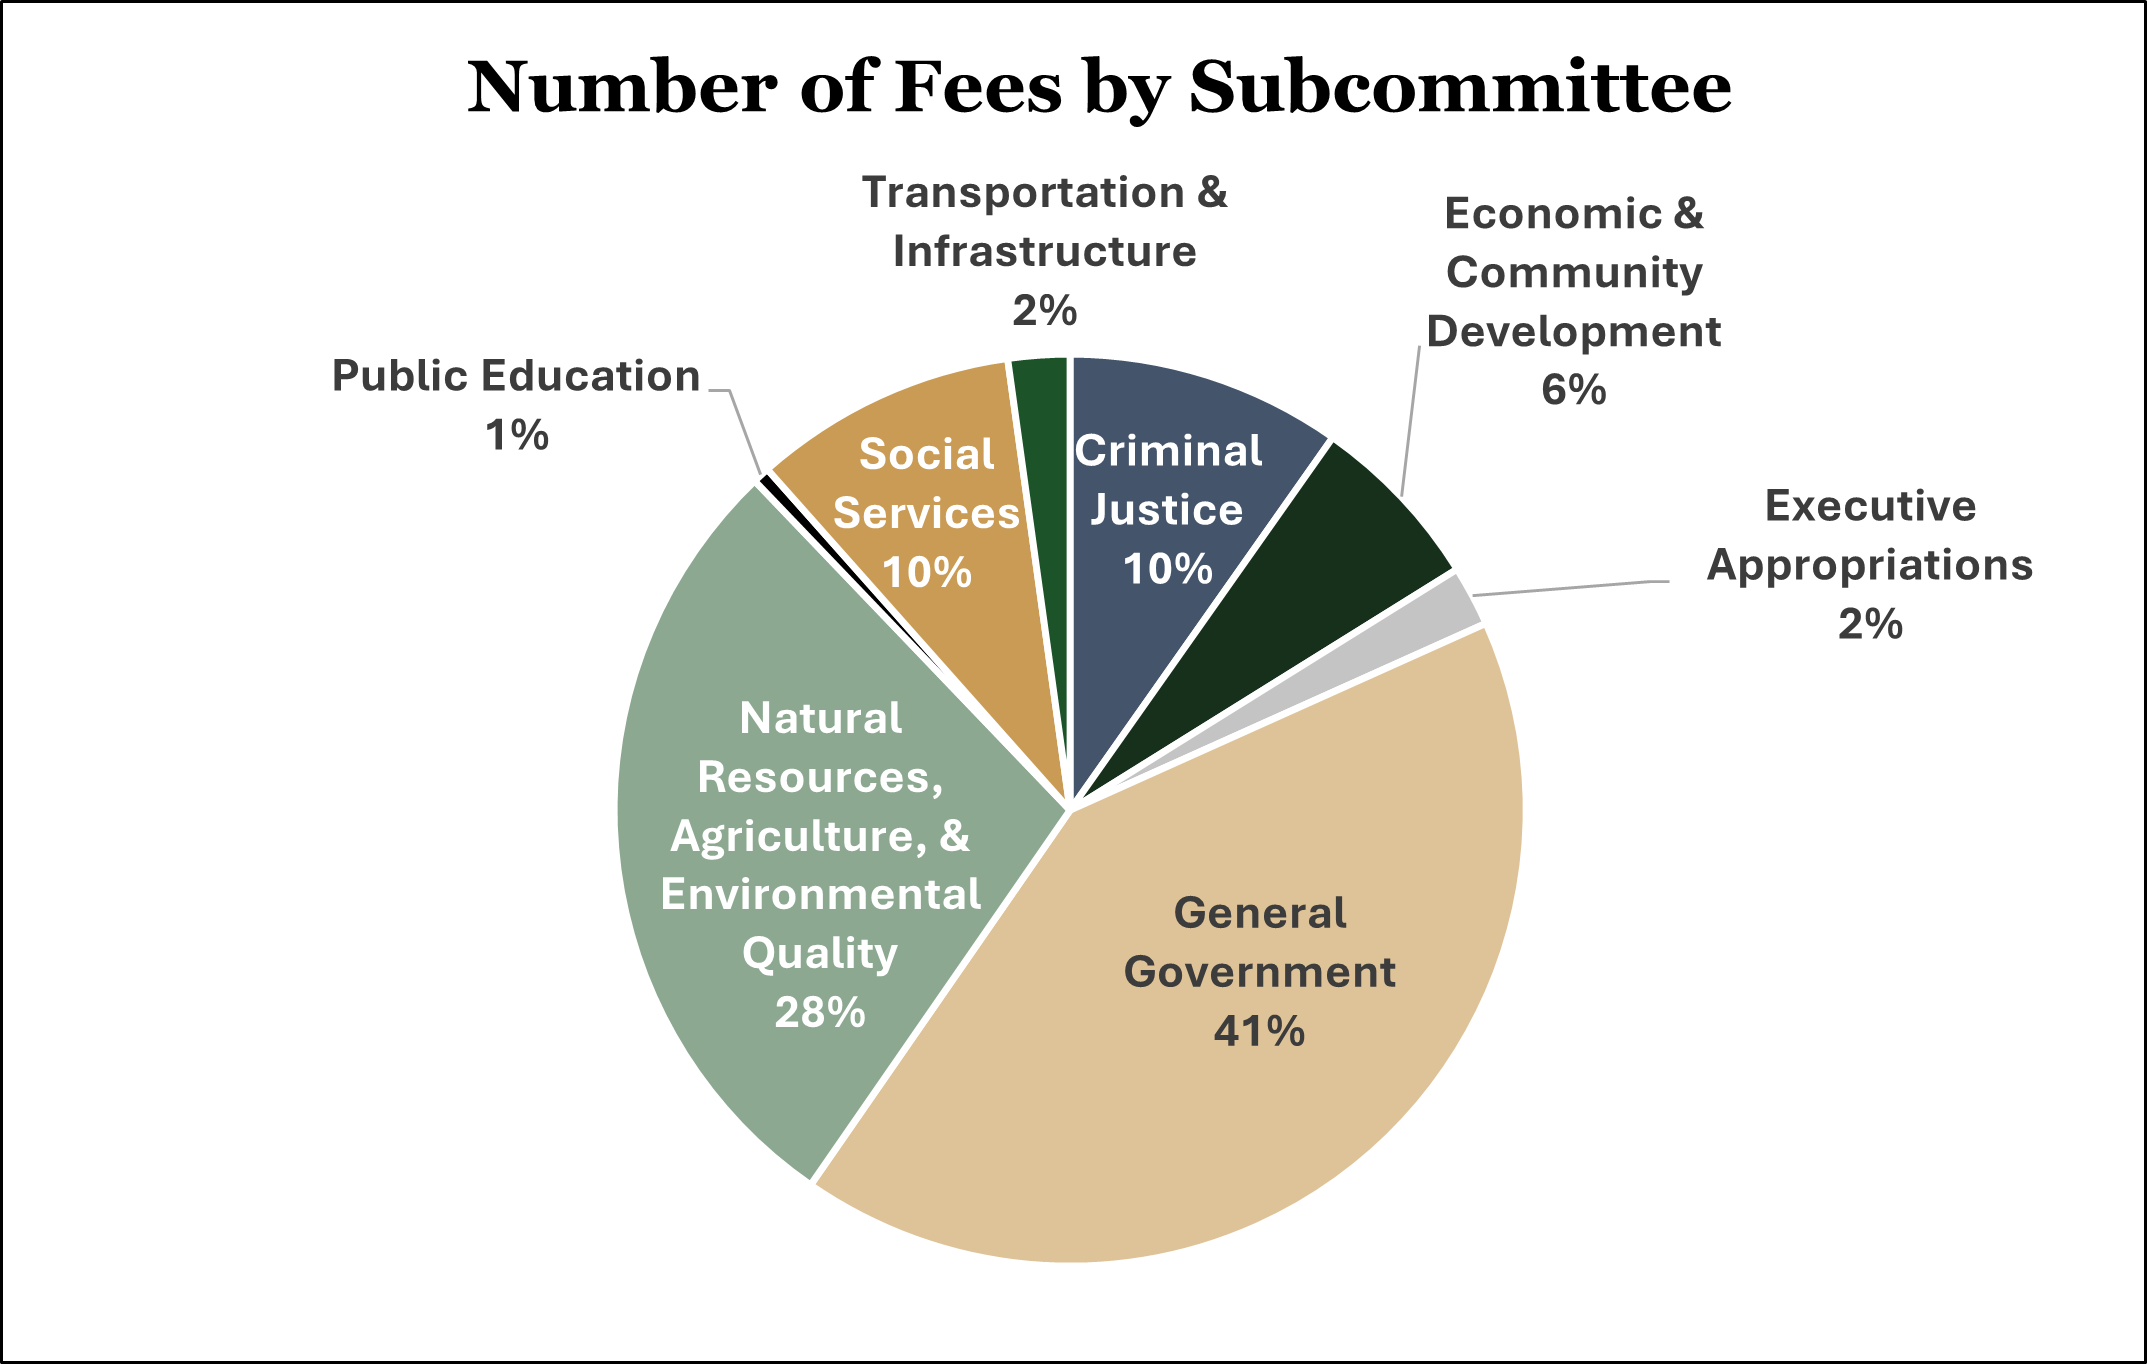
Fees generate revenue from the public, while ISF rates are internal charges for government services. Fees are categorized as service or regulatory fees, with statute requiring fees to be reasonable, fair, and based on a cost formula involving direct and indirect costs divided by expected charges.
In recent sessions, the Legislature has worked to refine the state fee and rate setting process. H.B. 383, “Agency Fee Assessment Amendments” (2022 General Session) set new data submission requirements for any new or changing fees and also defined the criteria that should be included in calculating an agency’s cost of providing a service (for which a fee is charged). S.B. 283, “Funds Amendments” (2025 General Session) allows agencies to charge a fee that is below the approved amount included in an appropriations act, after providing the notice to the Governor’s Office and the Legislative Fiscal Analyst.
Recommendations for the Fee Setting Process
The recommendations developed from the GG Accountable Budget Process aim to build upon previous policy changes and also to address several key issues that were identified during the analysis:
- Missing actual revenue data: The state does not have a reliable, centralized view of how much revenue is collected from fees and ISF rates each year. This impairs budgeting and policymaking.
- Lack of context: Legislators are not given historical data or background knowledge on each of the fees that they impose.
- Minimal review time: Fees and ISF rates often receive minimal scrutiny during the legislative process, despite their significant fiscal impact.
- Incomplete and inconsistent data submissions: Fee and ISF data are often incomplete or inconsistent, making it difficult to determine whether fees are aligned with program costs.
- Lack of comparability: Customers are unable to compare government costs to private market prices.
To address these challenges, legislative staff have proposed the following recommendations:
- Strengthen Statutory Requirements: One of the primary recommendations is to ensure that each fee and Internal Service Fund (ISF) rate includes an accurate and consistent dataset. This involves applying the same data requirements currently mandated for new or modified fees to all existing fees and ISF rates. Additionally, agencies will be required to report the actual costs and revenues of each fee and ISF rate at the end of each fiscal year. This will provide a clearer picture of the overall expenditure of the programs or services supported by these fees.
- Improve Financial Training and Tracking: To enhance financial tracking, it is recommended that agencies and ISFs start using the state accounting system to track the revenues and expenditures of their fees and rates. The Division of Finance should provide the necessary training and assistance to agencies on how to properly set up and track their fees and rates in the state accounting system.
- Replace the Current Fee System: It is recommended to replace the current fees system with a new, integrated tool that would be integrated with the state’s accounting system. This new tool would reduce the manual work for agencies’ staff and include validation checks to identify missing or inconsistent data at both the agency submission stage and during analysis by the Governor's Office of Planning and Budget (GOPB) and the Office of the Legislative Fiscal Analyst (LFA).
- Develop an Interactive Dashboard for Fee Transparency: A publicly accessible, interactive dashboard would centralize fee and ISF rate information for both policymakers and the public, providing a single, authoritative source of truth.
- Expand the Legislative Review and Approval Timeframe: To allow for more thorough evaluation and reporting, agencies should be required to submit fee and ISF rate data to LFA by September 15 each year. This would enable staff to prepare more comprehensive reports for the Legislature. Additionally, appropriations subcommittees should be encouraged to review the fees data during their October meetings.
- Request Report from the ISFs Comparing Rates to the Market: The Internal Service Funds should assess the comparability of their rates to the private market and report back to the General Government Appropriations Subcommittee on how they can enable their customer agencies to make such comparisons.
A brief including these recommendations is available here: General Government Accountable Budget Process Report.
A major barrier to addressing these challenges has been the expected cost associated with the time and technology required for agencies to collect and provide additional information. However, the ongoing transition toward enhanced data submission requirements, coupled with advancements in state financial systems, may significantly temper costs when compared to previous projections.
Still, implementation of these six recommendations would be a complex undertaking. Improving data for decision makers and the public related to rates and fees would require significant collaboration and commitment from the Legislature, the Governor’s Office, and all agencies responsible for imposing fees. However, the outcome would allow the state to deliver reliable, accurate, and prompt information to policymakers and the public. This approach would ensure that fees are fair, justified, and clearly linked to the costs of the services they fund.
A Scoreboard for Success: The 2025 New Funding Follow-up Report
To understand how our favorite sports team is doing, we look for a scoreboard that provides a snapshot of our team’s performance. Displaying key performance indicators (KPIs) such as the score, time remaining, turnovers committed, and penalties gives us important information. Empowered by this data, we can decide how much emotional capital to invest in the short-term for a game and over the long-term during a season.
Similarly, legislators often look for indicators as to whether state-funded projects or processes require adjustments to their level of financial investment in the short- and long-term. The annual New Funding Follow-up Report (Follow-up Report) serves as the budgetary scoreboard for legislators and the public to understand how past investments are performing.
Performance is a key consideration in the Utah budgeting process. During the RFA submission process, legislators are asked to describe how performance might be assessed. Much like a coaching staff that must decide on an offensive scheme based on their personnel (spread, pro-style, west coast, air raid, etc.), legislators assess what types of measures align with their desired impact—increased throughput, elevated quality, or improved outcomes from their project. Similarly, for items in the Governor's Budget that are funded, analysts work with agency staff to assess how to best measure the impact of taxpayer dollars. Subsequent follow-up on these funded projects occurs annually, through agency reported data included in the Follow-up Report.
Building the Roster: Additional Recommendations and Types of Funding Items
During the September Executive Appropriations Committee meeting, the Legislative Fiscal Analyst unveiled this year's Follow-up Report, covering $5.7 billion in state funding over 410 new projects approved in recent sessions. This year’s edition emphasized recommendations from LFA budget analysts, with nearly double the recommendations of prior years.
Recommendations are highlighted on the “Action Items” page, which includes the following filters to allow legislators to find those relevant and substantive to their interests or committee assignment:
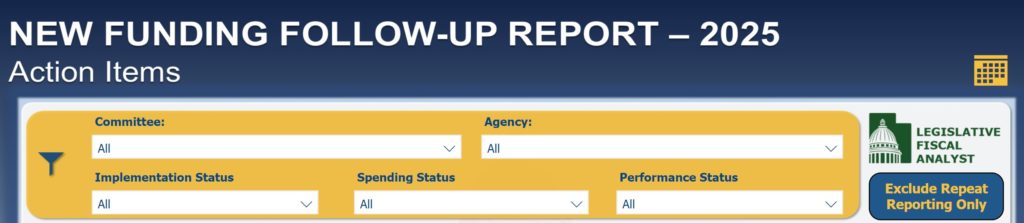
Using the six filters shown above, legislators and stakeholders can more easily find insightful recommendations that achieve the following objectives:
- Staying Inbounds: Using the Committee and Agency filters, legislators can find recommendations within the boundaries of their committee assignments or areas of interest.
- Chain-Mover: The “Exclude Repeat Reporting Only” button on the top right of the dashboard is a new feature this year, filtering out projects that need more time and subsequent reporting. The remaining recommendations keep the drive alive, proposing actions like sweeps of unspent funds or possible project changes based on performance to ensure wins for as many legislative priorities as possible.
- The Playbook: As agencies report on implementation, spending, and performance, the three remaining filters can help legislators develop a list of likely actions that could be considered during the General Session, such as sweeping unspent funds for completed projects that were under budget.
Besides enhanced filtering, additional types of funding items are also included in this year’s report based on intent language in S.B. 2, “New Fiscal Year Supplemental Appropriations Act” (2025 General Session). As the Legislature has oversight of proceeds resulting from opioid litigation, this year’s report also includes the items that have received appropriations from the Opioid Litigation Proceeds Restricted account, which is shown here and accessible via the “Opioid Settlement Projects” button on the “Funded Projects” page.
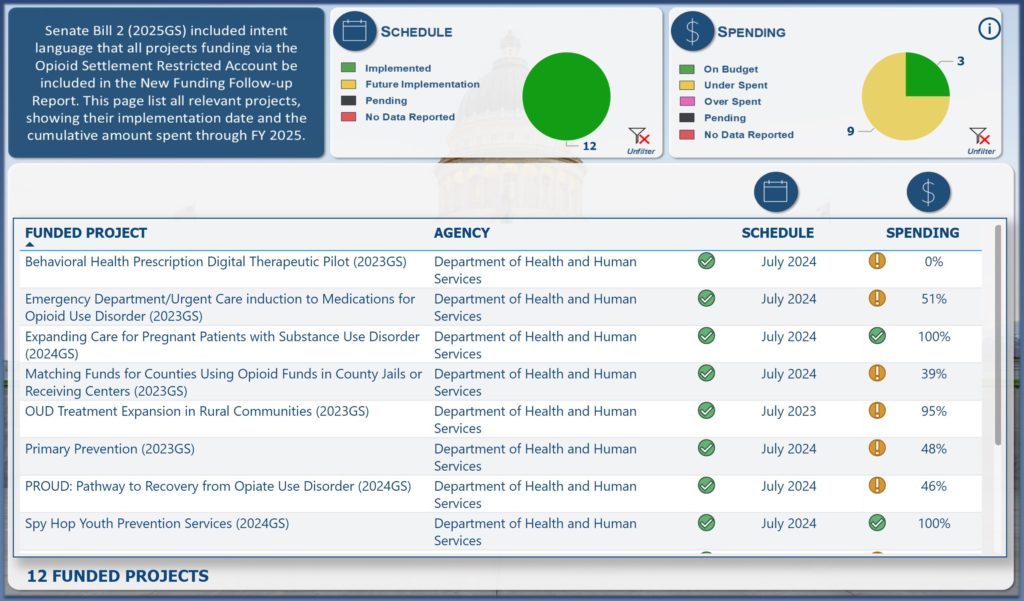
Expanding the scope of projects in the 2025 New Funding Follow-up Report beyond traditional General Fund and Income Tax Fund projects ensures that accounts with finite revenue streams like those from opioid litigation settlement funds are actively managed and accounted for.
Planning the Post Season: Reviewing Line Item Measures
Long term trends (i.e. franchise health) is better assessed using line item performance measures, which are reported annually in the Performance Tab of the Compendium of Budget Information (COBI). Over the next month, gameday prep will switch from funding item measures to line-item measures, which focus on performance trends over time for programs and divisions. Legislative staff are currently working with executive branch agencies to propose modifications to existing measures, which may include archiving less relevant measures, and proposing new metrics. (As mentioned, current line-item measures can be found on the Performance tab of associated pages in COBI.)
Taking a few reps and reviewing the results in the 2025 New Funding Follow-up Report and existing line-item measures in COBI for appropriations subcommittees agencies is a great way to prepare for the budgetary playoffs on October 14th. Analysts will be soliciting feedback on current performance measures as subcommittees finalize their performance game plan and take a motion on approved line-item measures for Fiscal Year 2027.
The Great Reallocation: Rethinking Higher Education Funding
During the 2025 General Session, the Legislature passed H.B. 265, “Higher Education Strategic Reinvestment” which, in connection with House Bill 1, “Higher Education Base Budget” created the framework for reallocating existing resources within the state's higher education budget. Broadly, Strategic Reinvestment requires each of the eight public, degree-granting colleges or universities to create a plan that repurposes funding for programs and divisions which warrant additional investment.
Reinvestment Budgets
As discussed in a previous post, the Legislature appropriates funding to functional expenditure categories. The largest appropriation unit for each institution is 'Instruction'. To determine the amount each institution was required to reinvest, the Legislature moved a sum equal to 10% of the Instruction appropriation at each school into a new line item called "Strategic Reinvestment," which is budgeted under the Utah Board of Higher Education. In total, $60.5 million was set aside for this effort. The amount to be reinvested at each institution is as follows:
| Institution | Amount |
|---|---|
| Salt Lake Community College | $5,246,800 |
| Snow College | $1,678,700 |
| Southern Utah University | $3,176,000 |
| University of Utah | $19,585,200 |
| Utah State University | $12,645,300 |
| Utah Tech University | $2,555,100 |
| Utah Valley University | $8,904,800 |
| Weber State University | $6,660,800 |
| Total | $60,452,700 |
Reinvestment Process and Requirements
Although the funding identified for reinvestment came from universities' Instruction budget, UCA 53B-7-107(3)(b) clarifies that the funding can be reallocated from various sources within the institution, including specific programs, courses, departments, and even administrative positions. Statute also outlines seven key criteria that each plan must include:
- Demonstrated enrollment data;
- Completion and timely completion rates;
- Discipline-related professional outcomes, such as employment, licensure, and wages;
- Current and future workforce demands, both localized and statewide;
- Program-level costs;
- The institution's unique mission and role within the statewide system; and
- Retention of a core general education curriculum that helps students develop critical thinking and communication skills.
The Legislature empowered the Board of Higher Education to establish additional standards for reallocations and to provide institutions with metrics and evaluative processes for use in developing strategic plans. The Board has approved policies for how to statistically evaluate the merit to students of particular programs, and to encourage institutions to focus their reinvestments on expanding educational opportunities for fields with high-demand workforce fields.
Approval and Implementation
In acknowledgement of the reality of the time needed to make these reinvestments, the Legislature allowed for a three-year implementation timeline and required a minimum of 30% of funds to be reinvested in Fiscal Year 2026, 70% in Fiscal Year 2027, and the entire amount by Fiscal Year 2028.
Institutions worked through the spring and early summer to finalize their strategic reinvestment plans, which they then presented to the Utah Board of Higher Education on June 6 and August 12. The Board found the plans compliant, and the institutions presented their plans to the Higher Education Appropriations Subcommittee on August 19, and to the Executive Appropriations Committee on September 15. The Executive Appropriations Committee found seven of the eight plans compliant, requiring Utah State University (USU) to return again once a new, permanent president of the university is appointed and has an opportunity to review and revise the plan.
Having received approval of their plans, the remaining seven institutions are now authorized to begin executing their reinvestment plans after receiving funds from the Board of Higher Education. USU will likely seek approval early in 2026, or once a new president has been selected.
A summary of each institution’s strategic reinvestment plan can be found here and the presentation that each institution gave to the Higher Education Appropriations Subcommittee and Executive Appropriations Committee can be found below:
- Salt Lake Community College
- Snow College
- Southern Utah University
- University of Utah
- Utah State University
- Utah Tech University
- Utah Valley University
- Weber State University
All institutions will be required to submit progress reports in 2026 and in 2027, and must go through the same approval process to request any modifications to their plans.
A Head Start: Getting Current with Concurrent Enrollment
Concurrent Enrollment (CE) is a long-standing program that connects Utah’s public schools and higher education institutions, allowing high school students to earn credit for both high school and college in the same course. In the 2024 school year, more than 56,000 Utah students participated (or roughly 26 percent of all high schoolers), making CE a central part of the state’s early college pathway strategy.
The Utah State Board of Education (USBE) and the Utah Board of Higher Education (UBHE) jointly oversee the state’s CE program. Local Education Agencies (LEAs) contract with higher education institutions to provide courses, ensuring accountability and statewide consistency. Classes are taught by either college faculty or qualified high school teachers approved by partnering higher education institutions. CE credits are applied to both high school graduation requirements and future college degrees or certificates.
Participation and Funding
CE participation has grown steadily, increasing nearly 30% in the last five school years and an average of 7.5% per year since 2018. Participation jumped nearly 13% in 2019-20 alone, likely because of COVID-19 and the shift to online learning which made CE courses more accessible to students statewide.
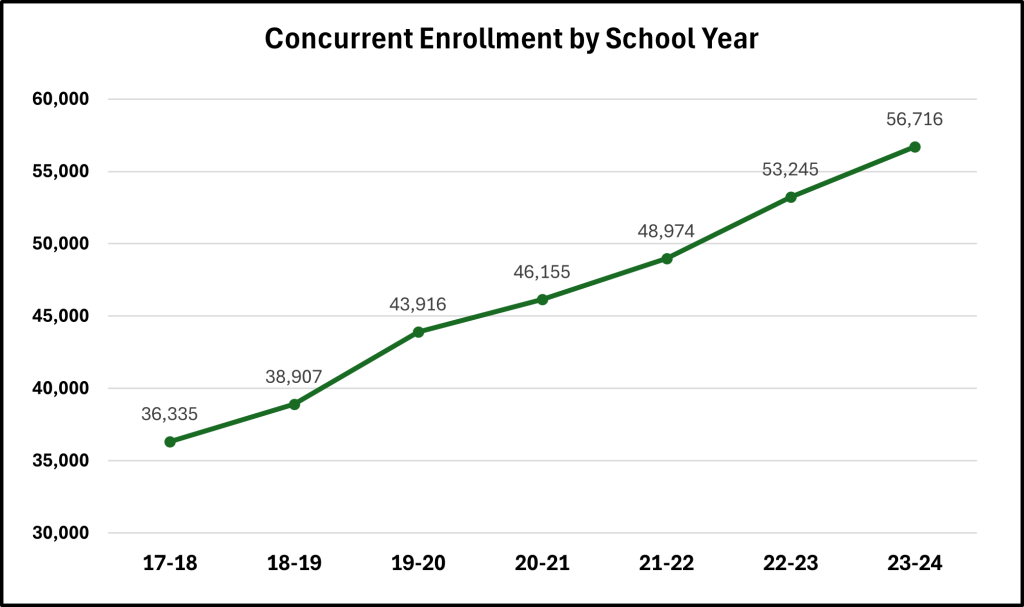
In the 2024 school year, students successfully earned over 443,000 credit hours, with a passage rate mirroring the average at 95%. At the same time, the statewide average for credit hours earned has incrementally increased to7.8, up almost half a credit hour from 2018. These results show that growth in participation has not diluted success, with students increasing engagement and maintaining strong outcomes.
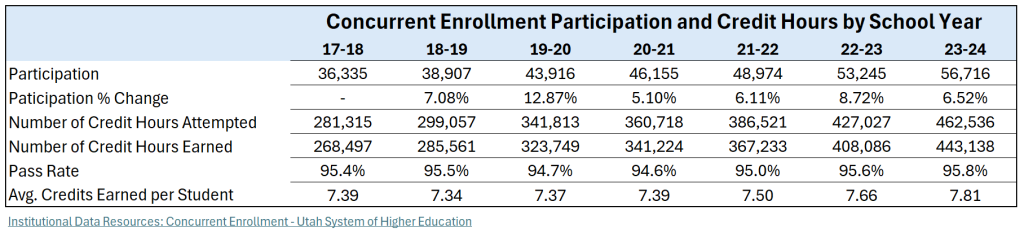
The state pays for CE through a combination of enrollment growth and the WPU value. During the 2020 Fifth Special Session, the Legislature passed H.B. 5011, “WPU Value Increase Guarantee” which raised the WPU value by an additional 4 percent and directly tied CE funding to adjustments in the WPU value. Before this, the annual percentage funding increase averaged 4.35 percent, whereas since the WPU Value Increase Guarantee, the average annual increase has risen to 14.12 percent. The CE program budget (which is part of the Minimum School Program) is $23.4 million for Fiscal Year 2026.
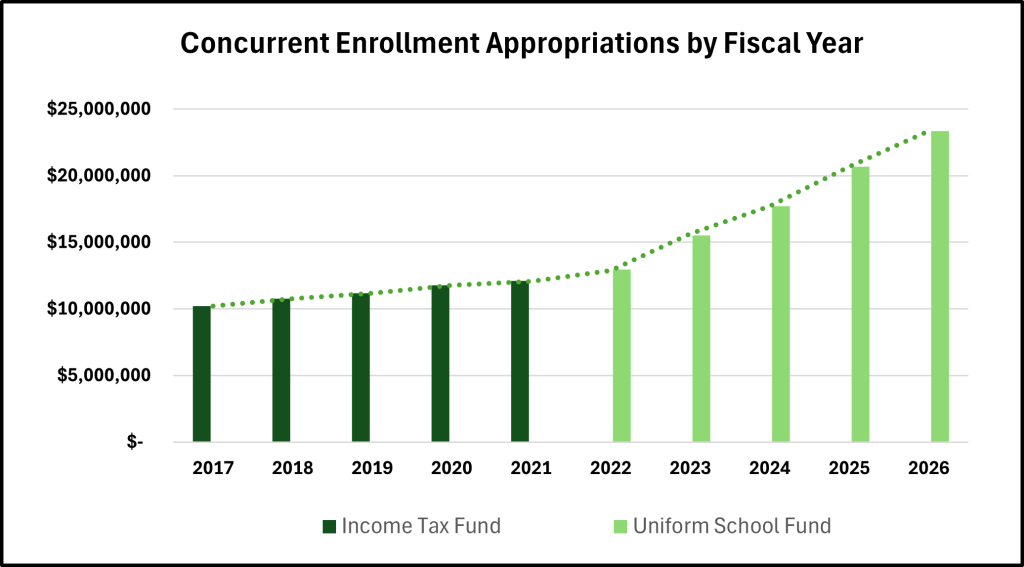
State appropriations for CE are distributed based on who bears the primary cost of instruction. The allocation formula is outlined in UCA 53F-2-409:
| Instructor | Funding to LEA | Funding to Higher Education |
|---|---|---|
| High School Teacher | 60% | 40% |
| College Faculty | 40% | 60% |
For instance, when a Higher Education institution primarily bears the cost of instruction, the State Board of Education distributes 60% of the appropriated state funds to State Board of Regents, and 40% to the LEAs. While this model is flexible in its design, since 2018, LEAs have received 60% of the appropriated funding for the CE program.
Alongside legislative appropriations, students pay a small tuition amount directly to the higher education institution offering the CE course. UCA 53E-10-305 provides a statutory cap of $30 per credit hour for courses that earn college credit (with lower thresholds outlined for students in certain socioeconomic conditions). Current practice across all Utah System of Higher Education institutions is $5 per credit hour for CE courses. Most CE courses count for three credit hours, so students typically pay $15 per course. The statute also permits institutions to charge a one-time admission fee for CE students. Institutions retain student tuition revenue, which is separate from the state’s appropriation for the program.
According to USHE Concurrent Enrollment Dashboard, Utah students saved a total of $110.6 million in tuition by taking CE courses from Degree Granting Institutions and Technical Colleges. On average, this participation saves students approximately $950 per three-credit course based on 2026 tuition rates.
Recent Legislative Updates
- S.B. 102, “Public Education Reporting Amendments” (2025 General Session) requires a review of the CE program by the Education Interim committee every five years beginning in FY 2028.
- H.B. 493, “Concurrent Enrollment Participation Amendments” (2024 General Session) allows students to participate in a broader range of online courses offered statewide, not limited to offerings from the LEA’s designated institution of higher education.
- H.B. 22, “Concurrent Enrollment Revisions” (2024 General Session) amends criteria for certifications offered through the CE program and requires scholarships to be awarded for certain CE students who earn certificates.
Concurrent Enrollment has evolved from a foundational partnership into an increasingly vital component of Utah's education system. Robust participation and high course passage rates have saved Utah’s students millions of dollars, providing a financial head start as they enter the next phase of their educational careers. Recent legislative changes reinforce the state’s commitment to advanced education by expanding access to online courses and providing additional financial support for students as they continue onto higher education.
Cultivating Success: Utah's Dual Approach to Funding Medical Cannabis
Since its inception in FY 2019, the scale of Utah’s medical cannabis program has increased dramatically. As of September, the Department of Health and Human Services (HHS) reports over 104,000 patients with active medical cannabis cards. Administering and implementing the medical cannabis program is a unique partnership between HHS and the Department of Agriculture and Food (UDAF). Unlike many of Utah's state programs, medical cannabis is entirely self-funded (a statutory requirement). This post serves as an overview of the program’s structure, provides an update on revenues, and summarizes recent policy changes.
Patient Focus
HHS houses the Center for Medical Cannabis, which licenses medical cannabis patients, providers, and also provides staff support to the Medical Cannabis Policy Advisory Board.
HHS is authorized to charge fees for licensure of patients and providers. Prior to July 1, 2025, that included Qualified Medical Providers who recommend medical cannabis to patients. Those providers will no longer pay a fee to HHS, and will be overseen by the Division of Professional Licensing. Another substantial change from the 2025 General Session was reducing the Uniform Transaction Fee by 50%. This fee is applied to all medical cannabis purchases (over 1.6 million transactions in FY 2025 alone). The table below shows the categories of fees charged by HHS along with the amount of revenue collected in FY 2025.
| HHS Fee Name | Fee Amount | Revenue |
|---|---|---|
| Guardian and Provisional Card Fees | $15 - 68.25 | $2,789 |
| Uniform Transaction Fee | $3.00 | $4,827,825 |
| Caregiver Card Fees | $5 - 68.25 | $21,748 |
| Patient Card Fees | $15 | $1,688,611 |
| Pharmacy Medical Provider Fees | $50 - 150 | $5,400 |
| Qualified Medical Provider Fees | $50 - 150 | $42,340 |
| Interest Income | - | $421,373 |
| Total FY 2025 Revenue | $7,010,085 |
If the 2025 General Session policy changes had applied to the medical cannabis industry in the last fiscal year, patients and providers would have saved over $2.5 million in fees. The chart below shows the activity of the Qualified Patient Enterprise Fund (Patient Fund), which represents the entire budget for the HHS medical cannabis program.
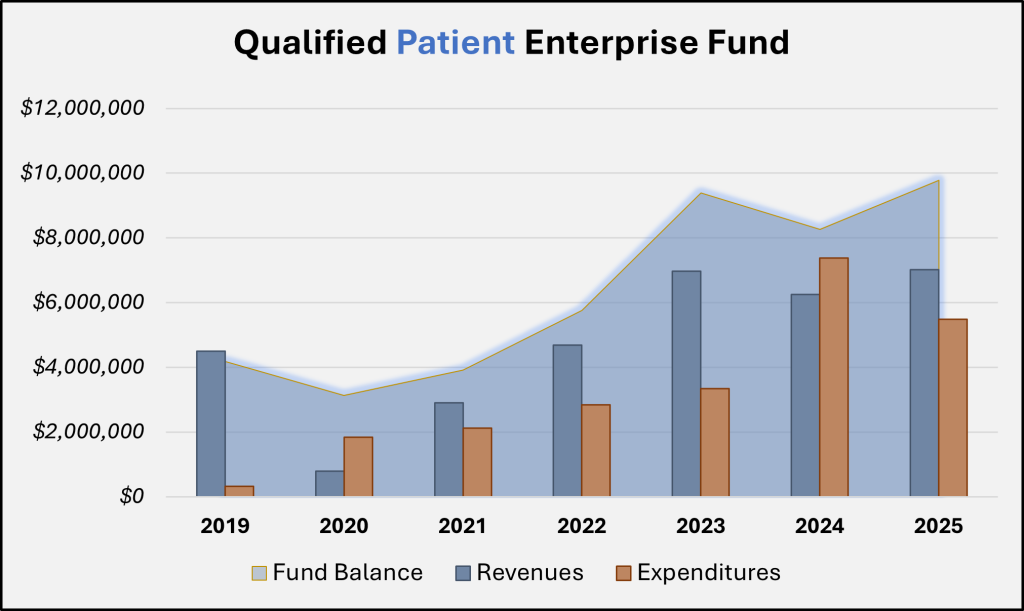
Enterprise Funds are used to account for government operations that function like a private business. These funds do not typically require appropriation, and are designed to recover costs primarily through user charges (fees for services and regulatory oversight). As can be detected in the graph for the Patient Fund, the account's balance has grown steadily since 2019. When the program was created, the Legislature allocated $4.5 million one-time General Fund to the (former) Department of Health and $900,000 to UDAF as seed money for the two arms of the program. As of FY 2024, both of these 'loans' have been repaid by each program. The preliminary yearend balance for the Patient Fund is nearly $9.8 million.
The chart below describes the number of patients who registered or renewed their cards by month in the state, along with the number of pharmacy transactions statewide.
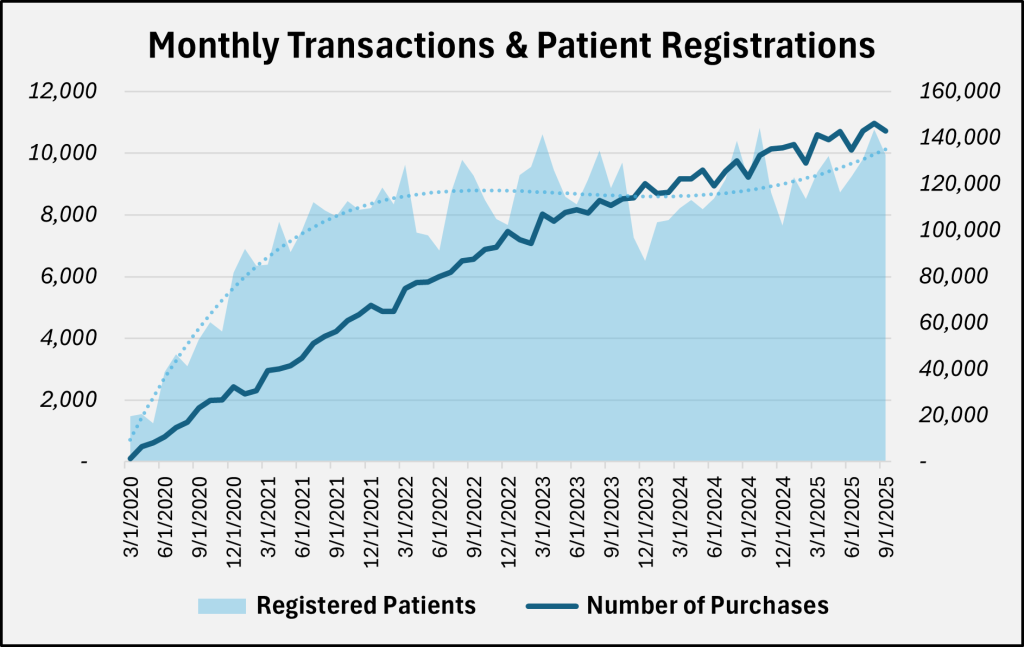
In addition to reducing the uniform transaction fee, HHS reduced the fees paid for patient registration by Utah residents. The graph above shows since the program's beginning the number of transactions has steadily increased each month. While the growth in monthly patient registrations has somewhat stabilized, the total number of patients continues to increase, adding nearly 15,000 patients from FY 2024 to FY 2025. That is to say, even with the significant reductions in the FY 2026 fee schedule, the HHS Medical Cannabis program is expected to be well funded into the foreseeable future.
Production Focus
UDAF’s medical cannabis responsibilities include regulating cultivators, processors, and pharmacies, as well as staffing the Cannabis Production Establishment and Pharmacy Licensing Advisory Board. Until the 2023 General Session, pharmacy oversight was conducted by HHS.
UDAF's fee structure differs from HHS in that several of the entities they are allowed to charge fees to are capped in statute. There are currently eight licensed cultivators in the state. Per UCA 4-41a-205, UDAF can't issue additional cannabis cultivation facility licenses unless an existing license is forfeited, current cultivators fully utilize their 100,000 square foot production limit, or if patient demand (as determined by HHS) overwhelms the current supply.
| UDAF Fee Name | Fee Amount | Revenue |
|---|---|---|
| Establishment Application Fees | $250 - $2,500 | $7,300 |
| Cultivator License | $100,000 | $800,000 |
| Processor License Fees | $35,000 - $90,000 | $1,385,000 |
| Pharmacy Licenses | $33,500 - $67,000 | $887,000 |
| Courier/Home Delivery Licenses | $2,500 | $17,500 |
| Laboratory License | $15,000 | $15,000 |
| Establishment Agent Cards | $100-$150 | $147,665 |
| Research University License | $2,500 | $0 |
| UDAF Analytical Laboratory Testing | Varies by test | $253,180 |
| Other (grama, reprints, etc.) | - | $3,685 |
| Citation Revenue (transferred to General Fund) | - | $44,100 |
| Interest Income | - | $128,458 |
| Total FY 2025 Revenue | $3,644,788 |
This same section of code limits the number of Tier 1 processor licenses to 18, though last year UDAF only issued 15. Tier 1 Processing Licenses allow entities to process, formulate, package, and label products, where as a Tier 2 license only allows packaging and labeling.
Similarly, UCA 4-41a-1005 allows up to 17 Pharmacy licenses; this threshold was increased by two licenses during the 2025 General Session. H.B. 54, "Cannabinoid Amendments" enacted UCA 4-41a-1006 which outlines the timeline and eligibility for awarding the two additional pharmacy licenses, including that they can't be financially related to an existing pharmacy and must be located in rural counties that are designated as medically underserved by the U.S. Department of Health and Human Services.
Based on this statutory criteria surrounding licensure, it's perhaps not surprising that the fee revenue for the UDAF program was about half that of the HHS program in FY 2025. The Qualified Production Enterprise Fund (Production Fund) closed FY 2025 with a balance of $2.3 million, or roughly a quarter of the Patient Fund.
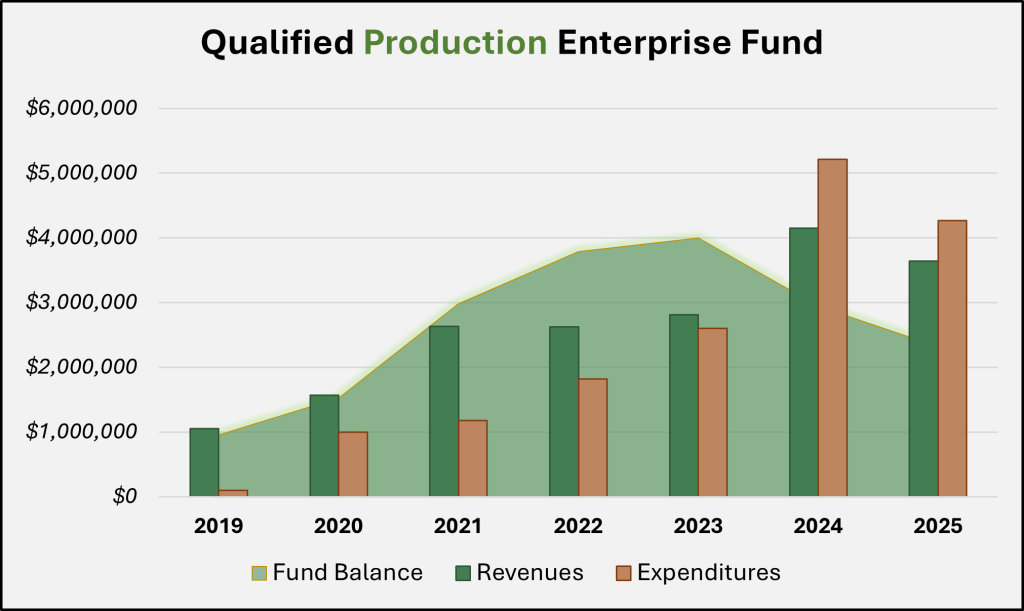
Legislative Oversight
In the 2022 General Session, the Legislature passed S.B. 153, "Medical Cannabis Governance Study" which created the Medical Cannabis Governance Structure Working Group. This group, comprised of legislators from both the Health and Human Services Interim Committee and the Natural Resources, Agriculture, and Environment Interim Committee, was initially tasked with determining if oversight of the program should be housed under a single state agency. The following year the membership was broadened to six members of the legislature and the committee's scope of work was extended to making recommendations to both interim committees about the governance of the Utah medical cannabis program.
In the 2025 General Session, the Legislature passed the following bills related to medical cannabis (which were almost entirely sponsored by members of the governance structure working group):
- S.B.64, "Medical Cannabis Amendments": set limits for Tier 1 processing facilities and requires HHS to create patient product information inserts to include dosing information, instructions, side effects, safe storage recommendations, etc.
- H.B. 54, "Cannabinoid Amendments": allows for two additional pharmacy licenses, reduces fees for certain rural pharmacy licenses, requires UDAF to report on fines issued to regulated entities, and allows processors to include certain product information online.
- H.B. 343, "Cannabis Production Amendments": requires cultivators, processors and labs to include odor control in their operating plans and requires UDAF to make recommendations to the governance structure working group about standards for odor control.
- H.B. 357, "Medical Cannabis Modifications": eliminates qualified medical providers, sets standards for continuing education required for recommending medical providers, and shifts regulation for medical providers to the Department of Commerce.
Through it's first seven years in practice, Utah's medical cannabis program has seen robust adoption by patients which has offered opportunities for production establishments, pharmacies, and regulators to develop a program that is both unique to Utah and responsive to larger industry standards. Active policy refinement and budgetary oversight by the legislature is paving the way for an affordable, self-funded program that serves constituents in even the most rural areas of the state.
No Hocus Pocus, just a Budget Contingency Focus
During the 2025 General Session, the Legislature advanced several innovative strategies to strengthen Utah’s budget contingency planning. Budget contingencies enable the Legislature to set aside resources in inflation-resistant assets, providing a safeguard against potential future budget shortfalls. The most notable changes came through two proposals: the advancement of Utah’s precious metals reserves and the creation of the State Sovereignty Fund.
The Legislature’s precious metal reserves were created during the 2024 General Session with the passage of H.B. 348, “Precious Metals Amendments”. This bill allowed the State Treasurer’s Office to invest 10% of select rainy-day funds into precious metals. Currently, this amounts to approximately $109.7 in initial purchases, equivalent to around 38,300 troy ounces of physical gold, which is physically stored in a high security vault here in Utah.
The table below shows the current asset value and quantity for each rainy day fund with gold investments.
| Fund | Value | Weight (ozt) |
|---|---|---|
| GF Medicaid Growth | $15,116,300 | 5,300 |
| GF Budget Reserve | $24,871,200 | 8,600 |
| State Disaster Recovery | $5,148,700 | 1,800 |
| ITF Budget Reserve | $64,627,300 | 22,500 |
| Total | $109,763,500 | 38,300 |
In the 2025 General Session, the Legislature passed H.B. 67, “Precious Metals Investment and Administration Amendments” which made improvements to the management of the precious metals reserves. The bill allows the State Treasurer’s Office to deduct any administration costs from earnings generated by the same rainy-day funds that are invested in precious metals. Some examples of administrative costs in FY 2025 include $144,200 for storage and insurance and $3,000 for audit fees (broken up into 2 audits a year). Combined, this is roughly $147,200 in ongoing expenses that are deducted from the interest earnings from the rainy-day funds.
Historically, gold has been considered one of the best precious metals to hedge against inflation because it holds its intrinsic value better than fiat currencies. Currently, the treasurer has no plans to invest in other precious metals outside of gold. The chart below describes the drastic swings in inflation over the years, contrasted by gold's relatively stable value.
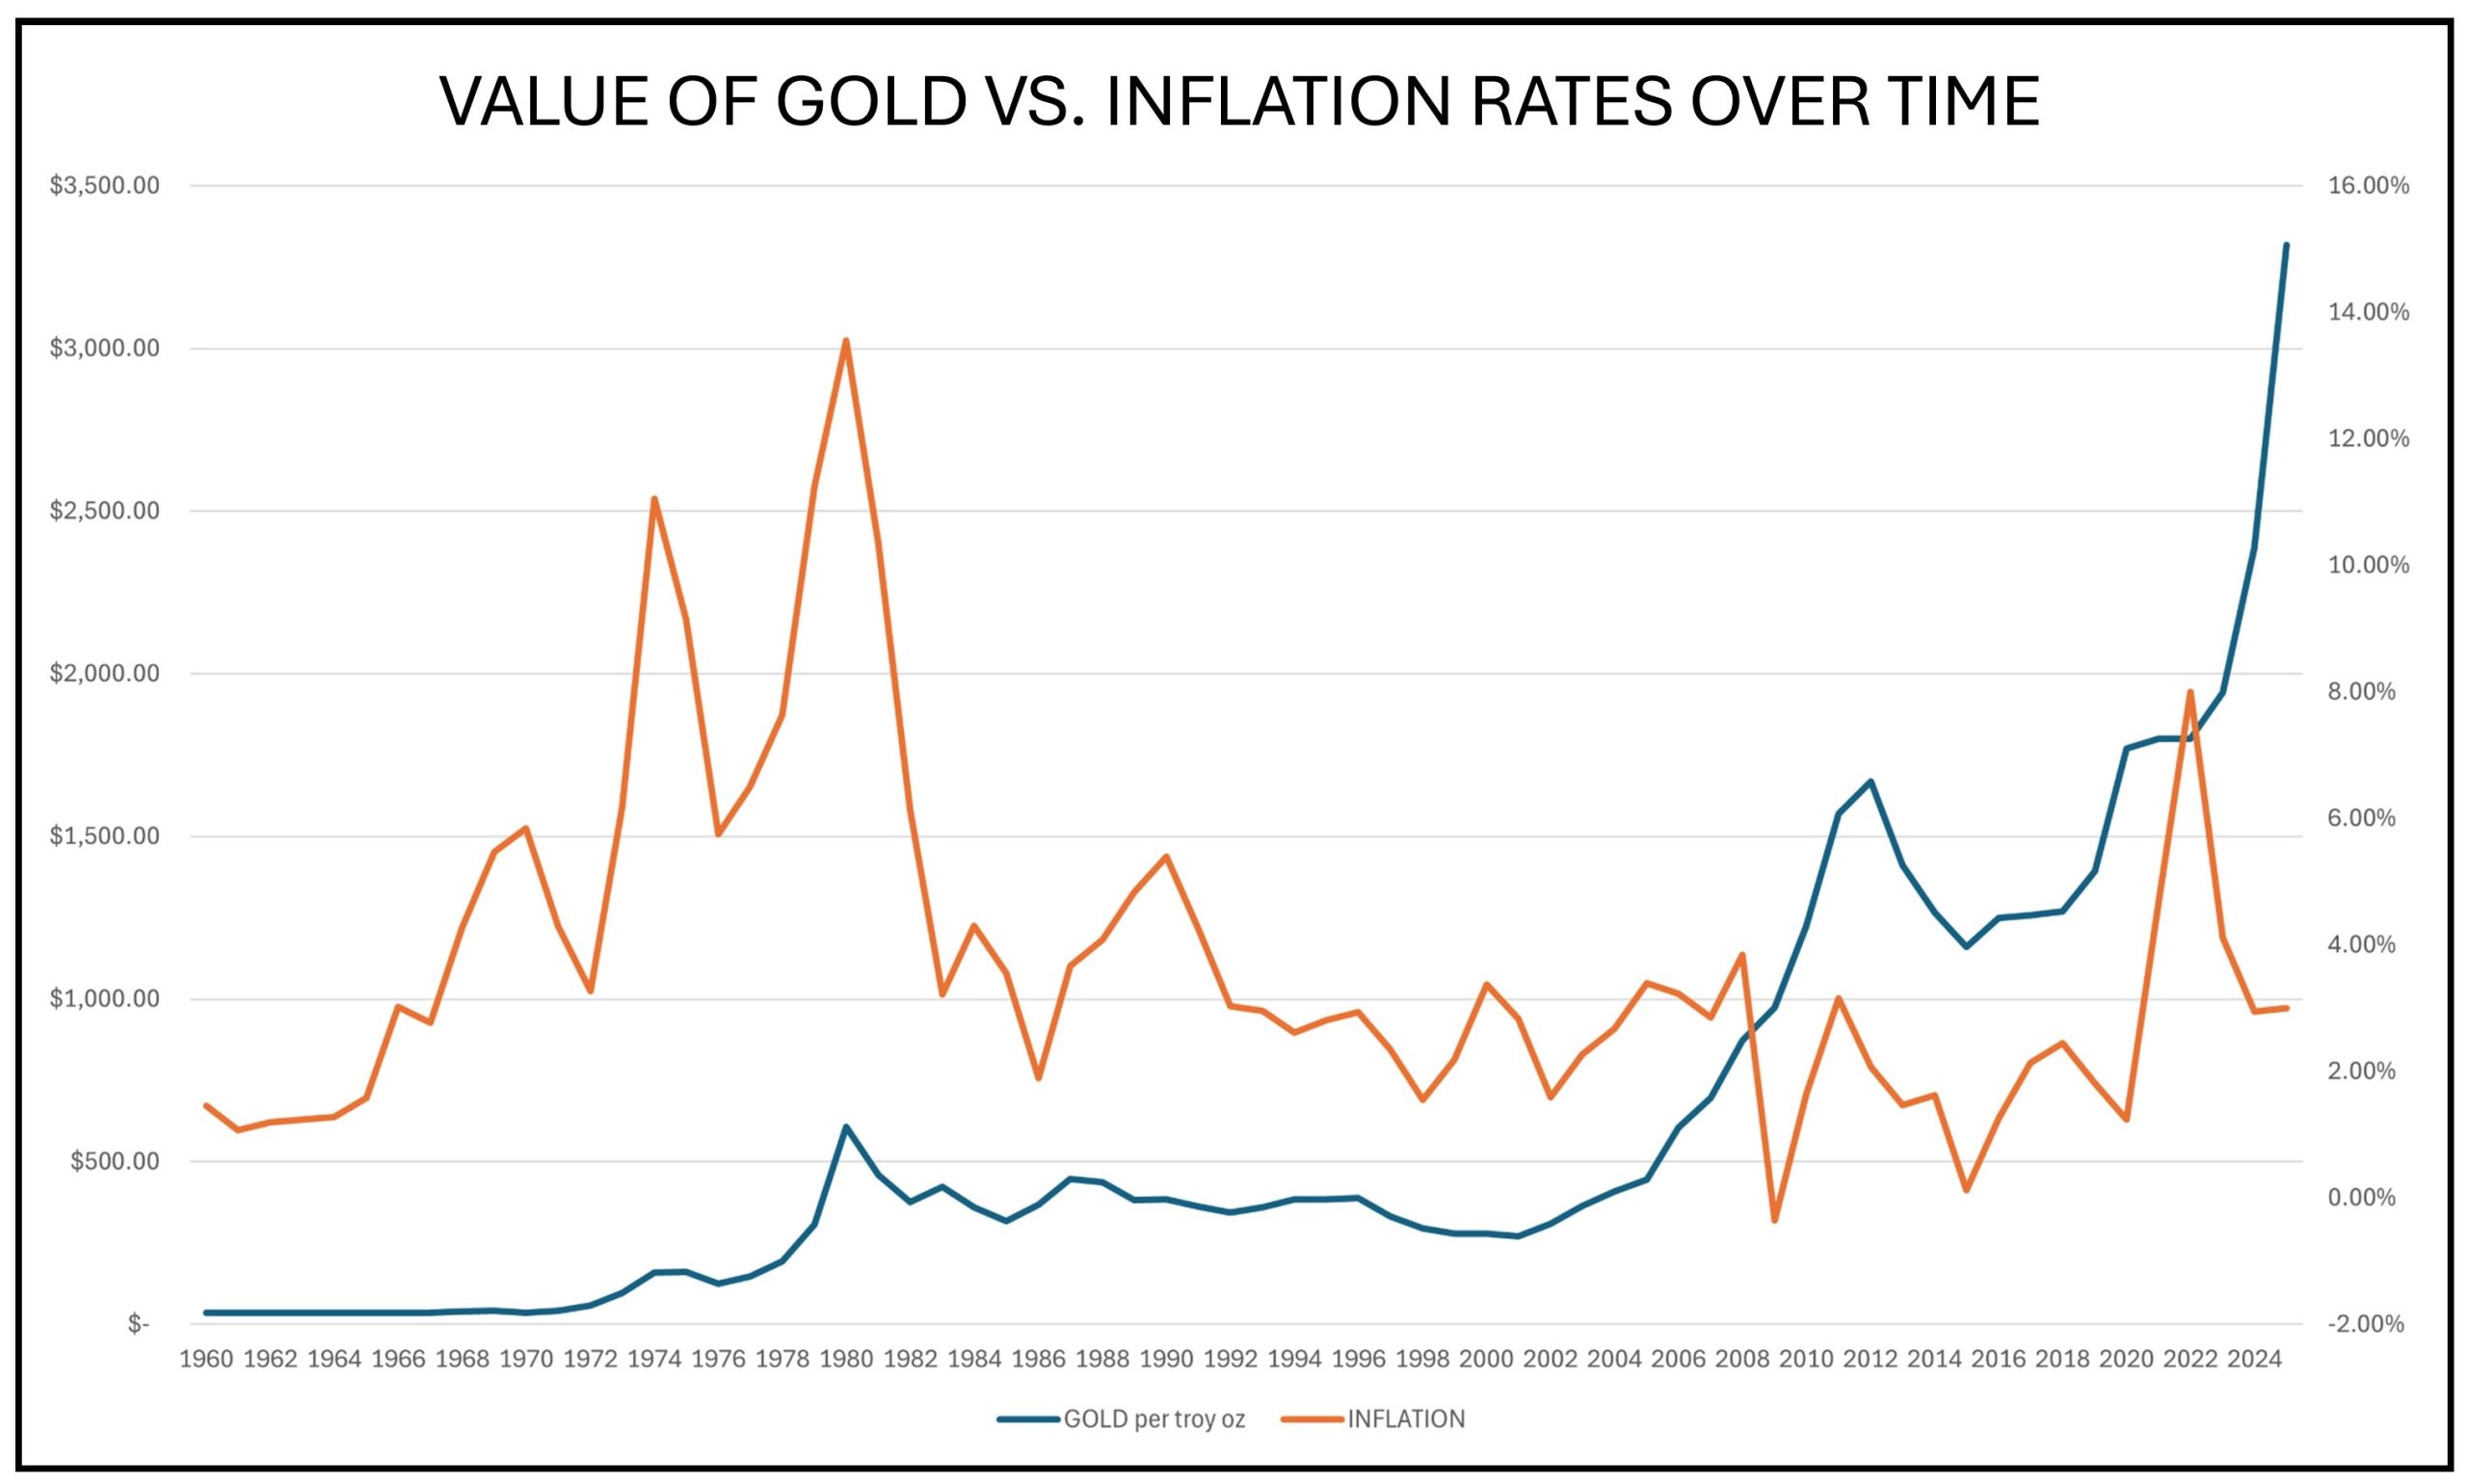
Also in the 2025 General Session, the Legislature made further strides in Utah’s budget contingency plans with the passage of H.B. 464, “State Sovereignty Fund.” This legislation authorized the creation of a new long-term investment fund. Per UCA 51-13-201, the fund consists of:
- any amounts remaining from required transfers to the General Fund or Income Tax Fund Reserve Accounts when those account balances are at statutory maximums;
- 50% of any General Fund savings from a decrease in the Federal Medical Assistance Percentages (FMAP);
- 12.5% of the resulting state fund savings from an enhanced FMAP offer;
- surplus General Fund or Income Tax Fund that is more than two standard deviations above a 20-year average;
- interest, dividends, or other earnings attributable to the fund; and
- any other appropriation from the Legislature.
As of the FY 2025 closeout, the State Sovereignty Fund had an balance of $36.2 million. Statute limits the legislature from appropriating from the State Sovereignty Fund until Fiscal Year 2076, at which point the Legislature can appropriate up to 50% of the annual earnings from the investment to offset reduced federal funding or provide state tax relief. Additionally, the principle of the fund cannot be appropriated unless there is a two-thirds vote from all members from both chambers.
While the precious metals reserve was inflation-resistant because it was an asset commodity, the State Sovereignty Fund achieved inflation resistance by being invested. Statute specifies that the State Treasurer’s Office is to invest the money with stability and growth in mind. Initially, this could include investing the State Sovereignty Fund similar to how they currently invest in the Public Treasurer Investment Fund (PTIF). The PTIF is invested primarily in investment-grade corporate notes, top-tier commercial paper, and money-market mutual funds, all of which are historically viewed as inflation-resistant. However, this could change to being invested with their other long term investment portfolio before the end of the year. Additionally, a portion of the State Sovereignty Fund can also be invested in physical gold, similar to the rainy-day funds discussed earlier. This diversity in investment is the key to inflation resistance.
While we may not ultimately know if or when a budget shortfall could occur, the presence of these new and existing budget contingencies offers a measure of stability in the budgeting process. Additionally, in December, legislative economists along with the Governor’s Office will release the triennial budget Stress Test report which details the impact of various hypothetical economic scenarios on long-term revenue and also determines whether current budget buffers are adequate. These budgeting strategies help ensure that state programs can continue operations even amid economic uncertainty.
What's New in Revenue: Updates to Sales Tax Earmarks
Avid readers of budget.utah.gov may recall this post from April, when we reviewed recent changes to transportation-related set asides. If you were left wondering about other changes to General Fund earmarks, then today is your lucky day.
State sales and use tax earmarks are established in UCA 59-12-103. While some changes implemented in the 2025 General Session had an effective date of July 1, 2025, others are not effective until next year. The two charts below demonstrate how the earmarks will be distributed in Fiscal Year (FY) 2026 and how those distributions will change in FY 2027. While quantities and recipients will not vary greatly between the two years, there are key differences in implementation.
Earmark Calculations
In the 2025 General Session, the Legislature passed S.B. 27, “Motor Vehicle Division Amendments” which provided a major overhaul of the language in UCA 59-12-103, the code section directing Sales and Use Tax rates and purposes. The amended code, effective July 1, 2026, results in a simplification of the calculations, without changing rates or uses of revenue. To better understand this, let’s look at portions set aside for water. Currently, the distributions for water projects are calculated using the total taxable sales as the base, multiplied by a 1/16% tax rate. From there, the individual portions are calculated as a percentage of that total.
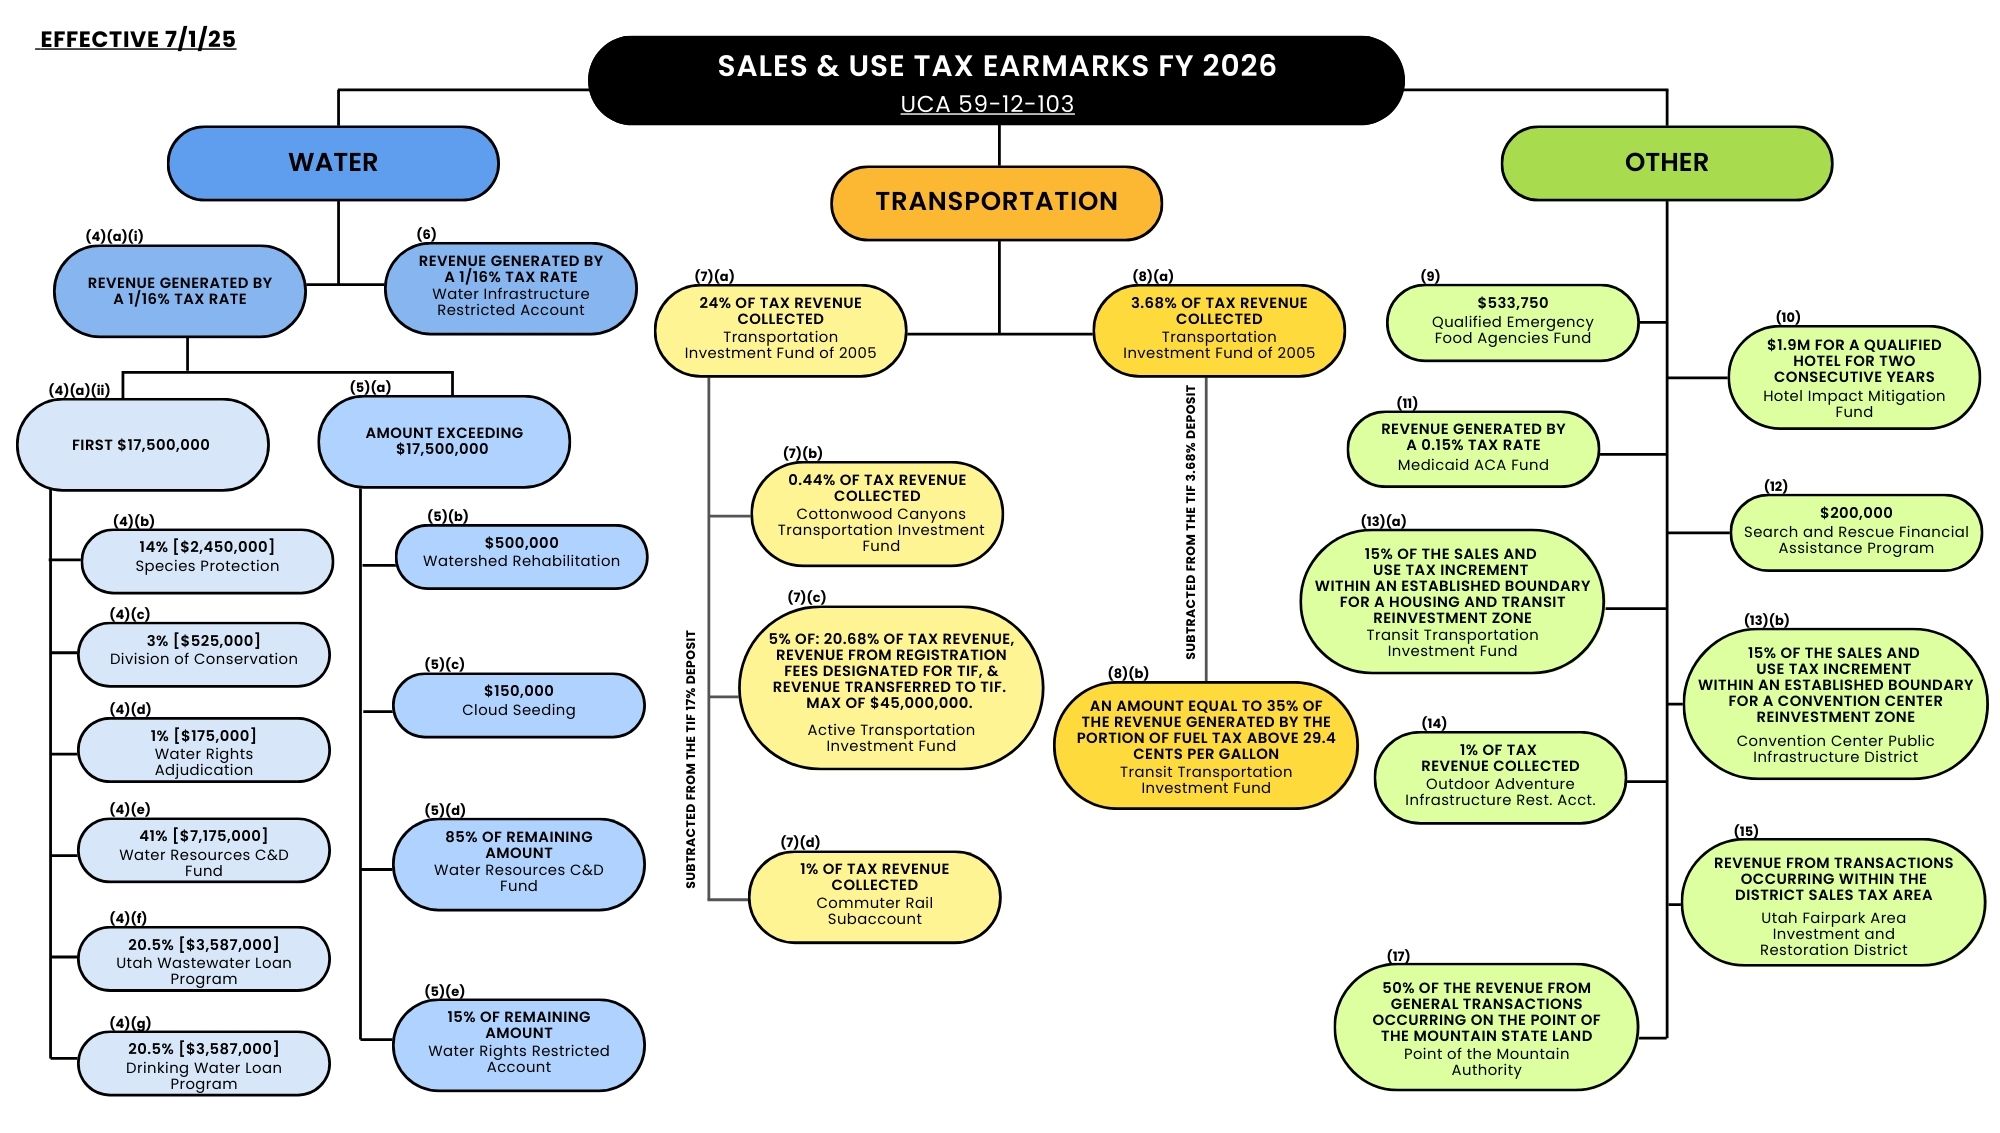
Take for example, the earmark for the Utah Wastewater Loan Program (shown as (4)(f) in the blue section above). Presently, the water related calculation begins with the amount of revenue that is generated by a 1/16% rate (i.e., 0.000625) on the value of total taxable sales. Then, the first $17.5 million of that amount is set aside for specific water related purposes. Of the first $17.5 million, the Utah Wastewater Loan Program receives 20.5%, which is equivalent to $3,587,000.
In FY 2027, earmarks will be calculated using total state sales tax revenue as the base. Looking at the Utah Wastewater Loan Program again, we begin with 1.4543% of the total state sales tax revenue. Of those collections, the distribution for wastewater infrastructure loans is set at the static amount of $3,587,000. In addition to being easier to explain, this simplification creates consistency with the amounts set aside for Transportation, which already use total state sales tax revenue as their base.
Simplifying Set Asides
As discussed in April, S.B. 195, “Transportation Amendments” increased the total amount that is set aside for transportation uses. In two phases, the bill increases the total amount to the Transportation Investment Fund of 2005 (TIF) from 19.24% to 26.24%, first increasing the total transfer in FY 2026, and then simplifying the calculation into a single step for FY 2027 (shown as (4)(e) in the orange section of the chart below). This is expected to shift approximately $342 million from the General Fund to the TIF in FY 2027. Budgetarily, the increases will be partially offset by an ongoing reduction of $330 million to the TIF appropriation from the General Fund, beginning in FY 2026. Forecasts for the state’s General Fund revenue consider the amounts that are set aside for specific purposes, to provide the expected amount of unrestricted General Fund. As a result, the increase to the TIF earmark will be mirrored by a corresponding decrease in anticipated unrestricted state sales tax revenue.
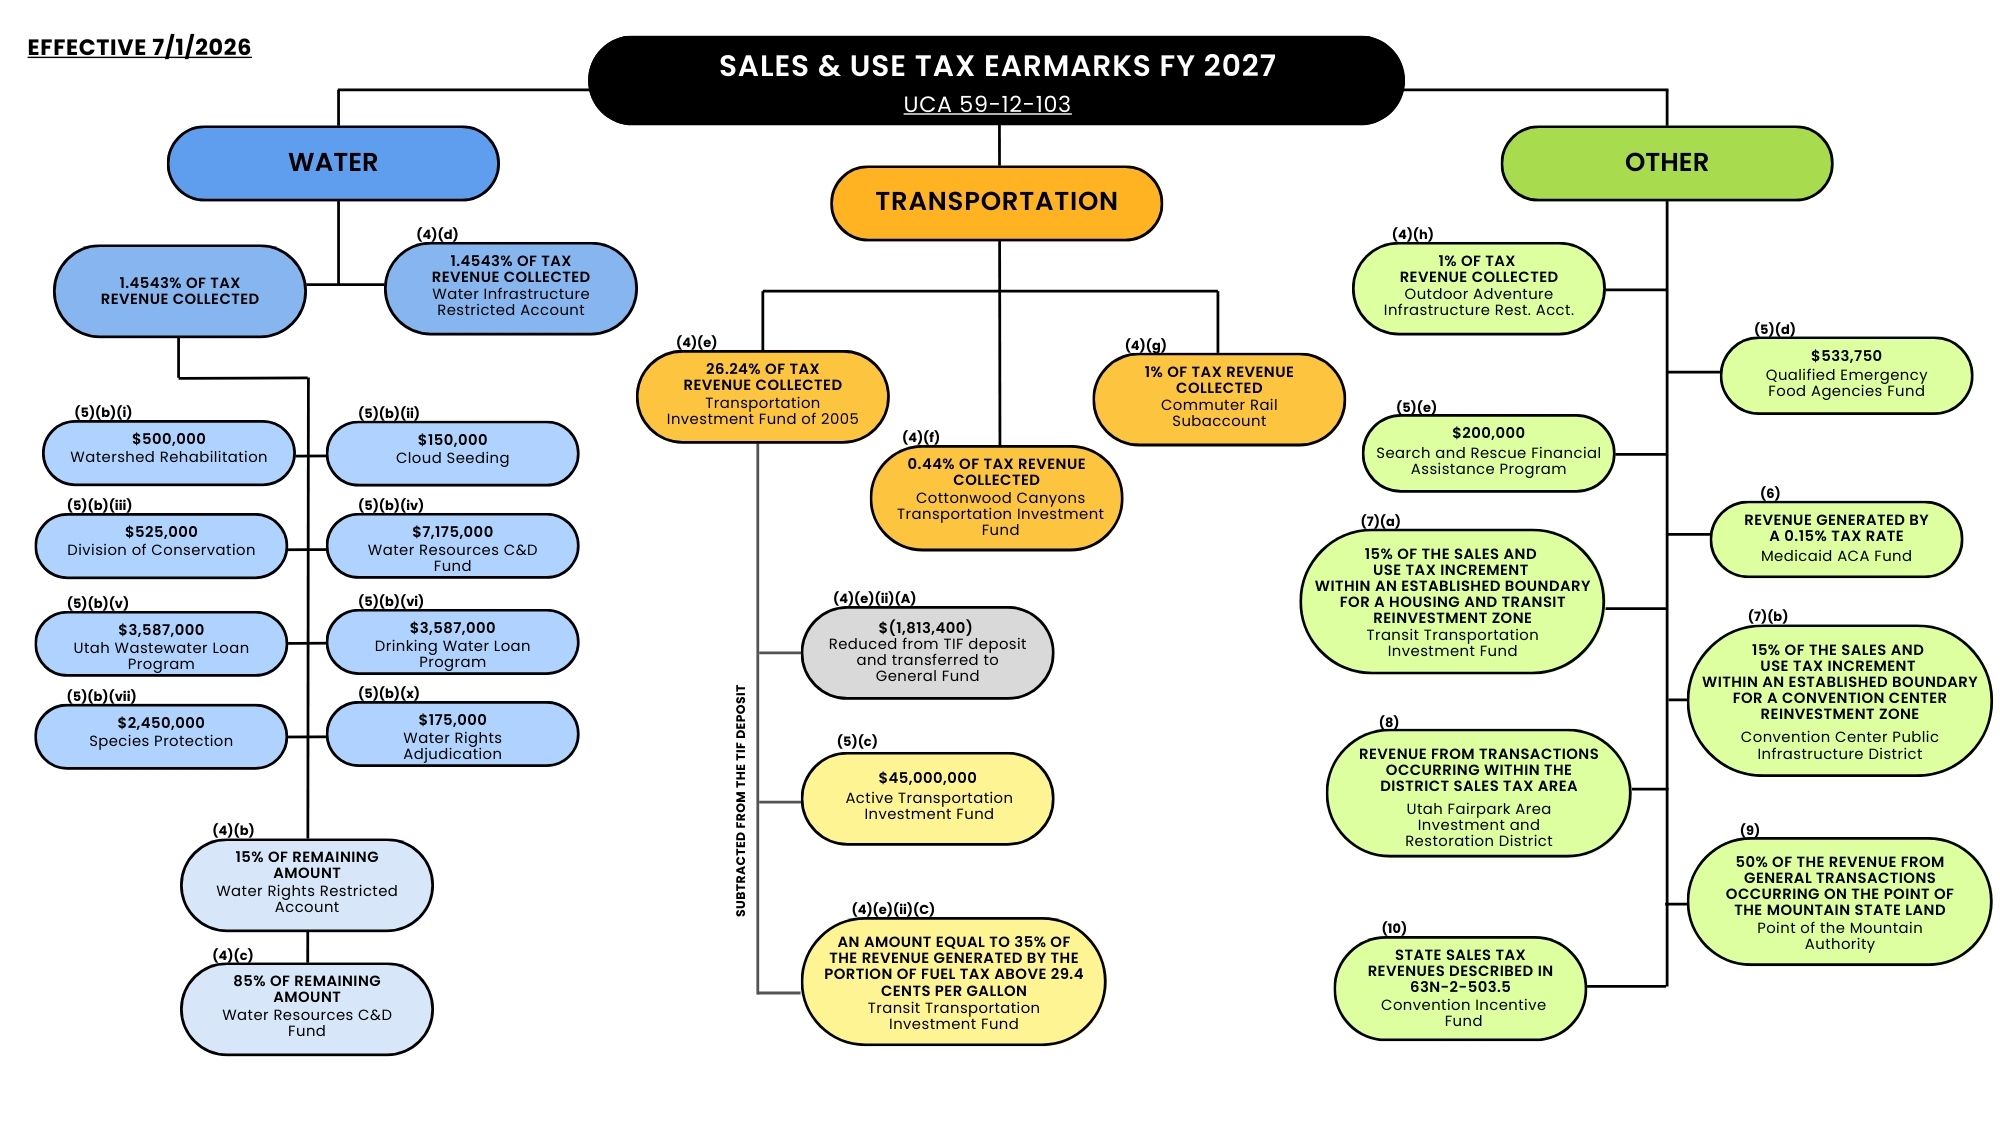
Additionally, these bills made changes to the way reductions to the TIF deposit are implemented. Previously, a portion of revenue was set aside for the Transportation Investment Fund of 2005, which was reduced by the designated deposits for the Cottonwood Canyons Transportation Investment Fund and the Commuter Rail. Moving forward, these deposits will be set aside independently, and the only reductions to the TIF deposit are from the transfer to the Active Transportation Investment Fund and the portion for the Transit Transportation Investment Fund. Through FY 2025, $1.8 million was reduced from the TIF deposit and transferred to the General Fund. This transfer was removed in S.B. 195 but reinstated in S.B. 27 (effective July 1, 2026). It is expected that this will be corrected in an upcoming session which would allow the Department of Transportation to continue using the funding for litter and carcass removal services.
Some of the lengthier transportation formulas also received a revamp. For example, the Active Transportation Investment Fund was previously set up to receive 5% of the following amounts, with a cap of $45 million:
- (A) the amount of revenue generated in the current fiscal year by the portion of taxes listed under Subsection (3)(a) that equals 20.68% of the revenue collected from taxes described in Subsections (7)(a)(i) through (iv);
- (B) the amount of revenue generated in the current fiscal year by registration fees designated under Section 41-1a-1201 to be deposited into the Transportation Investment Fund of 2005; and
- (C) revenue transferred by the Division of Finance to the Transportation Investment Fund of 2005 in accordance with Section 72-2-106 in the current fiscal year.
To simplify, beginning in FY 2027, the Active Transportation Investment Fund earmark will be set at a flat rate of the previous cap, $45.0 million annually.
Other Sales Tax Updates
- Since FY 2023, 1% of sales tax revenue has been deposited into the Outdoor Adventure Restricted Account. Starting in FY 2026, the amount that exceeds the deposit made to the account in FY 2025 will be split equally between the Outdoor Adventure Restricted Account and the Utah Fairpark Area Investment and Restoration District (S.B. 336, “Utah Fairpark Area Investment and Restoration District Modifications”).
- Starting in FY 2026, $525,000 which was previously deposited into the Agriculture Resource Development Fund for projects was shifted to the operating and capital budget of the Division of Conservation to fund staff (H.B. 253, “Agriculture and Food Amendments”).
- Beginning January 1, 2026, 50% of the sales and use tax increment from transactions occurring within an established geographic boundary will be transferred to a Convention Center Public Infrastructure District (S.B. 26, “Housing and Transit Reinvestment Zone”).
For those still hungry for more revenue news, you can find the first quarter revenue collections for FY 2026 in the following reports:
October (Q1) Revenue Snapshot (FY 26)
Tax Commission Revenue Summary (Period 3, FY 2026)
Revenue Publications Archive
Muninn: A Bird’s-Eye View of Utah’s Revenue
In Norse mythology, the god Odin relied on his raven, Muninn (meaning memory), to fly across the world and bring back information. The Utah Legislature now boasts their own version of this valuable bird—a powerful new application designed to return critical data on the state's financial health.
Formally launched by the Legislative Fiscal Analyst (LFA) during the November Executive Appropriations Committee meeting, Muninn is an interactive tool designed to provide clarity amidst a complex economic landscape. The application's robust dataset along with carefully designed features may just leave you saying:

What Muninn Sees
Currently, navigating our economy may feel like "uncertainty" is the only certainty. For those responsible for crafting Utah’s budget, this raises critical questions about what trends truly matter. Enter Muninn. The monitoring application moves beyond the static monthly snapshots of the past to deliver dynamic, transparent, and actionable revenue tracking. Armed with the state administered revenue and tax accounting database, Muninn curates a wealth of knowledge and packages the information in an easy to interpret format.
Just as its namesake observed the world, the Muninn app offers a comprehensive view of state finances through several key features:
- Latest Data: The application provides daily updates on major state revenue sources, adjusted for timing anomalies like holidays to ensure consistent comparisons. This frequency provides users with a complete picture that accommodates events like delayed filings, an improvement on the previous static view.
- Looking Ahead: Users can access projections and overlay the latest Consensus Forecast, allowing for an immediate comparison between actual collections and future predictions.
- Historical Memory: True to its name, Muninn offers year-to-date comparisons stretching back to 2007, providing the historical context needed to evaluate if current trends are typical or exceptional.
- Enhanced Vision: The data focuses on the unrestricted portion of collections—the actual funds available for discretionary appropriations.
Not a Data Scientist? No Problem.
Recognizing that complex financial data can be intimidating, LFA has built an interactive demonstration specifically for first-time users.
Accessible via the "Demo" tab, this feature is more than just a technical walkthrough; it offers a guided journey through the state's revenue analysis. It provides the background context on how the analysis works and the LFA's journey to implement it, rather than just showing you where to click. The tutorial is designed to build your knowledge incrementally, ensuring that by the time you reach the live data, you understand exactly what you are looking at. For the best experience, the team recommends viewing this visual-heavy demo on a larger screen, such as a tablet or desktop. For an alternative walkthrough of Munin, check out this presentation from legislative economists.
The November Snapshot
As stated previously, past and future versions of the revenue snapshot are now housed within the application, available here: https://revapp.utleg.gov/snapshot. The app uses simple weather icons to show how revenue sources are performing against their projections. For November, Muninn has returned with the latest data, and the forecast is looking cloudy with a chance of budget cuts.
General Fund - ☀️ Sunny: The General Fund is currently outperforming expectations. While overall growth is negative (-5.66%), it is holding up better than the projected -6.03% decline. This resilience is largely driven by Sales Tax collections, which are tracking 'partly cloudy' (within the projected range).
Income Tax Fund - ⛈️ Stormy: Here is where the clouds gather. The Income Tax Fund is currently 'stormy,' meaning it is tracking below its projected range. Corporate Tax collections are down significantly (-71.04%), and Net Withholding is also missing its positive growth target.
Transportation Fund - ☀️ Sunny: This fund is a bright spot, showing strong year-over-year growth of 11.51%, significantly beating the projected 3.11% target.
Overall Outlook - ☁️ Cloudy: When you combine the resilience of the General Fund with the struggles of the Income Tax Fund, the overall state revenue picture is 'cloudy'. Total collections are tracking below the forecasted path, signaling that caution is needed as we move forward into budget season.
Muninn provides context to point-in-time estimates, providing a fuller picture for revenue collections. Improved user experience and new features are already in the works, including how specific collections relate to the broader state economy. The application aims to help policymakers monitor Utah’s budget stability, assist legislators in asking the right questions, and empower constituents with the transparency they deserve.
Passing Inspection: Stress-Testing the State’s Fiscal Foundation
In the field of structural engineering, a stress test is not a prediction of failure, but a verification of resilience. Engineers apply hypothetical, extreme loads to ensure that even under the worst possible conditions, the structure remains sound. Since 2018, Utah has applied this same rigorous examination to its financial foundation. UCA 36-12-13 requires legislative economists to conduct a comprehensive budget stress test in a three-year cycle as part of a package of long-term fiscal health analyses. The stress test aims to answer a fundamental question: if the economy were to take a turn, does the state have enough reserves to keep the lights on without cutting essential services or raising taxes?
The recently released 2025 Update (FY 2026 Stress Test) represents the third iteration of this exercise. The findings offer a nuanced look at a state budget that is both more prosperous and more exposed than it was during the last major check-up in 2022. As a result, while the state’s total reserves have grown significantly, the Value at Risk has also climbed. In contrast to this post from October, which examined the value of contingencies invested in gold, the stress test reviews the relationship between total reserves and the ability to utilize those assets in various economic downturns. The punchline from the FY 2026 Stress Test is a recommendation from legislative economists for proactive rebalancing between buffers of varying accessibility.
The $7.5 Billion Structural Load
The central metric of the stress test is the Value at Risk (VaR). This figure combines two factors: the revenue the state might expect to lose due to a contracting economy and the extra money that the state might have to spend on countercyclical programs (i.e. programs that require more resources when the economy slows, like Medicaid). In the 2022 report, the five-year VaR for a severe recession was estimated at $5.6 billion. The 2025 update shows that this risk has expanded to approximately $7.5 billion. This 34% increase in potential risk is driven by several factors, but none is more significant than the inherent volatility of the Income Tax Fund.
Economists identify the Income Tax Fund as the source of 75% of the revenue at risk. Because this fund is heavily influenced by corporate profits and non-wage personal income (such as capital gains), it acts as a highly sensitive barometer for the broader economy. When the market swings, this fund swings harder.
In addition to these changing dynamics inherent to the budget, building on improvements made in the Long-Term Budget, the FY 2026 Stress Test employs a more rigorous methodology than the 2022 report. Previously, a "flat baseline" was used for the final years of the five-year window. The new report uses a "forecasted baseline," which accounts for expected growth that would be lost during a downturn. This change provides a more realistic—and more sobering—look at the true cost of an economic contraction, ensuring that policymakers are not lulled into a false sense of security by outdated modeling techniques.
The Reinforcements
To counter a $7.5 billion risk, Utah maintains an inventory of budget buffers totaling $11.1 billion, up from $9.2 billion in the 2022 report. However, economists emphasize that not all buffers are created equal. Budget contingencies are incorporated into Utah’s Fiscal Toolkit based on how quickly and easily they can be deployed during a crisis.
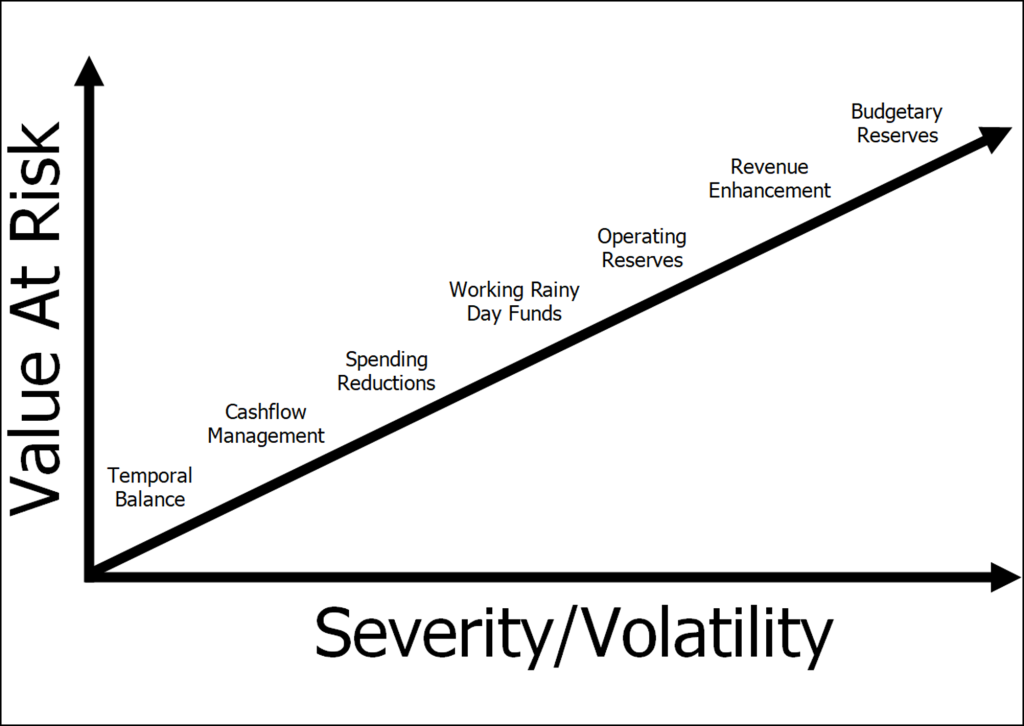
This categorization is essential because a reserve that requires a constitutional amendment to access is less useful in a fiscal crisis than an ongoing appropriation that can be redirected by a legislative vote. Apart from revenue enhancement (i.e. increasing taxes), the accessibility of the state’s budget contingencies roughly align with the severity of an economic downtown, where more difficult buffers would only be required in the direst of financial situations.
Mapping that same continuum of use from the fiscal toolkit onto the buffers, translating this conceptual framework into actual dollars available, the state’s inventory is currently divided into four tiers based on accessibility:
- Easy-to-Access: includes cash funded infrastructure appropriations, the so-called “working rainy day funds” which could be redirected and postponed or substituted through debt without disrupting core government operations; it also includes certain restricted accounts for Medicaid, which are designed specifically for immediate use during a revenue shortfall.
- Moderately Easy: primarily includes certain one-time fund balances which may be swept during a downturn as well as the ongoing funding for Public Education Economic Stabilization.
- Somewhat Difficult: consists of additional one-time fund balances which have more restrictive parameters for their use and certain ongoing funds which would require statutory change to access, such as earmarked state sales & use tax collections.
- Difficult: includes constitutional reserves, such as the General Fund and Income Tax Fund Budget Reserve Accounts (the state’s formal rainy day funds), which have strict statutory limits on how and when the money can be spent.
This year’s stress test confirms that Utah’s total toolkit is more than sufficient to cover the up to $7.5 billion risk in every modeled scenario, including a severe recession or a period of stagflation (high inflation paired with low growth). However, economists also notes a key shift in the composition of these buffers: while the total amount of money in the toolkit has increased, the percentage of that money classified as Easy-to-Access has declined relative to the total risk.
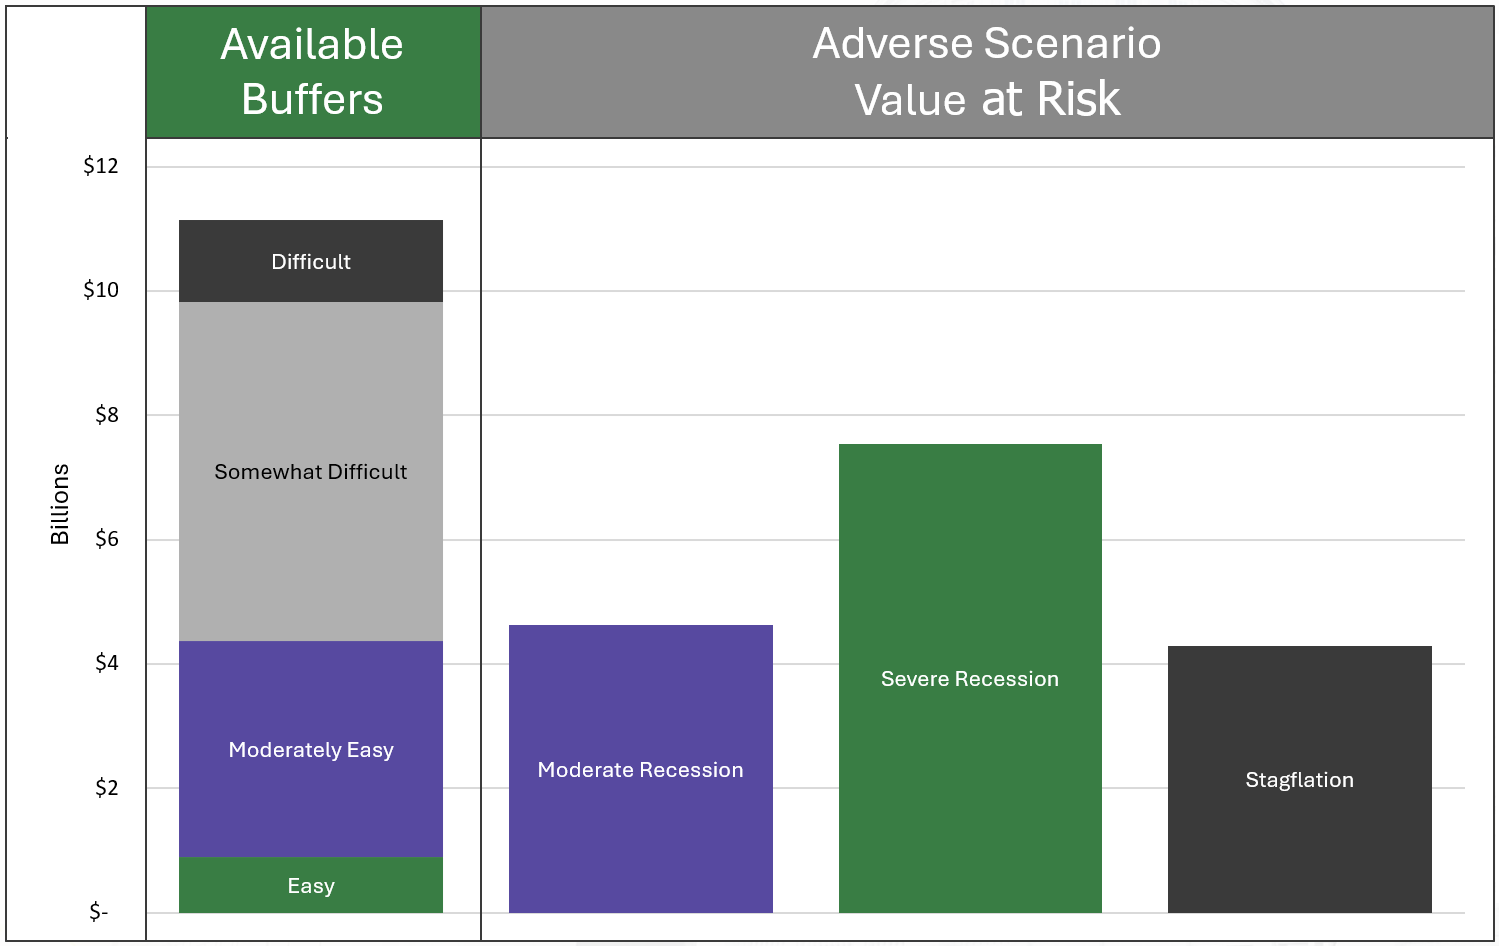
The Retrofit
Because the state has spent several years utilizing cash for significant infrastructure investments (to avoid long-term debt) the most liquid portion of the state's reserves has become a smaller share of the whole. In even a moderate recession, the state would likely exhaust Easy-to-Access and Moderately Easy-to-Access buffers almost immediately. To cover the remaining gap, policymakers would be forced to tap into the more difficult to access categories, which could involve halting major construction projects or navigating complex political hurdles.
By identifying this trend ahead of a downturn, policymakers have the opportunity to adjust the trajectory for budget contingencies. The FY 2026 Stress Test suggests that focusing on rebuilding easily accessed buffers in the coming budget cycle will provide increased flexibility for future legislatures. This forward-looking approach is what has historically prevented Utah from being forced into reactive, across-the-board cuts during lean years. In other words, inspecting fiscal footings today ensures the state has breathing room to navigate the uncertainties of tomorrow.
Winning Peers and Influencing Policymakers: A Performance Vision Board for the New Year
Dr. W. Edwards Deming said “if you can’t describe what you are doing as a process, you don’t know what you are doing.” Over the past year, the Legislature’s Operations and Performance Team (Ops. Team) has done just as Dr. Deming advised, sharing Utah’s efficiency improvement process with several other states. In turn, the team reflected on its own performance, identifying growth opportunities for the future - not least among them streamlined reporting requirements for higher and public education. Through honed efficiency evaluations and improved performance metrics, Utah’s budget is poised for informed decision-making in the new year.
Goal #1: Step on the Scale
A process cultivated through multiple years of legislation (H.B. 326 - 2021 GS, S.B, 296 - 2023 GS, & H.B. 317 - 2025 GS), this year’s efficiency evaluations newly required performance measures to demonstrate how recommended improvements move the needle, either in terms of program output or outcomes. The following example shows the measures developed in the evaluation of the Board of Pardons and Parole’s (BOPP) mental health assessment process:
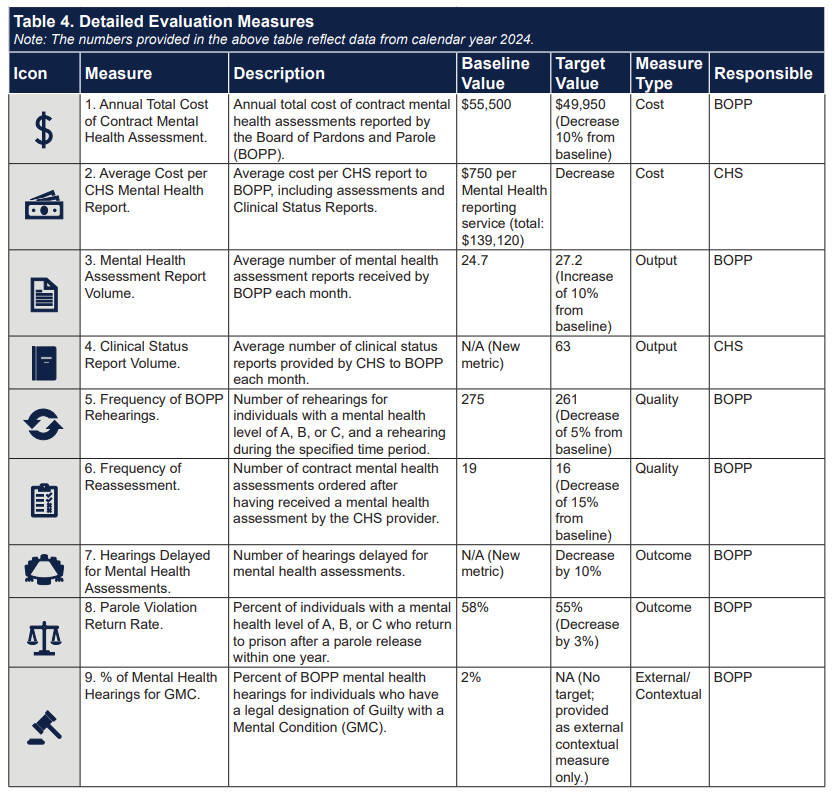
Included measures are intended to demonstrate how recommended improvements make processes more efficient and effective. Specifically, measures 5 and 6 focus on cost reductions from decreasing re-hearing and mental health re-assessments, improving outcomes by reducing delayed board hearings.
This year’s efficiency evaluations include:
- BOPP—Mental Health Assessments (Released September 2025)
- Medicaid Consensus Evaluation—Part I (Released November 2025)
- Department of Environmental Quality—UPDES Permit Process (Anticipated January 2026)
- Department of Veterans and Military Affairs—Claims Assistance Process (Anticipated January 2026)
Evaluations completed in 2025 will include set of performance measures that will be reported annually in August, as part of the normal reporting cycle with other ongoing measures from state agencies.
Goal #2: Find a Supportive Peer Group
Since the team’s inception, it’s become increasingly clear that Utah’s cross-branch approach to performance-informed budgeting is novel and has been cited as a leading example among peer states. Coordination by the Legislative Fiscal Analyst’s (LFA) and Governor’s Office of Planning and Budget (GOPB) was one of the reasons the North Dakota Legislature’s newly created Task Force on Government Efficiency requested a presentation from the Ops. Team on our frameworks and practices, with the goal of developing a similar program in their state.
This December, the LFA Performance Team convened with staff from other states as part of NCSL’s Governing for Results Network. The two-day event created a forum for sharing best practices and identifying growth opportunities in other states’ processes. While Utah incorporates evidence-based budgeting in many steps of its appropriation process, legislators and staff from other states had particular interest in how performance measures for funding items are developed, providing another opportunity to showcase Utah’s level of collaboration across branches of government:
- Legislators Identify Outcomes in Their Requests for Appropriation (RFA): Joint Rule 3-2-701(4)(b)(x) requires legislators to identify “…one or more outcomes the legislator expects the project or program to achieve,” which each submitted RFA form collects and is presented in an appropriations subcommittee.
- Agencies, LFA Analysts, and GOPB Analysts Finalize Measures: Finalizing performance measures for appropriated funding items allows agencies the opportunity to provide feedback on possible measures according to Utah Code 63J-1-903(6)(a) that LFA and GOPB analysts approve.
Utah’s multi-stakeholder approach established in both rule and statute was a major point of interest among legislators from other states.
This event also provided a forum to consider enhancements in Utah’s performance data collection and communication. Examples from other states to increase evidence-based budgeting include:
- Defining Levels of Evidence: Minnesota Management and Budget utilizes standardized ratings of evidence to enhance understanding during the state’s appropriations process about what types of programs have demonstrated success.
- Inventorying Programs and Corresponding Performance Measures: Tennessee’s Office of Evidence and Impact created program inventories, such as this example for its Department of Agriculture, providing a succinct list of agency programs and interventions along an evaluation of corresponding performance measures.
- Enhanced Reporting through Quarterly Submissions: New Mexico’s Legislative Finance Committee highlighted its ‘LegisStat’ system dashboards, which include quarterly reporting of performance data and a central repository for all agency evaluations.
- Modeling the Performance Measures: The Colorado Governor’s Office of State Planning and Budgeting utilizes an evidence model, ranging from evidence-informed, to promising, to proven as it considers budget requests. This systematic approach could enhance Utah’s current process by focusing investments on programs and projects that are closer to ‘proven’ on the evidence continuum.
Goal #3: Stop Procrastinating
The Funding Item Follow-up Report and Line item Performance measures in COBI are the core deliverables of Utah’s performance measure processes, both of which have undergone several iterations of process improvement. This year’s enhancements focused on improved communication. Our team worked with GOPB and the Division of Technology Services to develop agency- and analyst-specific action items clearly listed within the performance measure collection system that are reinforced with targeted email communications. Ensuring timely reporting of performance information allows analysts to focus on developing recommendations for the Legislature instead of devoting time to following up with agencies.
A recommendation the Ops. Team made to Legislative Management Committee in December was to synchronize the reporting by public and higher education agencies with the rest of state government. The following slide highlights some of the disadvantages of delayed reporting and some of the challenges it presents for these agencies:
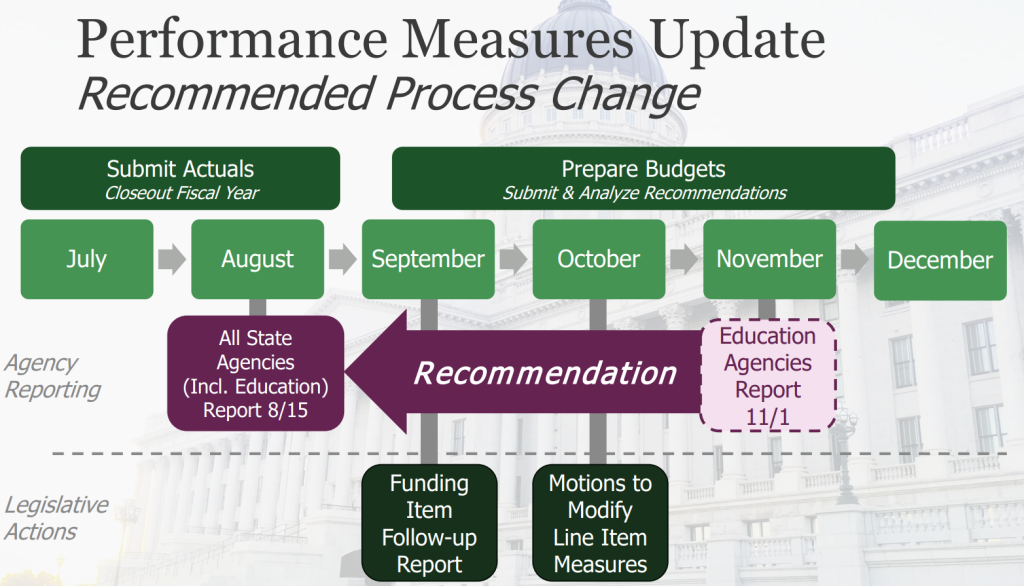
The figure above highlights three major issues with delayed reporting:
- if measures are meaningful, then results should be actively used and readily available;
- appropriations subcommittees typically review and act on future measures in October, therefore, information reported on November 1 impacts the workload of subcommittees during session; and
- submission of implementation, spending, and performance data at the end of October interferes with agency budget preparation activities.
Therefore, the Ops. Team recommends Public and Higher Education align performance reporting with fiscal closeout processes in July and August to facilitate timely information for appropriation subcommittees during their final interim meetings in mid-October.
The Chicken and the Egg: A Budgeting Story
As the 2026 General Session gets cracking, so too does the Request for Appropriation (RFA) process. Before RFAs existed, many bills were drafted solely to appropriate money, even when no policy change was needed, which created a backlog for drafting attorneys. Today, RFAs function as their own structured pathway; one that improves efficiency, transparency, and the Legislature’s ability to prioritize funding during the fast‑paced 45‑day General Session. Even with a well established process, legislators must still accomplish a tricky task: prioritizing funding before revenues have hatched.
The following post summarizes the latest updates to the system along with a more comprehensive overview of the process and timing for budget requests.
The New Pecking Order
To improve transparency, the Legislature has implemented a numbering system for RFAs. Starting this year, you will see specific prefixes that identify the originating chamber of each proposal and a number indicating the order in which the request was submitted:
- H.A.R. (House Appropriation Request) ###: Sponsored by a member of the House of Representatives.
- S.A.R. (Senate Appropriation Request) ###: Sponsored by a member of the Senate.
This convention is familiar, as it’s very similar to the format used for bills. This update allows both staff and the public to better track requests, as identifiers can be used to distinguish topical requests. Instead of asking where the “water request” is at in the process, interested parties can use the specific RFA number. Requests automatically generated from fiscal notes will also be labeled (COBI example), and requests that are duplicative also will be identified as such (COBI example).
Requests can also be found in one place on the legislative website under "Legislator Requests for Appropriation". Here you can see that some legislators choose to cast a wide net with many requests, while others prefer to put all their eggs in one basket.
You Can’t Make an Omelet Without Breaking A Few Eggs
The graphic below describes the life cycle of an RFA in the state budget:
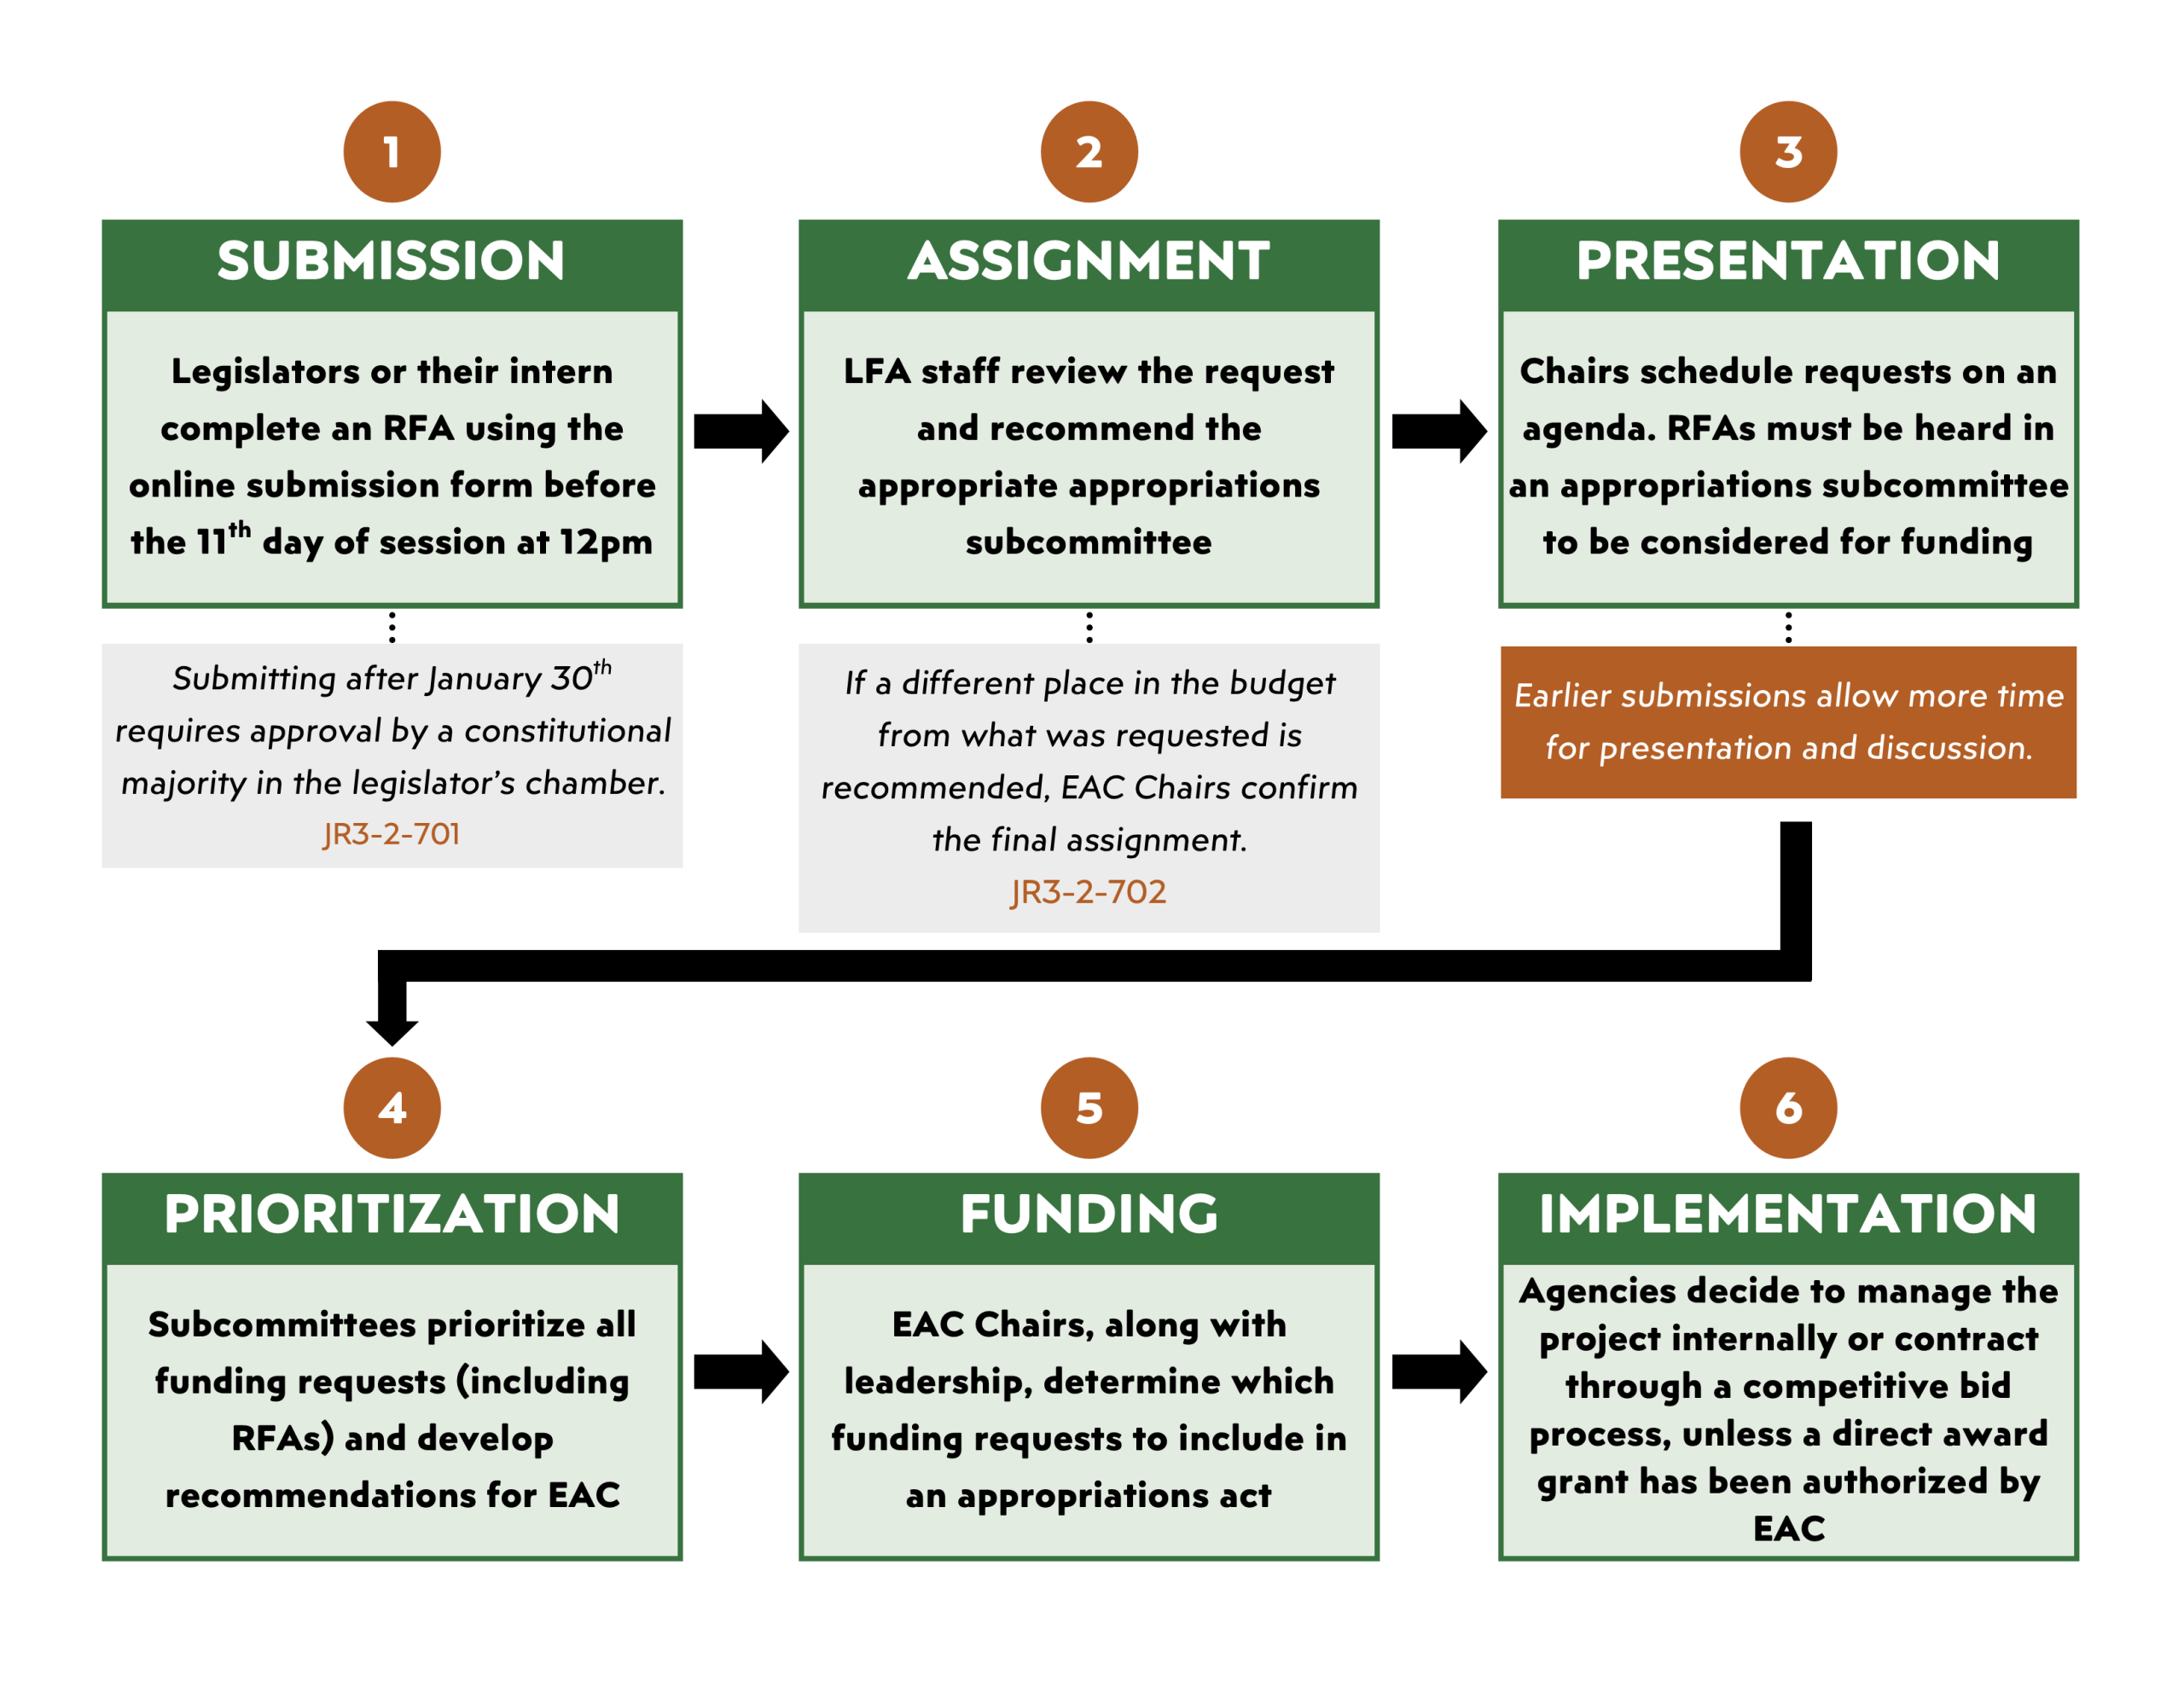
Every RFA must be presented in a public meeting to be eligible for inclusion in the final budget. Subcommittees review RFAs alongside existing base budgets and also items from the governor's budget. When revenues are limited, reductions options identified by subcommittees help create capacity for higher‑priority requests. This balancing act allows legislators to weigh ongoing needs against emerging opportunities, ensuring that any additions to the budget are supported by sustainable funding.
The Early Bird Gets the Worm
By legislative rule, the deadline to file an RFA is 12 p.m. on the 11th day (or second Friday) of the General Session. This firm cutoff often leads to a last-minute scramble which can limit a proposal's visibility. Take for example data from the last few General Sessions:
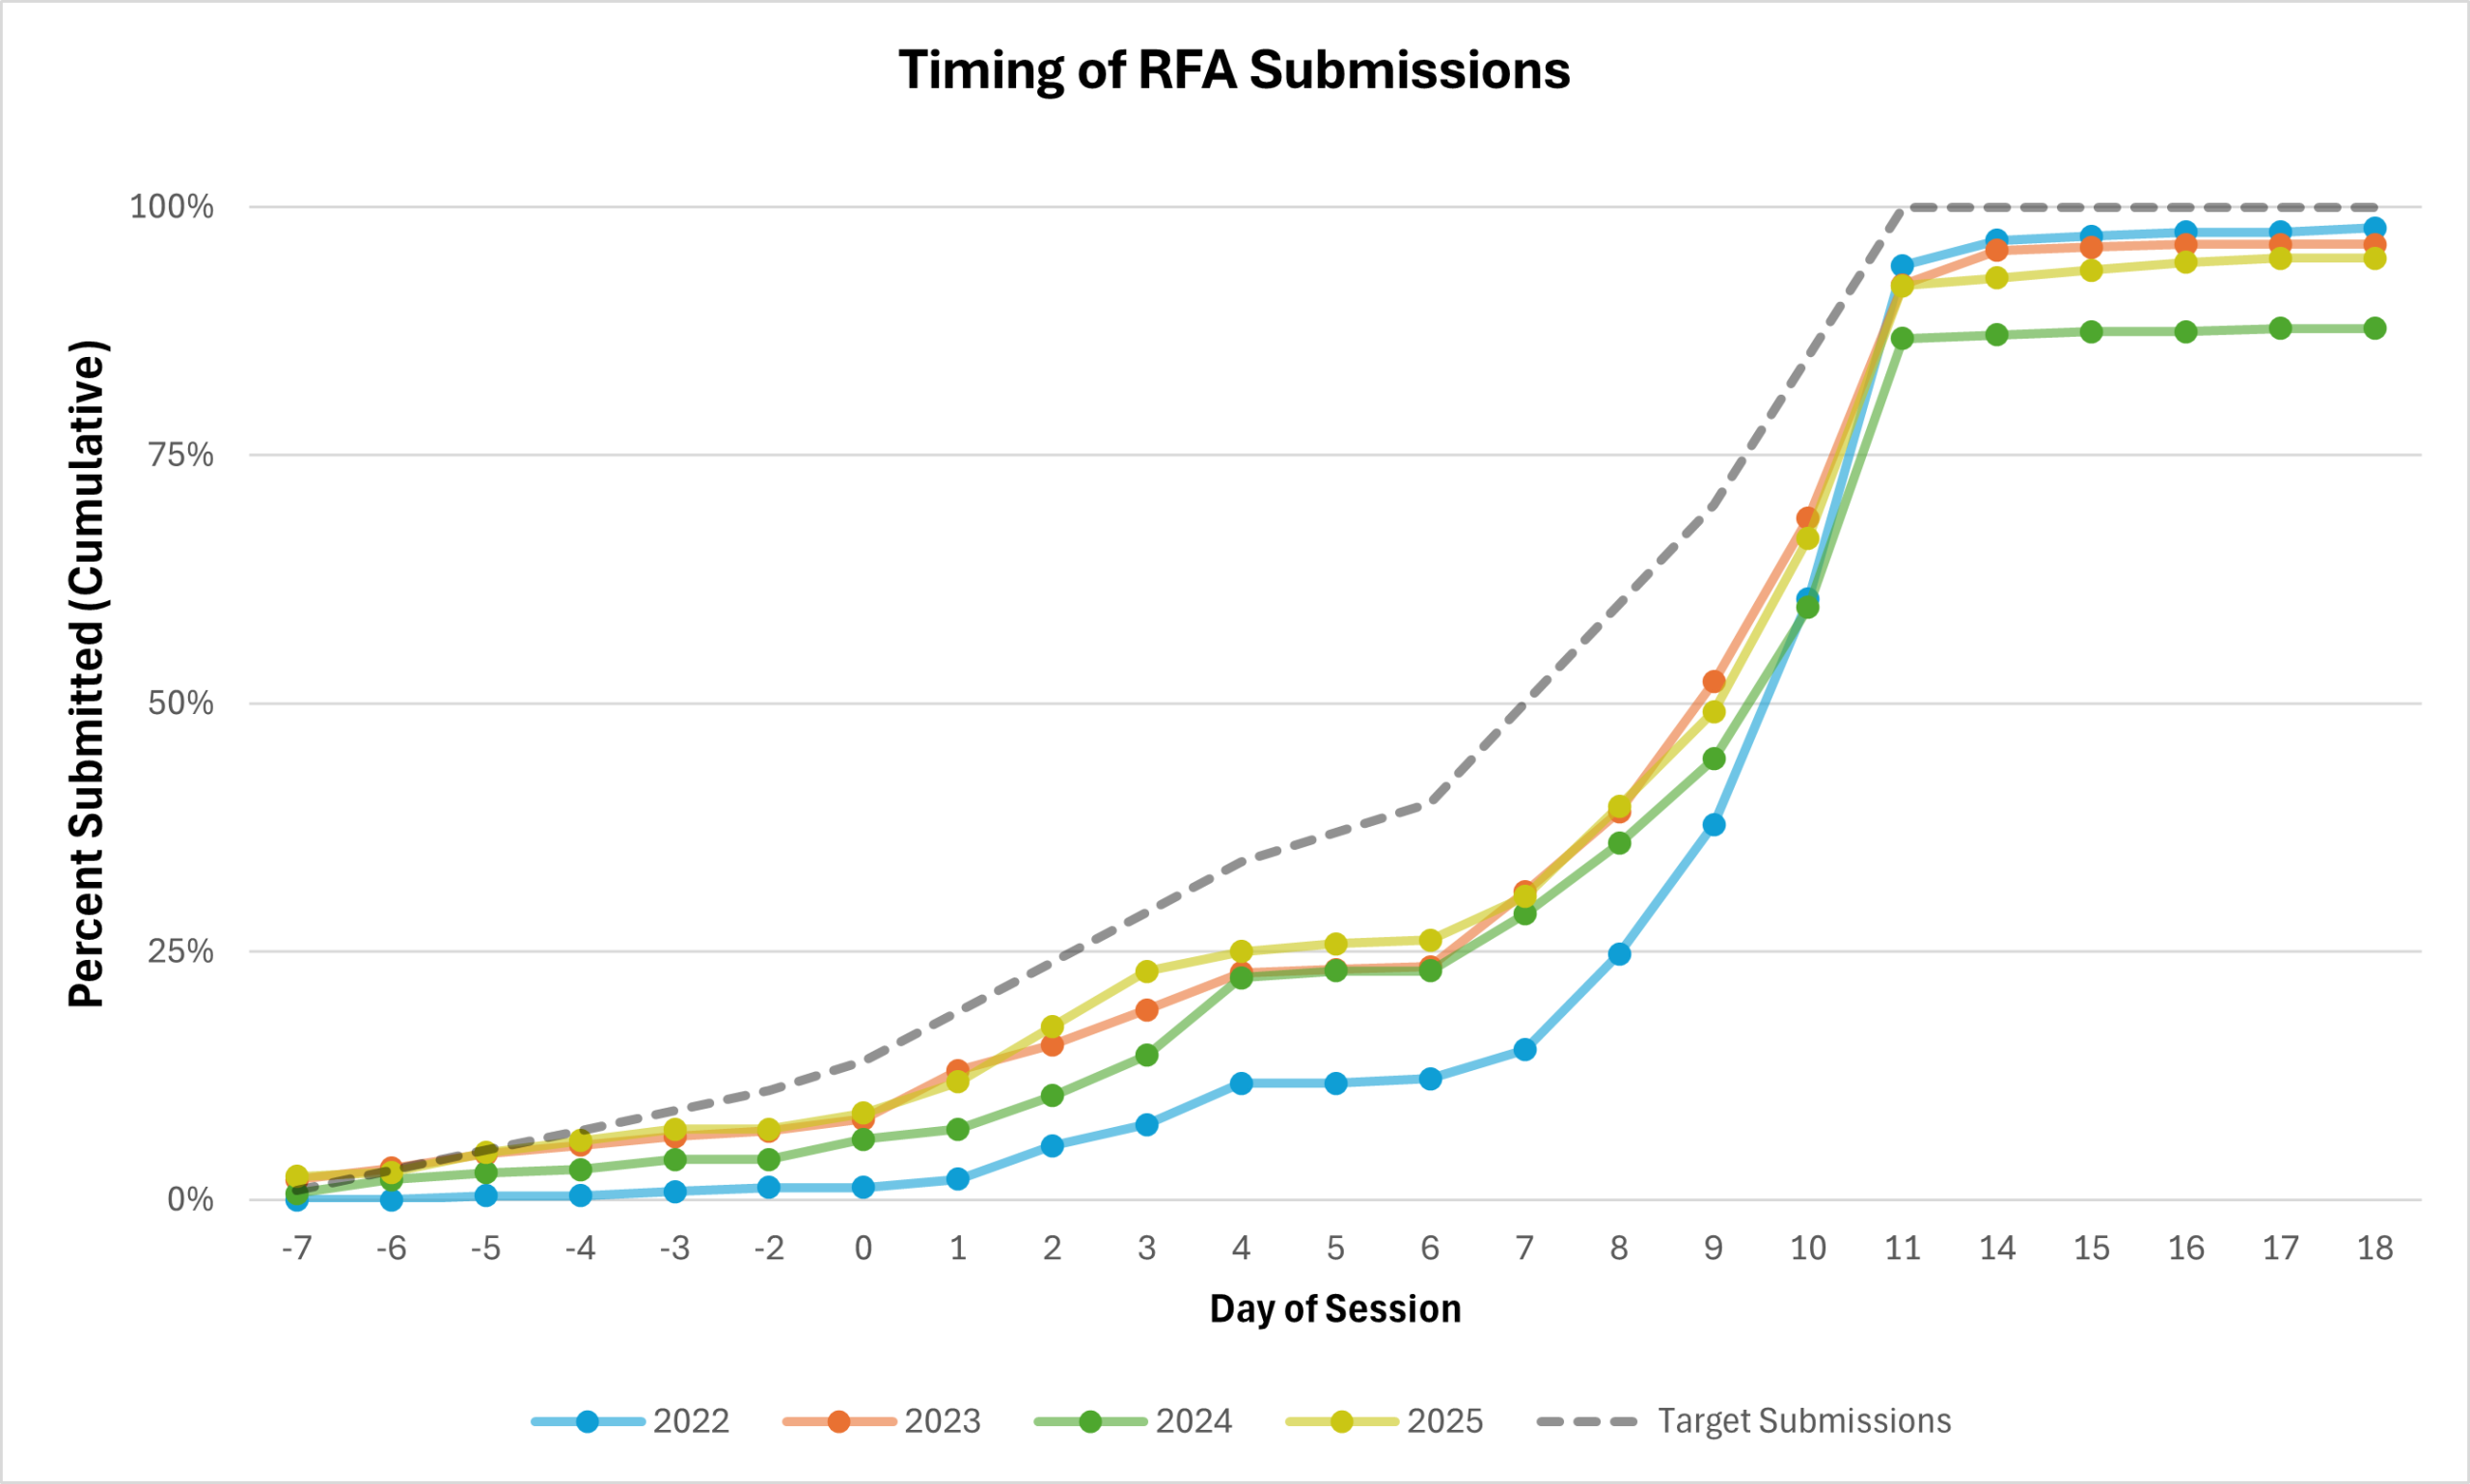
The area between the blue and yellow lines in graph above shows the improvement in timing made in the last four years. Since 2022, legislators and their interns have reduced the percentage of all requests submitted at the deadline, submitting requests about two days earlier on average. Ideally, a higher percentage of RFAs would be submitted prior to session and during the first week, providing subcommittees with the opportunity to schedule presentations more evenly during each of their scheduled meetings.
The benefit of submitting and presenting early is providing committees and the public with more time to consider requests improving transparency in the budgeting process. After the 11th day deadline, committees only have 2 to 3 meetings with which to fit dozens of requests. While it’s possible to hear more than 30 requests in a single meeting, legislators, staff, and the public end up with only minutes to understand how a sponsor is proposing to spend (in some cases) millions of state dollars.
Counting Chickens Before They Hatch
While this process is designed to provide transparency, it also highlights a recurring challenge: not all proposals can be funded. New appropriations depend on available revenues, with demand far exceeding state resources. In the last four years, RFAs alone averaged nearly three times the amount of all available funding.
The deadline for new funding requests occurs about four weeks before the February Consensus Revenue Estimates are released, creating a structural chicken and egg problem: policymakers must prioritize and rank their RFAs in early February, however the final nest egg won’t be known until later in the month.
As of the time of publication, 36 requests have been submitted with a total ask of $98.0 million one-time and $25.7 million ongoing.
Even with this timing challenge, the RFA process gives policymakers an early look at the full range of funding needs before final revenue figures are available. This process helps legislators ensure a balanced budget before it’s time to fly the coop.
Mad Props: Introducing Utah's Property Tax Dashboard
In Utah, property taxes are a substantial source of revenue despite the fact that the state does not impose these taxes. Instead, political subdivisions such as counties, cities, school districts, and more are funded either partially or completely by levies on property. Many people in Utah believe that their property taxes will automatically rise whenever their property value increases; in reality, the state tax system is designed to prevent this. Local taxing entities are generally required to collect the same total amount of revenue as they did the previous year from existing properties. Because of this, when property values go up, the tax rates are adjusted downward to keep the revenue levels constant.
The only way these entities receive additional funds without a specific tax increase is through new growth, such as when new homes or retail spaces are built on formerly empty land, or improvements are made to existing properties. If a local government needs more revenue than what the current base provides, they must participate in a public “Truth-in-Taxation" process to raise the tax rate and increase their base revenue. This process and property taxes in general have gained a reputation for being opaque and confusing due to their complexity. To help shine a light on this and cut through the complexity, the Office of the Legislative Fiscal Analyst has developed a new tool: Vesta.
Vesta is an interactive web application focused on bringing together diverse and scattered data on Utah’s property system into a more accessible, transparent, and interactive form. Building off the data administered by the Property Tax Division of the Utah Tax Commission, this new tool is designed to help each of the major stakeholders involved with property tax in the state, from policymakers looking to evaluate the property tax system, to residents seeking to better understand the entities which tax them, or even local officials interested in comparisons across entities among their peers.
Vesta provides two primary functions:
- detailed views of individual taxing entities, and
- statewide comparisons based on entity and property type.
The Entity Profile page, which provides users with an in-depth look at any taxing entity within the state, includes the amount of revenue collected over time, growth in the value of the tax base, and shares of the tax base made up by different property types. This perspective makes clear where an entity stands and how it ended up where it is currently. For example, take the chart below showing Tooele City’s tax rate and revenue history:

Notice the period between 2018 and 2021, where the revenue shown in purple stays relatively constant over time. During this same period, the tax rate shown in green decreases each year. Truth in Taxation in action! Where a decreasing tax rate is offset by increasing property values to deliver stable revenue to the taxing entity.
The Statewide Comparison page includes the same measures as the Entity Profile page but also allows users to view metrics across taxing entities within the state. The keys measures of tax base, revenue, and rate can be compared for any arbitrary subset of entities from counties to school districts, municipalities, and more. This view puts entities in proper context and highlights the variation that exists across the state. The chart below shows the composition of all 29 counties’ tax bases in one single view for easy comparison:
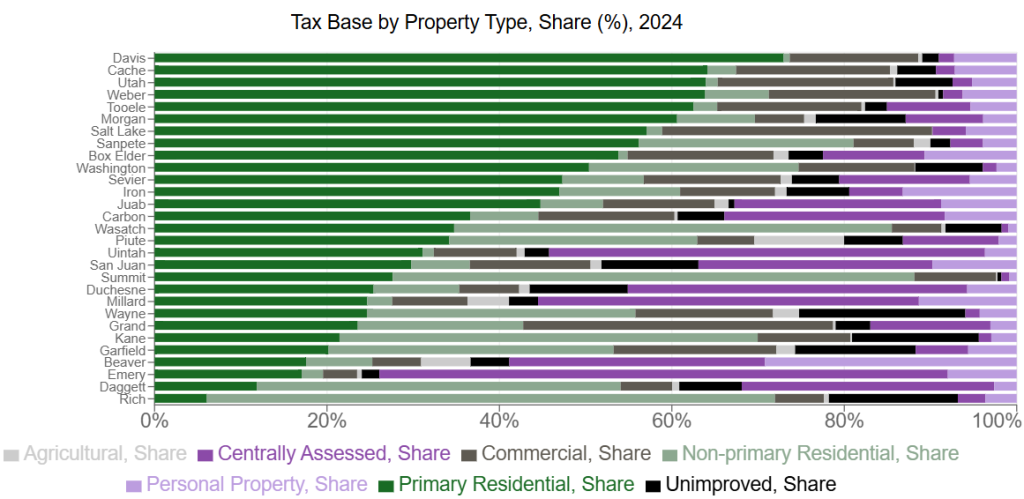
This view of the counties makes it effortless to see what types of property each county relies upon to generate their revenues. Davis represented in the top bar has the highest share of primary residential property (dark green), while Emery shown third from the bottom has the heaviest reliance on Centrally Assessed property (dark purple).
For those eager to dive deeper into this exciting area of taxation, Vesta also includes a glossary of key concepts and an analysis page. The glossary provides explanations of property tax terms and concepts along with citations to Utah law which codifies them. On the analysis page, users will find a library of published investigations into specific aspects of the state’s property taxes. This library is expected to grow as more mechanisms of the system are examined, so be sure to check back regularly for updated insights.
Vesta is still in its early stages of development, with additional features in the works to bring the property tax system to life. One of the first expected improvements is viewing data by taxing geographies in addition to taxing entities, including a mapping interface. As this new tool grows and develops, the Legislative Fiscal Analyst welcomes suggestions and feedback about your user experience (propapp@le.utah.gov).
The Performance Cycle III: Unmasking State Spending
Today is Friday the 13th, which most people might associate with bad luck, spooky occurrences, or maybe even a movie marathon featuring a 1980s cult classic (and its eleven sequels to date). In keeping with that theme, we’re covering something truly scary—the possibility that Utah’s resources might be spent on activities that don't achieve the intended outcome.
Without a way to measure success, spending without insight could feel like a masked antagonist: a funding item that keeps coming back for more and never dies. The Legislature tackles this perpetual challenge by engaging in a regular cycle of performance measurement and evaluation of state spending to ensure no dollar is left in the dark. This post covers performance measure types along with an overview of the performance measurement cycle for both ongoing and new funding.
What is a performance measure?
Before we explain the cycle in more detail, it's worth reviewing the basics. A performance measure is a metric that helps policymakers, agencies, and the public understand how well funding is being used. The graphic below describes the basic performance measure anatomy:

These measures come in many forms, all of which serve different purposes. (Mobile users may view this table better as a PDF in a new window.)
| Measure Type | Description | Examples | Application |
| Outcome Measures | These measures describe the positive changes in Utah’s society, environment, economy, or other areas that the state hopes to see because of state spending. While outcome measures can’t always demonstrate direct causation between state spending and changes in outcomes, they are still some of the most valuable indicators that state agencies are succeeding in their missions and that thoughtful spending is taking us in the right direction. | Public health outcomes like smoking rates and prevalence of mental health conditions. Economic outcomes like employment rates and housing affordability. Societal outcomes like graduation rates and recidivism | These measures can be extremely valuable to high-level decisionmakers, including legislators and administrators, as they determine whether state agencies are making progress toward their overall strategic goals and delivering outcomes that are responsive to their constituents’ needs. These measures are especially important when assessing mature programs or programs that make up a significant portion of state funding. |
| Process Measures | These measures describe how well work is being done, in terms of speed, cost, efficiency, or quality. When paired with outcome measures that tell us that spending is having an effect in a positive direction, these measures can tell us how effectively the state is using available resources to make those outcomes a reality. | Time to deliver a service or complete a task, the cost per unit of work, or the frequency of rework (as an indicator of quality). | These measures are often most valuable for those in managerial roles; process measures can either show where an agency’s operations are working efficiently and using resources well, or pinpoint where there might be bottlenecks that limit potential impact. These measures can also be very useful in state operations that are more public-facing or customer-oriented; improvements in timeliness and efficiency can be very salient to Utahns’ experiences and perceptions as they interact with state government services. |
| Input and Output Measures | These measures describe what resources have gone into a system and how much work has been completed using those resources. While these measures aren’t as meaningful as outcome or process measures, they can still give useful context as to the scale of an operation, are generally easier to measure, and provide the foundation for calculating many important process measures. | Funding received, staff hired, acres treated, events held, or the number of tasks completed. | While these measures are not as helpful as process or outcomes measures in evaluating the overall success of a program or spending, they can still provide some insights into the capacity and activity of a program; for instance, they can help identify whether backlogs may start to form over time if demand for a service is outstripping a program’s current output. These can also be used in new programs that have not had enough time to collect long-term outcomes data. |
A Sequel Worth Watching
For both the base budget and new funding requests, performance measurement follows the same fundamental cycle: Approve, Track, Report, Inform. Specific metrics, referred to in our budget process as performance measures, are assigned at the line item or funding item level and follow that state spending through the funding lifecycle.
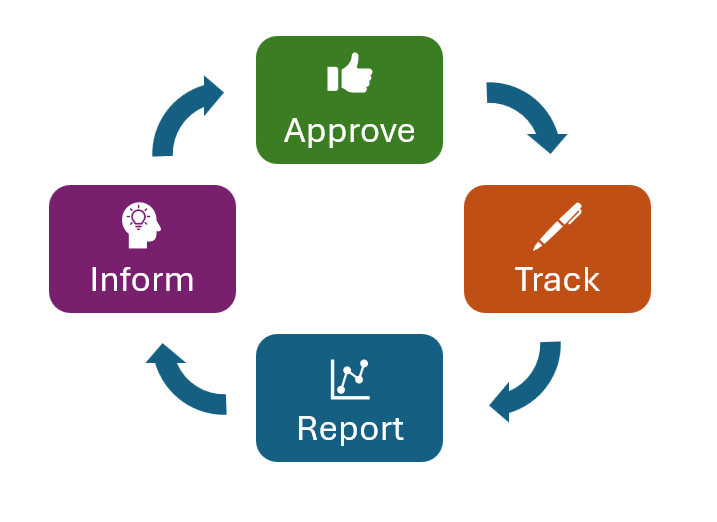
This creates a feedback loop that gives policymakers insight into which spending decisions have had the greatest positive impact (or which are proving ineffective). They can then integrate that information into future budgeting decisions, whether that be to increase funding for effective spending, recommend improvements to make spending more impactful or efficient, or reallocate funds from ineffective efforts to more promising items.
Measuring Ongoing Spending
When performance measurement was first introduced into the budget cycle, the Legislature required that at least three performance measures be associated with each line item in the state’s budget. Now, metrics are assigned based on clarity of outcomes and size of state investment. As such, the performance cycle for line-item measures consists largely of tracking trends for the same measures over time, but these ongoing metrics are reviewed annually and can be added, changed, or removed as needed.
- Approve: Each fall during interim meetings, the Legislature can authorize changes to existing line-item measures, as well as the addition or removal of line-item measures. These decisions are informed by LFA’s staff recommendations, which are developed with input and collaboration from executive branch agencies and the Governor’s Office of Planning and Budget. Once approved by EAC, each line item’s performance measures are included as intent language in the base budget bills.
- Track: As agencies implement programs and spend their state appropriations for each line item, they also track data on associated performance measures for the entire state fiscal year, beginning July 1 and ending June 30.
- Report: After the end of the fiscal year, agencies have 45 days to compile data and report results back to the Legislature. This data is delivered back to the Legislature through a centralized platform called "Performance Prep", where the end-of-year actuals and additional contextual information is compiled for analysis and reporting.
- Inform: Before Fall interim meetings, the collected performance measure results are published on the Legislature’s Compendium of Budget Information (COBI) webpage and reported back to legislative appropriation subcommittees and EAC. This information, which provides both a snapshot of current performance and a view of trends over time, is integrated into budgeting discussions and decisions. Once again, measures are adjusted as needed and the cycle begins again for the new year.
Measuring New Spending
During the General Session, the Legislature considers hundreds of requests for new funding, including recommendations from the Governor’s Office and requests for appropriation (RFAs) made by individual legislators. Any items that receive funding are also included in the annual performance reporting cycle to ensure transparency and accountability for new spending.
- Approve: After items are funded at the end of the session and before the beginning of the fiscal year, each new funding item is assigned its own performance measure.
- Track: Just like line-item measures, as agencies implement new these new funding items, they also track data on the associated performance measure for the entire state fiscal year, beginning July 1 and ending June 30.
- Report: After the end of the fiscal year, agencies have 45 days to compile data and report results back to the Legislature. This data is delivered back to the Legislature through a centralized platform called "Performance Prep", where the end-of-year actuals and additional contextual information is compiled for analysis and reporting.
- Inform: Before Fall interim meetings, the collected funding item measure results are published on the Funding Item Follow-Up Report webpage. These results inform LFA’s recommendations to the Legislature, including summaries of which items have been successfully implemented and achieved their targets, recommendations to follow up for additional years of reporting if needed, or recommendations to reduce or reallocate funding from items that have not proven successful.
Just as the performance cycle seeks to continuously improve Utah’s use of valuable state resources, the Legislative Fiscal Analyst is also refining the way that performance information is created, collected, and integrated into the budget process. Keep an eye out for new developments such as an enhanced focus on performance measures in this year’s Accountable Budget Process and clearer connections between agencies’ performance measures and their strategic plans, because when it comes to the state budget, the only thing policymakers should be afraid of is spending without accountability.
Fiscal Field Guide: Cultivating the State Budget
The Soil: Base Budgets
Every successful harvest begins with the quality of the soil. In Utah, that "soil" is the base budget; the essential, ongoing funding that keeps state services rooted and resilient. Last year’s 4.8% revenue growth allowed the state to weather the impact of recent federal tax changes (H.R. 1/OBBA), which reduced income tax liability for Utah taxpayers by over $500 million.
Base budgets for the current budget cycle added $275 million in new funding. Increases included roughly $225 million towards Public Education, amounting to a 4.2% bump in the Weighted Pupil Unit (WPU), the primary nutrient for classrooms.
Considering these two large investments, the Executive Appropriations Committee (EAC) directed subcommittees in December to recommend 5% in ongoing reductions to their state fund budgets.
The Seed Catalog: Subcommittee Priority Lists
During the first three weeks of the General Session, the eight appropriations subcommittees acted as master gardeners, reviewing hundreds of seedlings, in the form of requests for new funding from both agencies and legislators. The culmination of their hard work is included in their recommendations to EAC which are linked below:
- Criminal Justice
- Economic and Community Development
- Higher Education
- General Government
- Natural Resources, Agriculture, and Environmental Quality
- Transportation and Infrastructure
- Public Education
- Social Services
The Weather Forecast: February Revenue Estimates
Like any garden, the budget is dictated by the forecast. The February Revenue Estimates arrived on Friday, offering a mostly sunny outlook:
- Estimates identified $125 million in new one-time funds, largely driven by a $99 million surge in the Income Tax Fund.
- An additional $88 million in ongoing revenue was forecasted, with the General Fund contributing $50 million.
Overall, revenue is expected to reach $11.99 billion for FY 2027, a healthy 3.67% increase even after accounting for the ongoing impacts of federal tax reconciliation.
Pruning and Thinning: The Executive Appropriations Committee
While every seed has potential, in a world of limited resources, not every plant can make it to harvest. EAC now begins the vital work of identifying which requests are best suited to the current fiscal climate.
While the February forecast projects modest growth, revenues may be less robust than policymakers had hoped for. Consequently, it is likely that most of the recommended ongoing state fund reductions identified by subcommittees will be adopted. This budgetary pruning assists with operational efficiency and provides an opportunity for state tax cuts.
The Harvest: Appropriations Bills
As the General Session approaches its conclusion on March 6th, the final produce is gathered into Appropriations Bills. A facet of the harvest is the "Bill of Bills," which bundles all the funding for legislation and final budgetary tweaks into a single, balanced bounty to be considered by the legislature prior to adjournment.
Sine-Nara to the 2026 Utah General Session
As the gavel falls and the 2026 General Session moves to adjourn Sine Die, we find ourselves humming a familiar tune. Before we say adieu, auf Wiedersehen, and goodbye to Capitol Hill for the session, let’s review the numbers. The following post details top legislative budget priorities, set to our favorite fiscal ‘notes’:
Do-llars and Sense
The Utah Legislature concluded its work with a total budget of $31.6 billion for fiscal year 2027. This includes $12.4 billion from state funds, comprised of the General Fund, Income Tax Fund, and Uniform School Fund. As required by the Utah Constitution, legislators balanced the budget to projections of available revenue.
Re-allocations and Tax Policy
Before looking at new spending, the Legislature examined existing resources, finding $364 million (3.2%) in state tax fund offsets, reductions, and program eliminations that were reinvested for better results. Major tax policy highlights include:
- Income Tax Decreases: $314 million in FY 2026 and $201 million ongoing in FY 2027 for state income tax decreases related to federal policy.
- Rate Cut: An income tax rate cut from 4.5% to 4.45% ($101 million ongoing and $23.3 million one-time).
- Targeted Credits: $7.1 million for expanding the nonrefundable child tax credit and $2.9 million for an expanded child care business credit.
- Adjustments: A $39.7 million one-time decrease for fuel tax rates , balanced by a $17.1 million ongoing increase from certain nicotine products and a $4 million one-time bump from state and local tax (SALT) deduction changes.
Mi-llions for Students
- WPU Value: $191.4 million to increase the WPU Value by 4.2% to $4,870 for FY 2027.
- Early Success: $25.6 million for Early Literacy and $25.0 million for the At-Risk Student WPU Weighting Phase-in.
- One-Time Projects: $404.9 million from the Public Education Economic Stabilization Restricted Account
Fa-cilitating Research and Training
- Innovation: $45.0 million for the Higher Education Research Funding Pilot Program and $33.6 million for artificial intelligence capacity building.
- Performance & Growth: $16.6 million for Performance Funding and $7.0 million for technical college capacity.
- Specialized Research: $5.0 million for cancer research , $4.5 million for outcome-based investment research, and $1.8 million for the medical school’s St. George campus.
So-cial Services
- Homelessness: $19 million ongoing and $25 million one-time for a law-and-order approach to homeless individuals with multiple criminal offenses – known as “high utilizsers.” State investment requires a dollar-for-dollar match from local governments.
- Affordable Housing: $10.0 million for First Time Home Buyer Program.
La-bor Force
- State Employee Salary Increases – $104.9 million ongoing to fund a 2.5% labor market increase for state agency and higher education employees.
- Benefit Rate Increases – $42.8 million ongoing to fund an 11.8% health benefit rate increase and 4.9% dental rate increase.
- Pay-for-Performance – $13.5 million one-time to fund pay-for-performance bonuses for eligible executive branch employees and discretionary bonuses for employees in the other branches.
- Workforce Modernization – $9.4 million ongoing, with a one-time offset of ($5.1) million in FY 2027, to implement changes to state employee benefit policies enacted in S.B. 229, State Employee Benefits Amendments.
- 401(k) match – $5.3 million ongoing to fund increases in employee 401(k) contribution matches.
Ti-cket to More Information
A complete, detailed listing of the most significant budget actions according to appropriations subcommittee can be found here: Spending Summary.
There are a number of additional resources available for the public and legislators to understand more about funding changes:
- Budget Quick Facts – A pocket-sized guide to the budget.
- DataViz – An interactive graphical representation of the budget. View the budget by sources, uses, and new money. Click a bubble to see how that item has changed over time, and in what bills it changed. Search for budget requests and find where it exists in appropriations bills.
- Compendium of Budget Information (COBI) – A complete guide to the Utah State budget. Find budget requests on the Issues tab, and Line item/program budgets on the Financials tab.
And that will bring us back to Do-ne with the 2026 General Session.
News
U.S. News and World Report Says Utah Best in the Nation for Fiscal Stability
Volcker Alliance Recognizes Utah's Progress on Long-term Fiscal Health
Utah Tops Annual Ranking of State Economic Outlook
Pew Charitable Trusts Highlight Utah Legislature’s Continuous Efforts to Improve
Utah Among Nation's Leaders at Addressing Deferred Maintenance Obligations
No Shutdown Ahead for Utah Government
Report Encourages Utah to Expand Taxes on Personal Services
Budget.utah.gov Wins Best of Utah Award
Estimated Surplus Makes Case for Tax Reform - And a Tax Cut
Utah #1 for Economic Momentum to Close 2019
Utah Ranks Top in Index of State Economic Momentum for Q4 of 2019
State Policy Reports releases a quarterly Index of Economic Momentum which is based on three growth measures: personal income, employment, and population. Utah’s index was 1.5 percent above the national average, edging out second-ranked Idaho for the top spot in the final quarter of calendar year 2019.
The summary of the Economic Momentum Index is available courtesy of FFIS: click here
Minnesota, Utah Among States Best Prepared for Coronavirus Economic Upheaval
With No U.S. Plan to Return to Normal, Some States Are Creating Their Own
Utah Ranks 3rd in 'Camelot Index' for Quality of Life
State Policy Reports released their Camelot Index on Wednesday, April 29th, which ranks all fifty states on 26 variables, across six categories, aimed at capturing quality of life for their citizens. States were graded on: Economy, Health, Crime, Education, Society, and Government. Utah's consistently high scores across all categories resulted in a bronze medal for the Beehive State.
The Camelot Index rankings are available courtesy of Federal Funds Information for States (FFIS): 2020 State Rankings
Forbes Ranks Salt Lake City and Provo Among Cities Best Poised for Recovery
Pew Highlights Utah's Budget Stress Tests Role in Helping Manage the Pandemic’s Fiscal Impact
Utah Ranked #1 in State Economic Competitiveness Index
What Utah Can Teach Other States About Surviving A Recession
Utah Ranks 5th for Overall Fiscal Stability
How Budget Stress Tests Help Utah Prepare for and Manage Economic Downturns
Utah #1 for Economic Momentum to Close 2020
State Policy Reports releases a quarterly Index of Economic Momentum which is based on three growth measures: personal income (from the Bureau of Economic Analysis), employment (Bureau of Labor Statistics), and population (U.S. Census). For the second year in a row Utah claimed the top spot for Q4. Utah’s index was 2.95 percent above the national average, nearly double the lead The Beehive State held in 2019, which was 1.5 percent above the U.S. average. This was also the second year in a row that Idaho was ranked second during Q4.
The summary of the Economic Momentum Index is available courtesy of FFIS.
Utah's Economy Ranked #1 for Stability & Potential
Utah Ranks #1 in Economic Outlook
Utah Economy Ranked #1 for Performance and Strength
WalletHub Ranks Utah as 'Most Independent' State
Utah Ranked 3rd Best State for Business in 2021
Utah's 2021 GDP Growth Highest in the Nation
Kem C. Gardner Policy Institute Releases 2022 Economic Report to the Governor
Utah's COVID-19 Response Ranks 1st in Nation
Why Utah Leaders Call this Economic Ranking for the State ‘Monumental’
Utah Ranked Best State Overall (including #1 for economy and fiscal stability)
Performanceefficiencyevaluations
Evaluation Reports
These reports provide recommendations to improve the efficiency of a specific government process. The reports are directed to agencies, who are responsible to implement the efficiency improvements. These analyses are a joint effort with the Governor's Office and Office of the Legislative Auditor General, as required under UCA 63J-1-904.
Performancefundingitemfollowup
Follow Up Reports
This report reviews selected items from past Sessions and assesses implementation status, budget accuracy, and performance. The report is used to improve the accuracy of estimated costs or revenues in future Sessions and to identify other budget recommendations.
Performanceperformancemeasures
Performance Measures Training 2023
LFA and the Governor’s Office jointly hosted a performance measures training in April of 2023. The training featured presentations from the National Conference of State Legislatures and the Policy Lab at Brown University, two partners in the “Governing for Results Network”. These resources include overviews on performance measures for funding and line items in Utah, performance measures across states, why and how performance measures are useful, understanding how measures fit into telling a program’s story, tips for creating measures, and understanding the limitations of performance measures.
State of Utah Performance Measure Rubric
This rubric was produced by LFA and the Governor’s Office to document why we measure performance, who measures are for, and the different types of measures. Page 2 of this document outlines what makes good performance measures and how to set an appropriate target.
Performance Measures
This category includes performance measures for budget line items (long-term, ongoing measures) and for new funding items from a particular Session (usually a single report after the first full year of funding). Measures assess the value provided to the State from previous appropriations and track progress on legislative priorities. Line item measures are reported in COBI, while funding item measures are included in the Funding Item Follow Up Report.
State of Utah Performance Measurement Playbook
This roadmap outlines philosophy, structure, and best practices for state performance measures. The playbook serves as a guide to both the legislative and executive branches on performance related statues and code, reporting, anatomy of a measure, examples, and annual workflow.
Best Practices for Measuring Newly Funded Items (Governing for Results Network)
This report from the Governing for Results Network answers how we measure performance on difficult-to-measure, newly funded items. This report uses examples for measuring performance of buildings and new construction, written reports and research projects, feasibility studies, lawsuits and settlements, cybersecurity improvements, and hiring new employees.